
Abstract
Patterned fabrics are generally constructed from the periodic repetition of a primitive pattern unit. Repeat pattern segmentation of printed fabrics has a very significant impact on the pattern retrieval and pattern defect detection. In this paper, we propose a new approach for repeat pattern segmentation by employing the adaptive template matching method. In contrast to the traditional method for template matching, the proposed algorithm first selects an adaptive size template image in the repeat pattern image based on the size of the original image and its local maximum edge density. Then it uses the sum of absolute differences as the matching features to identify the matched regions in the original image, and the minimum envelope border of the primitive pattern, typically as a parallelogram, can be determined from the results of the four adjacent matched templates. Finally, image traversal base on the obtained parallelogram is implemented over the original image using minimum information loss theory to produce a well-segmented primitive pattern with a complete edge structure. The results from the experiments conducted using an extensive database of real fabric images show that the proposed algorithm has the advantage of rotation invariance and scaling invariance and will not be affected when the background or foreground color is changed.
Keywords
Introduction
Patterned fabrics are generally constructed from periodic primitive pattern, which is their most typical characteristic. The pattern primitives commonly consist of the same elements, such as color, shape, and texture. Therefore, most features of repeat pattern image can be attained from the pattern primitive. Therefore, the periodic pattern primitive analysis of printed fabrics has a significant impact on the pattern retrieval 1 and pattern defects detection.2,3
The periodic pattern analysis has been a prominent topic in image processing for a long time. Numerous methods have been proposed to detect the periodicity of repeat patterns. One of the typical methods is the gray level co-occurrence matrix (GLCM)-based methods. Early in 1980, the approach using χ2 computed from the GLCM was proposed by Zucker and Terzopoulus to analyze the structure of a texture. 4 The disadvantages of this method are that it is time-consuming and mostly fails to derive the actual period. To improve the efficiency of the algorithm, Selkainaho et al. 5 used the κ statistics computed from the GLCM to detect the texture periodicity. Subsequently, Parkkinen 6 compared χ2 and κ, demonstrating that the use of κ was more reliable and fast than χ2. Although κ statistics make GLCM-based method more efficiency, it’s time-consuming characteristic still restrain the application of the GLCM in detecting the periodicity of the repeat pattern. Aiming at reducing the computation time of the GLCM-based methods, a binary image is used by Starovoitov et al. 7 Despite the efforts of many researchers to reduce the computation time of GLCM-based methods, they are still computationally expensive because of the consideration of all the possible orientations and resolutions. Furthermore, the use of gray or binary images makes it difficult to identify the actual period in which the gray values of some colors are similar.
To reduce the computation and memory requirements, Unser proposed the sum and difference histograms (SDH) method as an alternative to the GLCM for conducting the texture analysis. 8 SDH describes the probability distribution of the sum and difference between adjacent pixels at a certain distance. It reflects the complex information of the image regarding the direction, distance, and degree of variability when the distribution of the patterns or textures shows some regularities. 9 Lizarraga-Morales et al. uses the homogeneity computed from SDH to extract the texture periodicity corresponding to a square or rectangular unit. 10 In his further research, this method was used to detect defects in fabrics with regular textures, and the experiment results demonstrated that it was superior to other state-of-the-art algorithms. 11 However, an obvious weakness of this method is the lack of color information, so that it cannot be applied to colorful images. To overcome this shortcoming, Li et al. replaced the traditional gray image by the hue-saturation-value (HSV) image and extracted energy cues from the H component of the color image for SDH calculation. 12 Though this method performs well with color images, treating the periodic primitives as square or rectangle is worthy for further consideration.
Some researchers try to solve the problem of periodicity detection using the frequency domain. Given that higher peak value in the Fourier Spectrum represents the main direction of texture patterns and the location of the peaks represents the frequency terms of periodic elements, 13 the Fourier transform is widely used to analyze periodic textures. An approach applying a two-dimensional fast Fourier Transform was proposed by Moussa et al. to detect the periodic structures of plain and twill weaves. 14 Because of the fast Fourier Transform, warp and weft yarns can be individually separated by selecting different peaks in the spectrum range and their period can be obtained. To make the Fourier transform more practical for estimating the period of yarns, local threshold segmentation was performed by Pan et al. 15 after the Fourier transformation and image reconstruction. Ravandi et al. conducted a two-dimensional Fourier transform analysis to detect fabric defects, considering that the defects on a fabric surface will change the regular texture of fabrics. 16 Furthermore, Chan et al. performed a three-dimensional Fourier transform to analyze the period texture of fabrics and proposed the central spatial frequency spectrum approach to increase the efficiency of the analysis process. 17 Although Fourier transform based methods exhibit a robustness to noise and perform well in applications, a disadvantage is its applicability to only solid color fabrics. Another method solving the problem of periodic texture in the frequency domain is wavelet transform. 18 The limitation of this method is a significant requirement of image preprocesses, such as threshold, smoothing, and noise removal.
In addition to the three widely used methods introduced above, there are several effective methods for periodic texture detection that are notable to be followed. Lin et al. used an autocorrelation function to determine the primitive size and present the period texture as a parallelogram. 19 Subsequently, the primitive extracted by this method was employed in image retrieval in their further research, and the experiment results supported the effectiveness and efficiency of this method in practice. 20 An approach using the distance matching function (DMH) for the rapid determination of textural periodicity was proposed by Oh et al. 21 The approach significantly improved the processing time in comparison with the GLCM-based methods. Kuo et al. segmented the repeat pattern of a printed fabric by using a fuzzy C-means clustering algorithm and Hough transform method. 22 The disadvantage of this method is the difficulty in color clustering for processing input images with various colors. Nearly all the methods regarded a static texture as the study object and much less attention was paid to the periodicity of dynamic textures. Chetverikov and Fazekas proposed a method using optic flow and adapting the singular value decomposition-based algorithm for the periodicity detection of dynamic textures. 23 It was a good attempt to detect the period of dynamic textures, and further research needs to be conducted.
Based on the various methods for period detection, we can conclude that for period detection, it is essential to identify the similar part in the periodic textures or patterns. Once the similar parts in the image are found, it is easy to estimate the periodicity of the primitive based on the displacement vectors in the similar parts. Therefore, an efficient method that can determine the similar parts in an image is necessary. Template matching is a traditional algorithm that is widely used in image retrieval and pattern recognition. 24 In numerous applications, template matching typically needs a preset template image, and then some certain features are used to match the preset template image with the original image to determine the matching parts in the original image. 25 However, the need of a static template restricts the adaptability of template matching in periodicity detection. In this paper, we attempt to solve this problem by proposing an approach for repeat pattern segmentation of printed fabrics using adaptive template matching. In contrast to traditional template matching that requires a static template image, the proposed method automatically determines the template image for each original patterned fabric image based on the size of the original image and its edge density. Then the sum of absolute differences (SAD) is used as the feature to match the original image with the template image to identify the similar parts in the original image. Once the similar parts in the original image are identified, the periodic texture primitive can be presented as a parallelogram frame based on the displacements of the adjacent similar regions. In addition, to our knowledge, almost all the research is aimed at the periodicity detection of regular textures and much less attention is paid to repeat pattern segmentation. However, for a patterned fabric with periodic units, there are thousands of ways to segment its primitives pattern unit. But from the perspective of human perception, a primitive pattern unit that do not break the integrity and the continuity of the original pattern presents inner information more evidently and clearly than that provided by an arbitrary periodic primitive, and it will also perform better in many fields such as defect detection and pattern retrieval. Then we also propose to traverse the original image with the determined parallelogram frame to identity a pattern primitive that fits well with human perception with minimum information loss.
The remainder of the paper is organized as follows: in the section 2, the proposed method is presented. In section 3, the experimental result using a database of real fabrics is shown to demonstrate the effectiveness of our method. Finally, the fourth section presents a summary of this work and our concluding remarks.
Pattern segmentation
The proposed approach consists of four major phases: (1) adaptive template image selection, (2) template matching, (3) periodicity detection, and (4) pattern primitive segmentation.
Adaptive dynamic template image selection
For a given template image, it is easily to find the similar regions in the patterned fabric with template matching. 26 However, there are no such static template image because different images need different template images. In order to solve this problem, an adaptive template matching method is proposed to determine a dynamic template image (DTI) which is changed with the original image. It’s clear that the larger the template size, the more abundant the feature information it includes. But because there are usually multiple pattern primitives in a specific target printed fabric, so that the template size should be much smaller than the original image. Meanwhile, the template size could also not set to be too small for it cannot meet the requirements on the number of features in the template matching process. The size of the DTI is determined according to the size of original image by referring to equations (1) and (2). To reduce the requirement on the computing resource while ensuring a certain accuracy of the solution, the minimum size of the DTI is set to be 20 empirically.


where w and h are the width and height of the DTI; m and n are the width and height of the original input image.
As shown in Figure 1(a), a large portion of most printed fabrics is their background color, and if a region comprised only of background color is selected as the DTI, other similar elements of repeat patterns will not be identified. Thus, a method using edge density is proposed to ensure that the adaptive template image includes multiple elements of the pattern primitive. Figure 1(b) is the edge image of Figure 1(a) extracted by Canny algorithm. It can be found out that the pattern region usually includes abundant edge information while the region of background color rarely includes any edge information. Define edge density as the ratio of the number of edge points in a fixed size image window to the total pixels of that window, it’s obvious that a window with higher edge density is more likely to locate at pattern region, so that the window with the largest edge density can be selected as the DTI. Let ρ(u, v) be edge density of a w*h window I whose center is located at (u, v), np be the number of edge points in I, Np be the total pixel points in I, then ρ(u, v) can be expressed as:

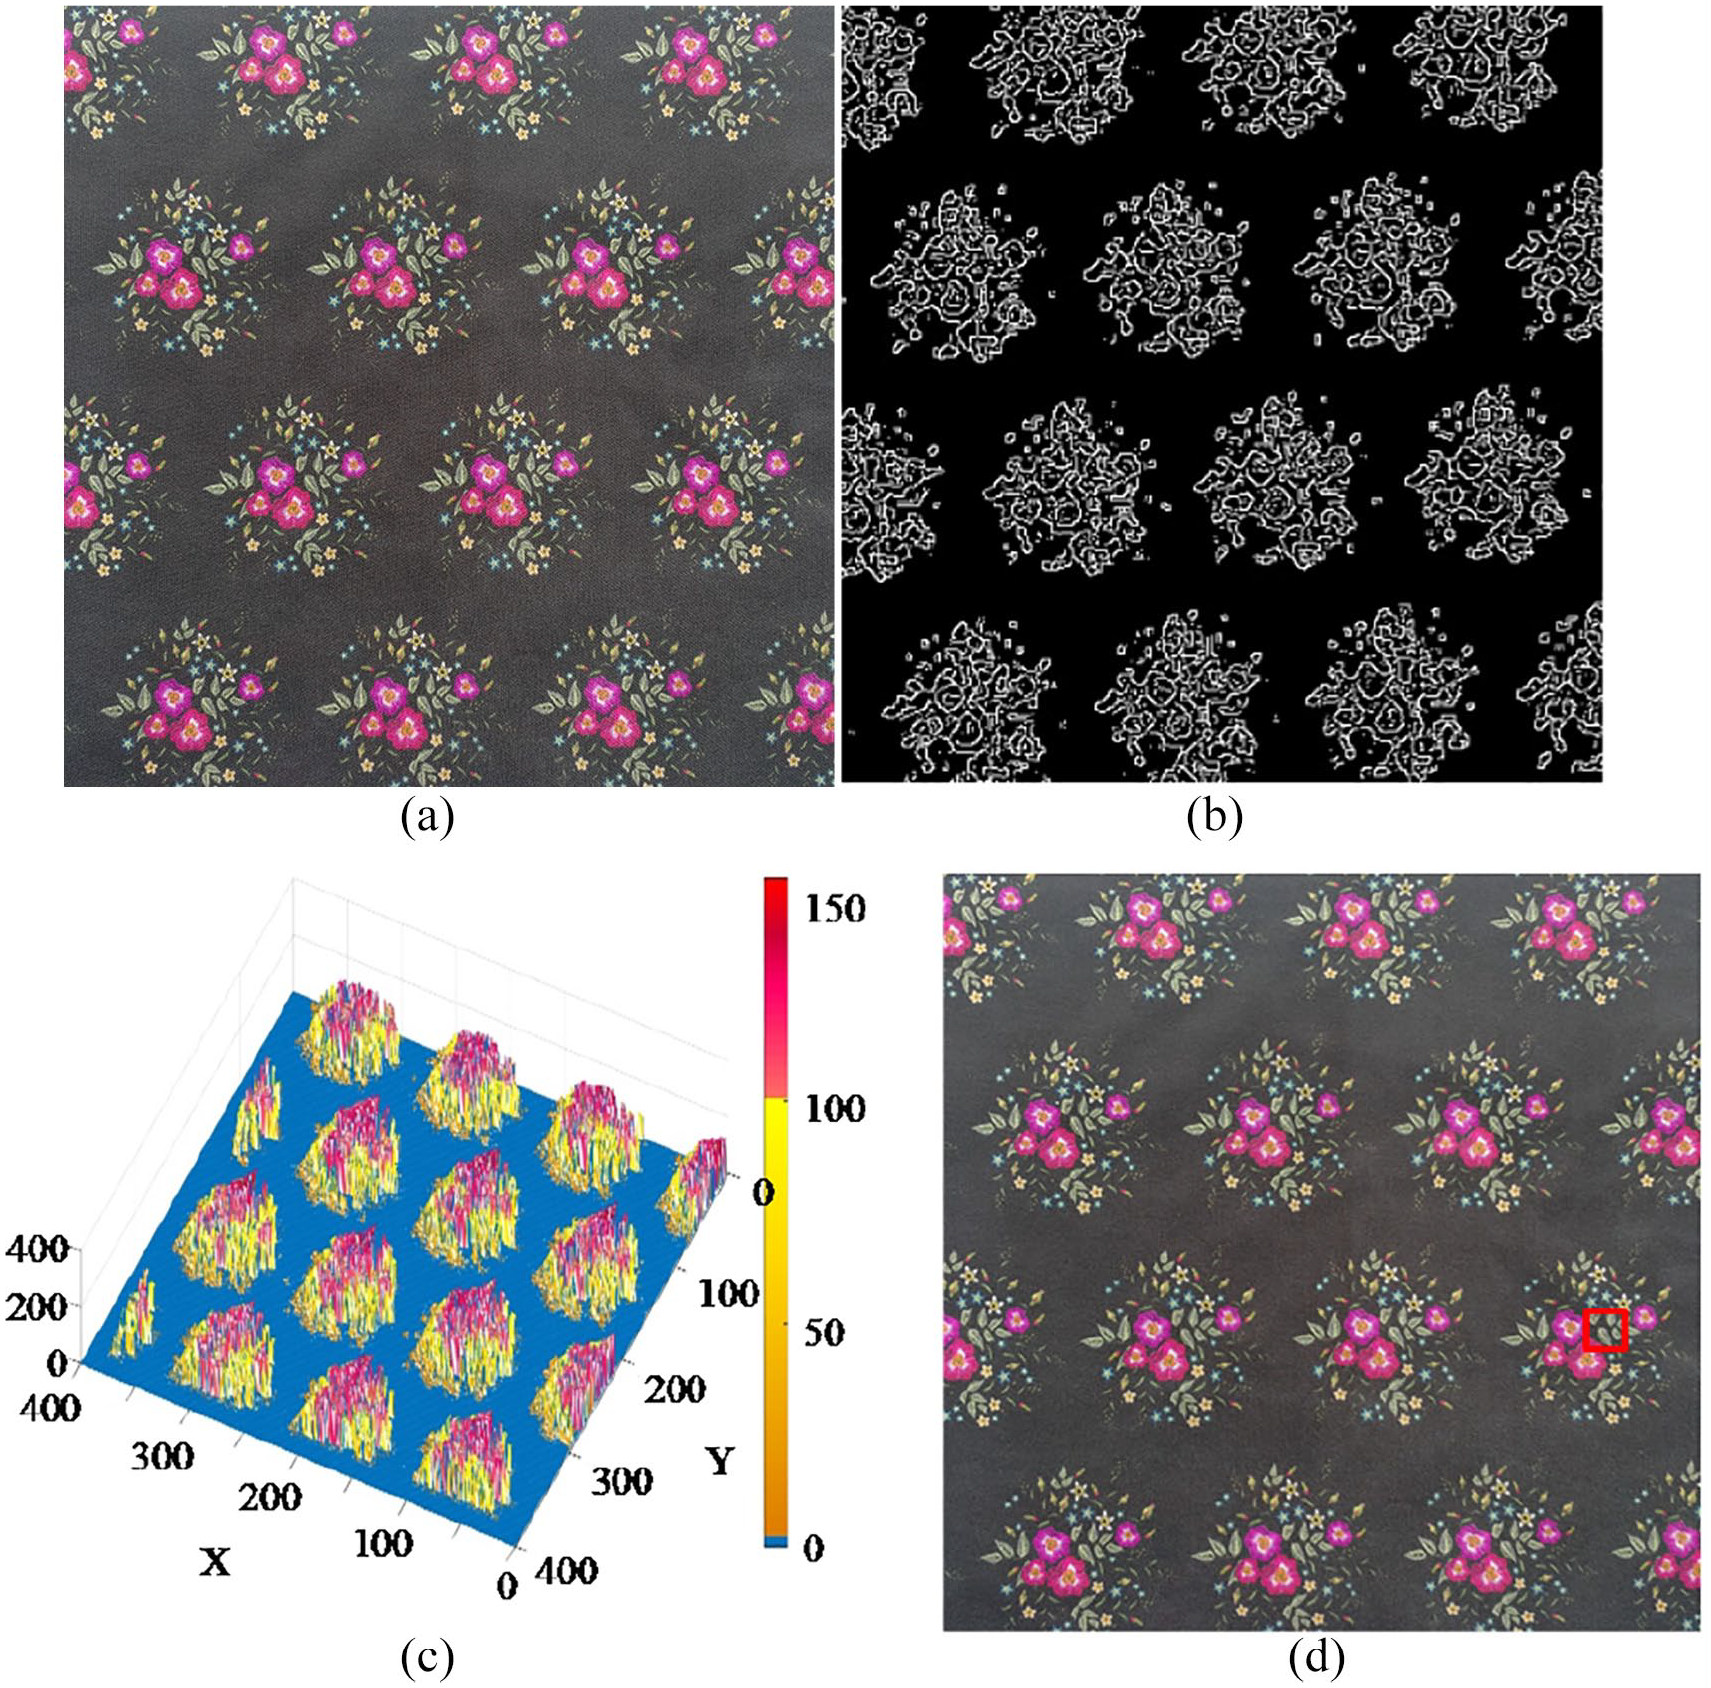
Selection process of template image: (a) original input image with repeated patterns, (b) edge detection image of (a), (c) edge density distribution of (b), and (d) result of the selected template image (in red box).
Normally, we should traverse the original input image with window I to determine which one it’s with the largest edge density, it is accurate but time consuming. In order to reduce computation load, only the window, center of which, included in the edge points set are checked while the others are skipped. Figure 1(c) shows the edge density distribution of Figure 1(a). The x-axis and y-axis of Figure 1(c) represent the col and row of Figure 1(a), while the z-axis represents edge density values that are normalized to 0 to 250. The edge densities of those skipped windows are set 0. The red window shown in Figure 1(d) is that with the largest edge density and it is selected as the DTI T.
Template matching
Once the template image is determined, template matching method could be selected to find the matched regions in the original image. Conventional template matching methods need to traverse the whole original image, which is not efficient. For the center of the DTI T locates at a specific edge point, the matched windows must locate at some other edge points too. Besides, since the determined DTI T is the window who has the maximum edge density value, the edge density value of the matched windows should be close to the maximum edge density. So that we can reduce the computation time by limiting the traversing region. For this purpose, we stored the edge density value and the center coordinate value of any effective window in the DTI retrieval process, but only the windows meets equation (4) are selected for template matching calculation while the others are skipped:

where ted is the threshold for determining template set and usually range from 0.7 to 1 according to experience; the maxEdgeDensity denotes the edge density of T.
Considering a gray image which usually adopted for periodicity detection and template matching lost most color image information, the proposed methods have less adaptivity to the colorful printed fabrics. As Hue-Saturation-Value (HSV) color space can reflect human’s visual feeling of color well and the hue component, H, contains the most color information, we use the H component of the input original image for template matching calculation. In detail, H is quantified with parameter q as shown in equation (5):

where H(i,j) is the H value of the pixel located at (i, j); q is the quantization parameter.
The most popular similarity measures is the sum of absolute differences (SAD), 27 which has been proved to be accurate and robust. Let a potential matching window whose center point locates at (i, j) be W(i, j), and the SAD value between T and W(i, j) be d(T, W(i, j)). Then the SAD value can be calculated by equation (6) and be used to find the matched windows:
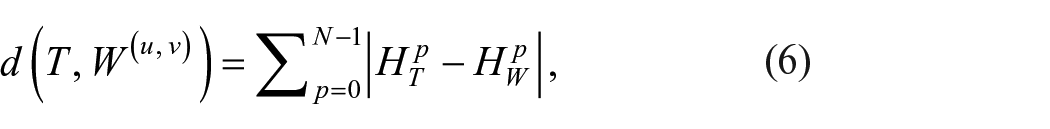
where Hp T and Hp W are H values of T and W(i, j) of the p-th pixel’s, N is the total pixel number of T or W(u, v).
Obviously, smaller d(T, W(u, v)) represents higher similarity between W(u, v) and T, and vice versa. To make it easy to determine the matched windows after SAD value is calculated, a threshold, tSAD, is set for skipping the window with lower confidence to be a matched window. When d(TD, W(i, j)) satisfies equation (7), W(i, j) has a low probability to be the matched window and it can be skipped. The local minimum value of d(T, W(i, j)) of the remaining windows can be selected as the matched windows.

The SAD value calculation result of the original image Figure 1(a) is displayed in Figure 2(a). The x-axis and y-axis represent the col and row of Figure 1(a), respectively. The z-axis represents the reciprocal of SAD value which is normalized to 0 to 250; the value of the skipped windows by according to equation (7) is set 0, so that the higher peak in the picture represents the region with smaller SAD value. It can be found from Figure 2(a) that the regions with the local minimum SAD values could be selected as a matched window which shown as the blue rectangles in Figure 2(b).
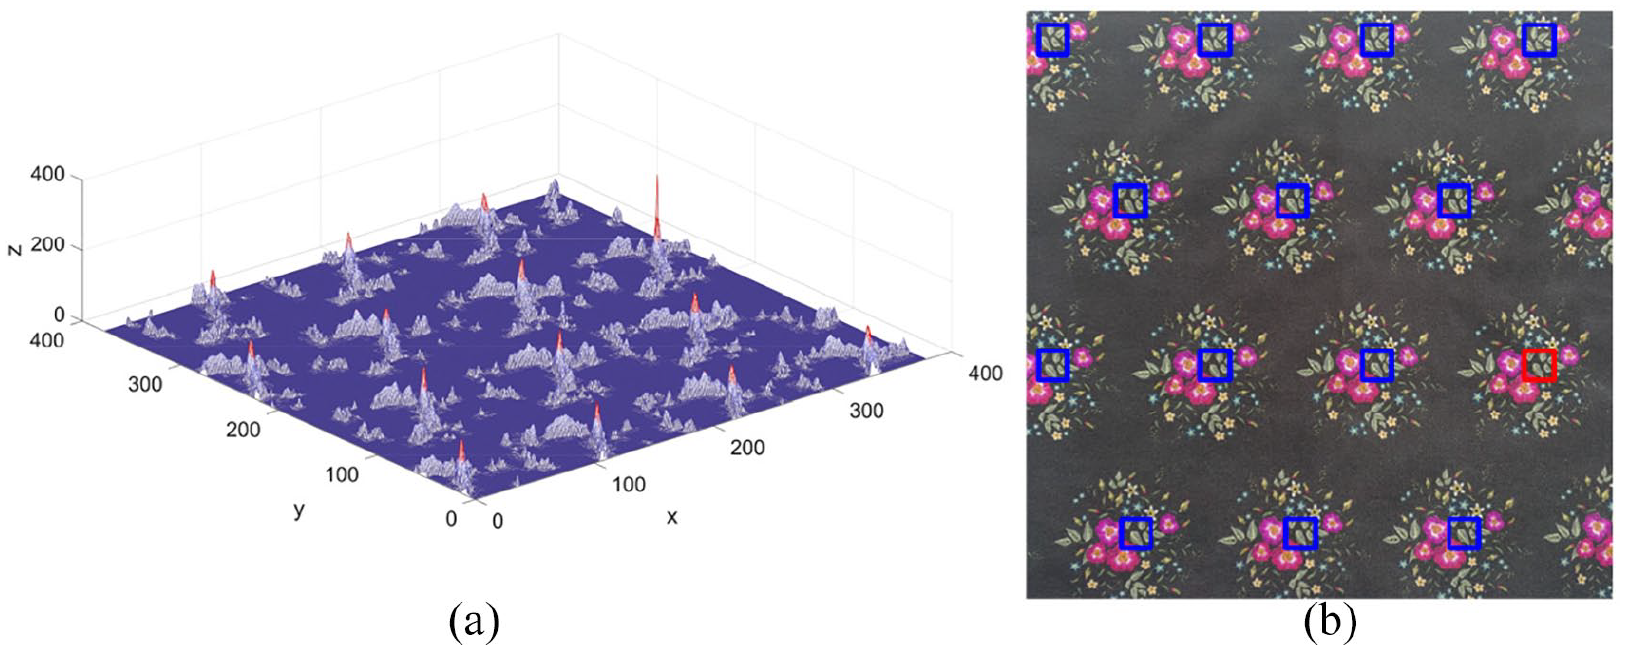
The process of template matching: (a) the SAD value distribution of Figure 1(a) and (b) result of template matching.
Pattern primitive size detection
To our knowledge, there are two basic shapes for describing the pattern primitive size, namely, rectangle 12 and parallelogram. 19 Completely considering the pattern distribution regularity and taking assistance of the experiment results, we choose a parallelogram to represent the size of the pattern primitive. The displacements between adjacent matched windows determine the period of the repeat patterns and size of the pattern primitive. Because two displacements can determine a parallelogram, we can structure a periodic pattern primitive until we can obtain a pair of non-collinear displacements. However, there may exist several parallelograms that could be regarded as the periodic primitive. In this study, we try to identify the minimum size primitive as the pattern primitive.
As shown in Figure 3(a), we first set the center point of template image as the reference point O, which is marked as red point. Then we check the center points of adjacent matched regions to find a pair of nearest points O1 and O2, which are marked as blue points in Figure 3(a). To determine the smallest parallelogram using displacement vectors OO1 and OO2, their sum must be the smallest and OO1 is required to be nonlinear with OO2. As is shown in Figure 3(a), the parallelogram determined by OO1 and OO2 can be regarded as the minimum size of the periodic pattern primitive.

Process of pattern primitive segmentation: (a) determination of primitive size and (b) pattern segmentation.
Pattern primitive segmentation based on minimum information loss
As the size of the pattern primitive of a pattern fabric is determined, we can traverse the entire image with the parallelogram to determine a complete pattern primitive which fits well with human perception. Generally, the complete pattern primitive must be a primitive with complete edges those include some certain information of the pattern. In the process of traversing, the continuity of the edge may be destroyed by the sides of the parallelogram. Once sides of parallelogram go through the edge, some pattern information is lost. Obviously, the more the number of edge points are cut, the more pattern information is lost. In addition, as there are more edge points around the edge point with a high edge density, it is expected be more possible to go through other edge points when the edge point with the high edge density is cut. Thus, the lost information caused by the parallelogram sides is related to the edge density of the point. Assume they have a proportional related, by letting L0 be the constant basic unit of the lost information, and L(u, v) is the lost information when the edge point of the original image located at (u, v) is destroyed, we can use equation (8) to calculate the lost information at the edge point:

Then, for a specific traversing step, assuming there are M edge points destroyed by the sides of the parallelogram widow, by summing all the lost information of these M points, we can obtain the total lost information, Ls, with equation (9).

It’s clear that the less the lost pattern information caused by the parallelogram, the higher the ratio of the window contains a complete pattern primitive. Therefore, in this study, the pattern segmented by parallelogram with a minimum Ls is regarded as the best pattern primitive. The result of the pattern primitive segmentation for the original image of Figure 1(a) using lost information is displayed in Figure 3(b).
Experiments and discussion
In this section, the effectiveness of the proposed method for period size estimation and repeat pattern primitive segmentation is demonstrated via a series of experiments. Then comparisons of the experiments with state-of-the-art approaches are performed to verify the superiority of the proposed method. This method described the size of a pattern primitive as (V1*V2, D), where V1 and V2 were the lengths of a pair of non-collinear displacements, which are used to structure the parallelogram, with D as the angle between V1 and V2. All experiments were executed on a PC with an Intel Core i5 CPU and a Windows 7 OS. The program was written in Visual Studio 2013 using C++. Figure 4 shows the system we adopted for fabric image acquisition. An industrial camera with the model of acA 2500-20gc of Basler is selected, the output of the camera is color image with a resolution of 2560 × 2048. For this research, we first resize the acquired image proportionally and then crop it into 400 × 400 pixels or the required dimensions according to the needs of the comparison experiments. A white positive light source consists of four bar-shaped light sources is selected for illumination, and it is collinear with the central axis of the camera. In addition, the camera works under automatic exposure mode. After the system is adjusted, color sample images of the fabric can be obtained.

Schematic of image acquisition system.
Parallel pattern segmentation
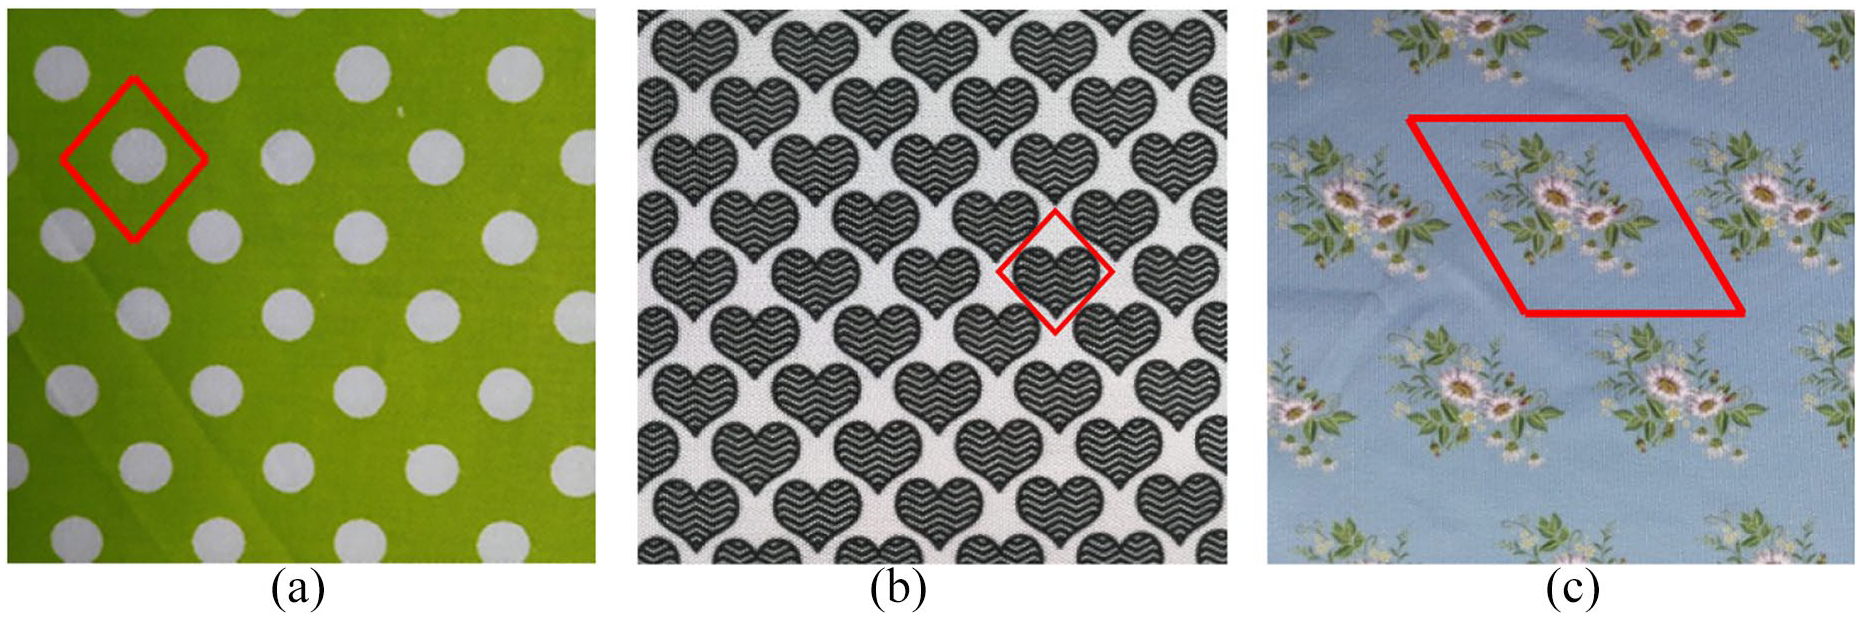
A parallel pattern is the pattern primitive arranged along the horizontal and vertical directions and it is the most common arrangement of printed fabric. Figure 5 shows the segmentation results for three kinds of parallel pattern with different primitive sizes, all the original input images size are 400 × 400 pixels. The detected primitives are marked with red boxes and their respective sizes are also explicitly listed. It can be found that the all the detected pattern primitives do not break the integrity and the continuity of the original pattern and present the pattern information clearly, which is easily perceived by human vision.
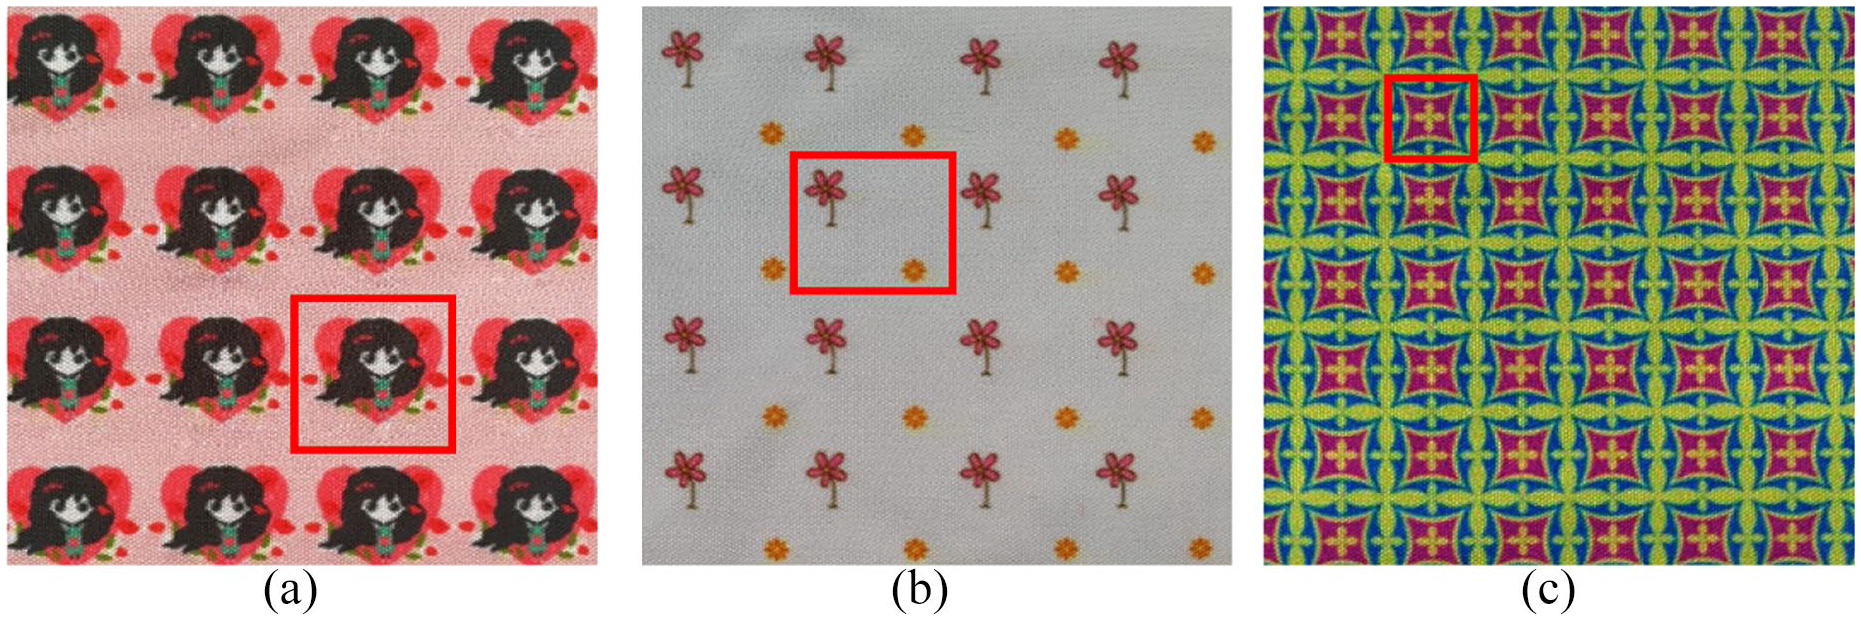
Segmentation results of printed fabrics with parallel pattern primitives: (a) the primitive size is (100 × 100, 90), (b) the primitive size is (110 × 100, 90), and (c) the primitive size is (60 × 60, 90).
Tilted pattern segmentation
The tilted pattern is another common arrangement of printed fabric in which the pattern primitive is arranged as a parallelogram. Figure 6 shows the segmentation results for three kinds of tilted pattern with different primitive sizes, all the original input images size are also 400 × 400 pixels. The detected primitives are marked with red boxes and their respective sizes are also explicitly listed. Like that for the parallel patterns, we can conclude from the experiment results that the detected pattern primitive size obtained using the proposed method is accurate and the pattern primitive segmented by the method is reasonable.
Segmentation results of printed fabrics with tilted pattern primitives: (a) the primitive size is (60 × 60, 81), (b) the primitive size is (90 × 120, 65), and (c) the primitive size is (160 × 150, 61).
Rotation invariance
Obviously, during the fabric images acquisition process, it’s inevitable that the pattern of the printed fabric would skew to some extent. Therefore, it is necessary for the pattern segmentation algorithm to be compatible with rotation invariance. Figure 7 shows the segmentation results for two kinds of tilted pattern with different rotation angles, all the original input images size are 400 × 400 pixels. In detail, Figure 7(a) to (c) show a printed fabric with three different rotation angles, 0°, 10°, and 30°, while Figure 7(d) to (f) illustrate a printed fabric with three different rotation angles, 0°, 20°, and 40°. The detected primitives are marked with red boxes and their respective sizes are also explicitly listed. It clearly shows in Figure 7 that the sizes of pattern primitive detected by the proposed method were almost identical, irrespective of the rotation angle or specific pattern. Furthermore, the pattern primitives determined by the proposed method also fit well with human visual perception, and prove that the proposed algorithm has a good rotation invariance.
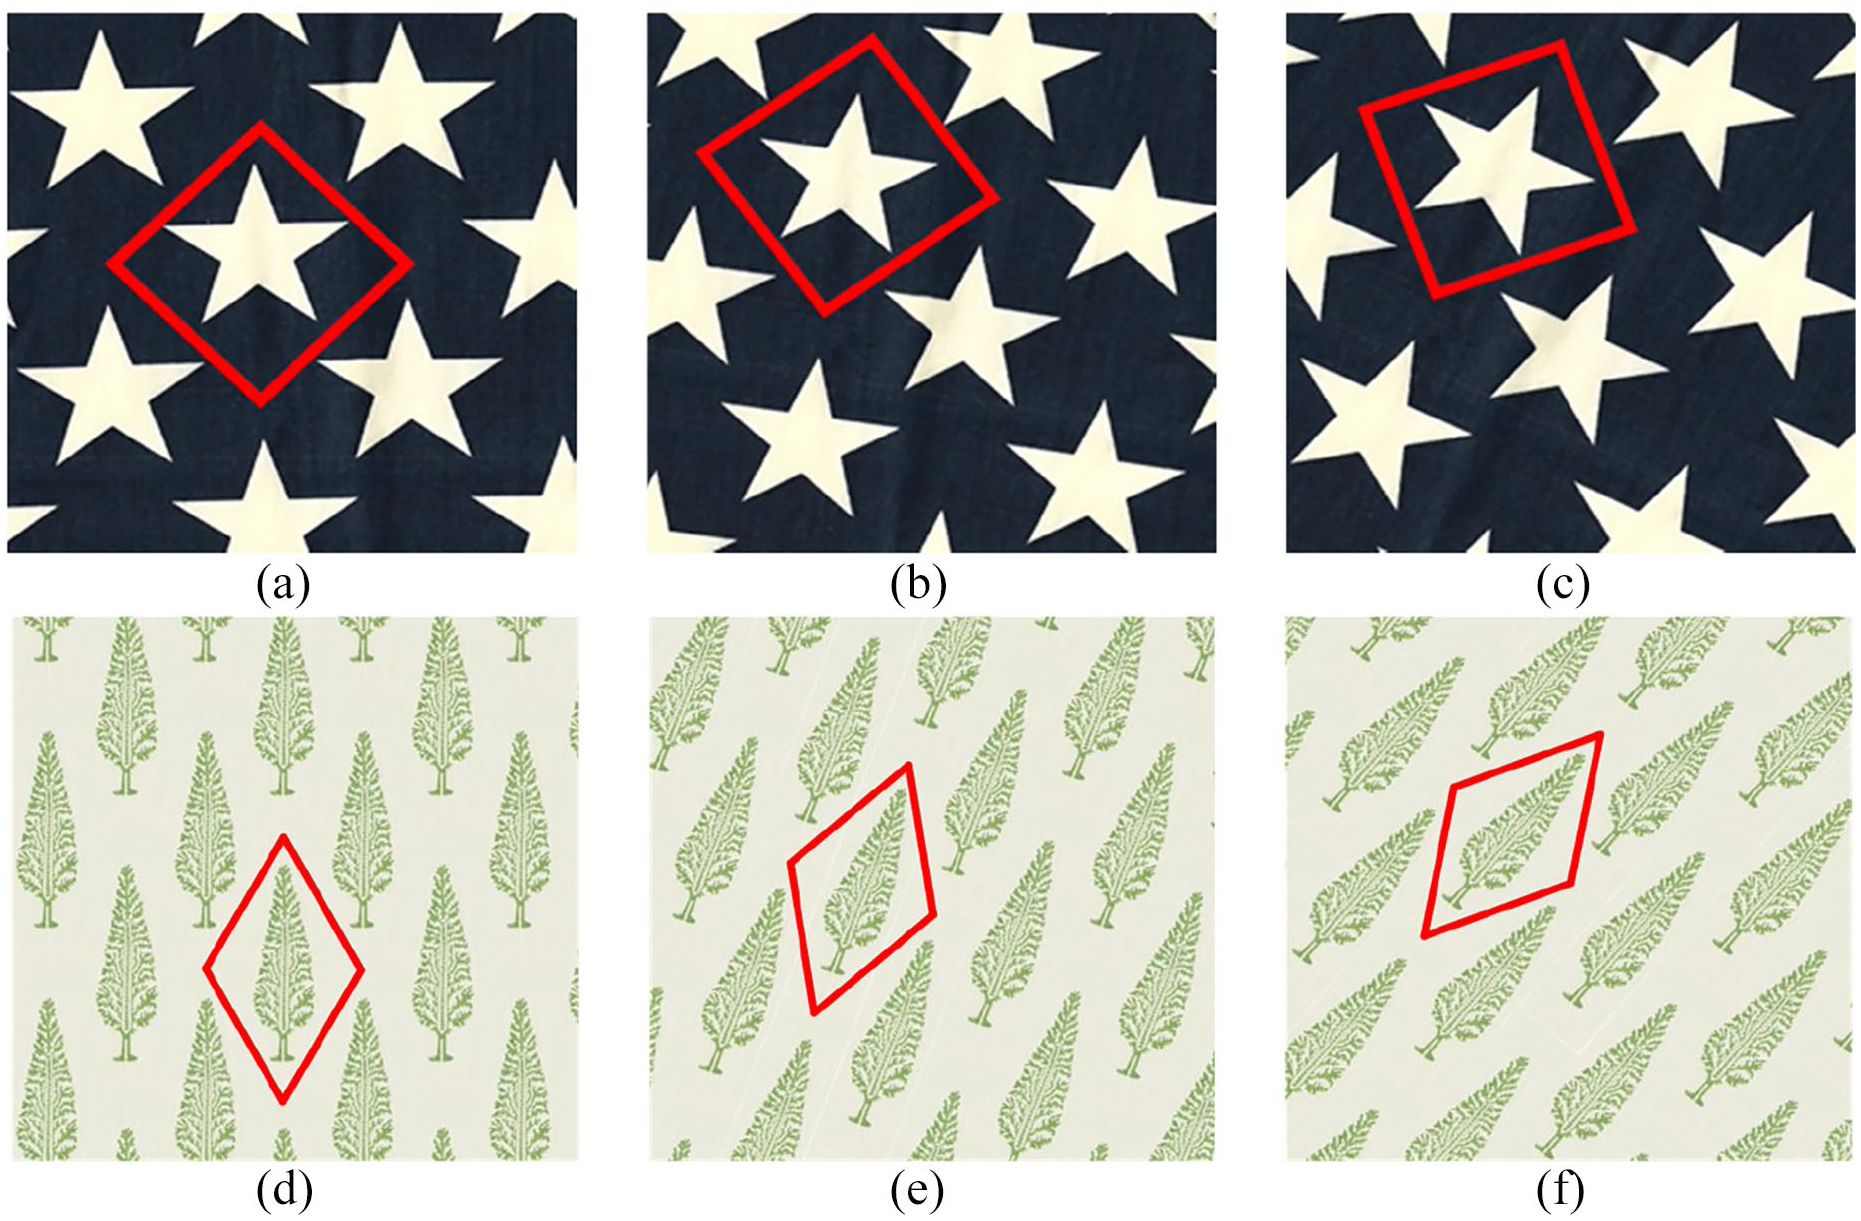
Segmentation results of printed fabrics with different rotation angle: (a) the primitive size is (150 × 150, 92), (b) the primitive size is (150 × 150, 91), (c) the primitive size is (150 × 150, 92), (d) the primitive size is (114 × 114, 60), (e) the primitive size is (113 × 112, 59), and (f) the primitive size is (113 × 114, 61).
Scaling invariance
Images with a high resolution will increase the load of image analysis, therefore, to reduce the processing time and storage space, some images usually need to be compressed. However, with image compression, the details of the image will be changed, and some image information would be lost. Figure 8 shows the segmentation results for two kinds of printed fabrics with different scale ratios. In detail, Figure 8(a) to (c) show a printed fabric with three different resolutions, namely, 200 × 200 pixels, 400 × 400 pixels, and 500 × 500 pixels, respectively. It can be obtained from the determine results that the ratios between the length of the detected primitives of these samples are approximate 1:2.12:2.43, which are close to the ratio of the original input images of 1:2:2.5, respectively. Figure 8(d) to (f) show the images with a same size of 400 × 400 pixels while the ratio of the area of pattern primitive to the image is different. It’s obvious that the proposed method also works well under this situation. Furthermore, the angle of the determined pattern primitives for both samples agree with each other very well, which prove that the proposed algorithm has a good scaling invariance.

Segmentation results of printed fabrics with different scale ratio: (a) the primitive size is (70 × 70, 90), (b) the primitive size is (150 × 147, 90), (c) the primitive size is (170 × 170, 90), (d) the primitive size is (130 × 130, 107), (e) the primitive size is (91 × 91, 107), and (f) the primitive size is (69 × 69, 107).
Influence of foreground or background color
To meet the needs of different consumers, pattern primitive with different colors are often printed on different background color for production of fabrics with different styles. To research the influences of the background colors or foreground colors on the robustness of the proposed method, three kinds of such fabrics as shown in Figure 9 are studied. All the original input images size is 400 × 400 pixels, and the fabrics in Figure 9(a) and (b) have the same background color but with different foreground colors, while Figure 9(a) and (c) have opposite background colors and foreground colors. The detected primitives are marked with red boxes and their respective sizes are also explicitly listed. It’s clear that the sizes of the detected pattern primitives are almost identical, which proves that the algorithm is insensitive to the change in the background color or foreground color.

Segmentation results of printed fabrics with different background or foreground colors: (a) the primitive size is (56 × 55, 76), (b) the primitive size is (57 × 55, 75), and (c) the primitive size is (53 × 55, 77).
Comparison experiments
The HSDH method based on SDH proposed by Li et al. 12 is one of the latest studies aimed at analyzing the periodicity of a color patterned fabric. We choose it to perform a comparison experiment to demonstrate the advantage of the proposed method. Figure 10 presents the comparison results of four different fabric images examined using the HSDH and the proposed method, and for each fabric, the left one is determined with our method. By comparison, we can find that our method is as accurate as the HSDH. In addition, the pattern primitive detected by the proposed method is more reasonable than that by the HSDH. When encountering tilted pattern, though the pattern primitive determined by the HSDH method can be regarded as the periodicity size of the repeat pattern, the sides of the primitive break the integrity and the continuity of the original pattern, so that the inner information of the primitive is not that intuitive and clear when compares with our method.
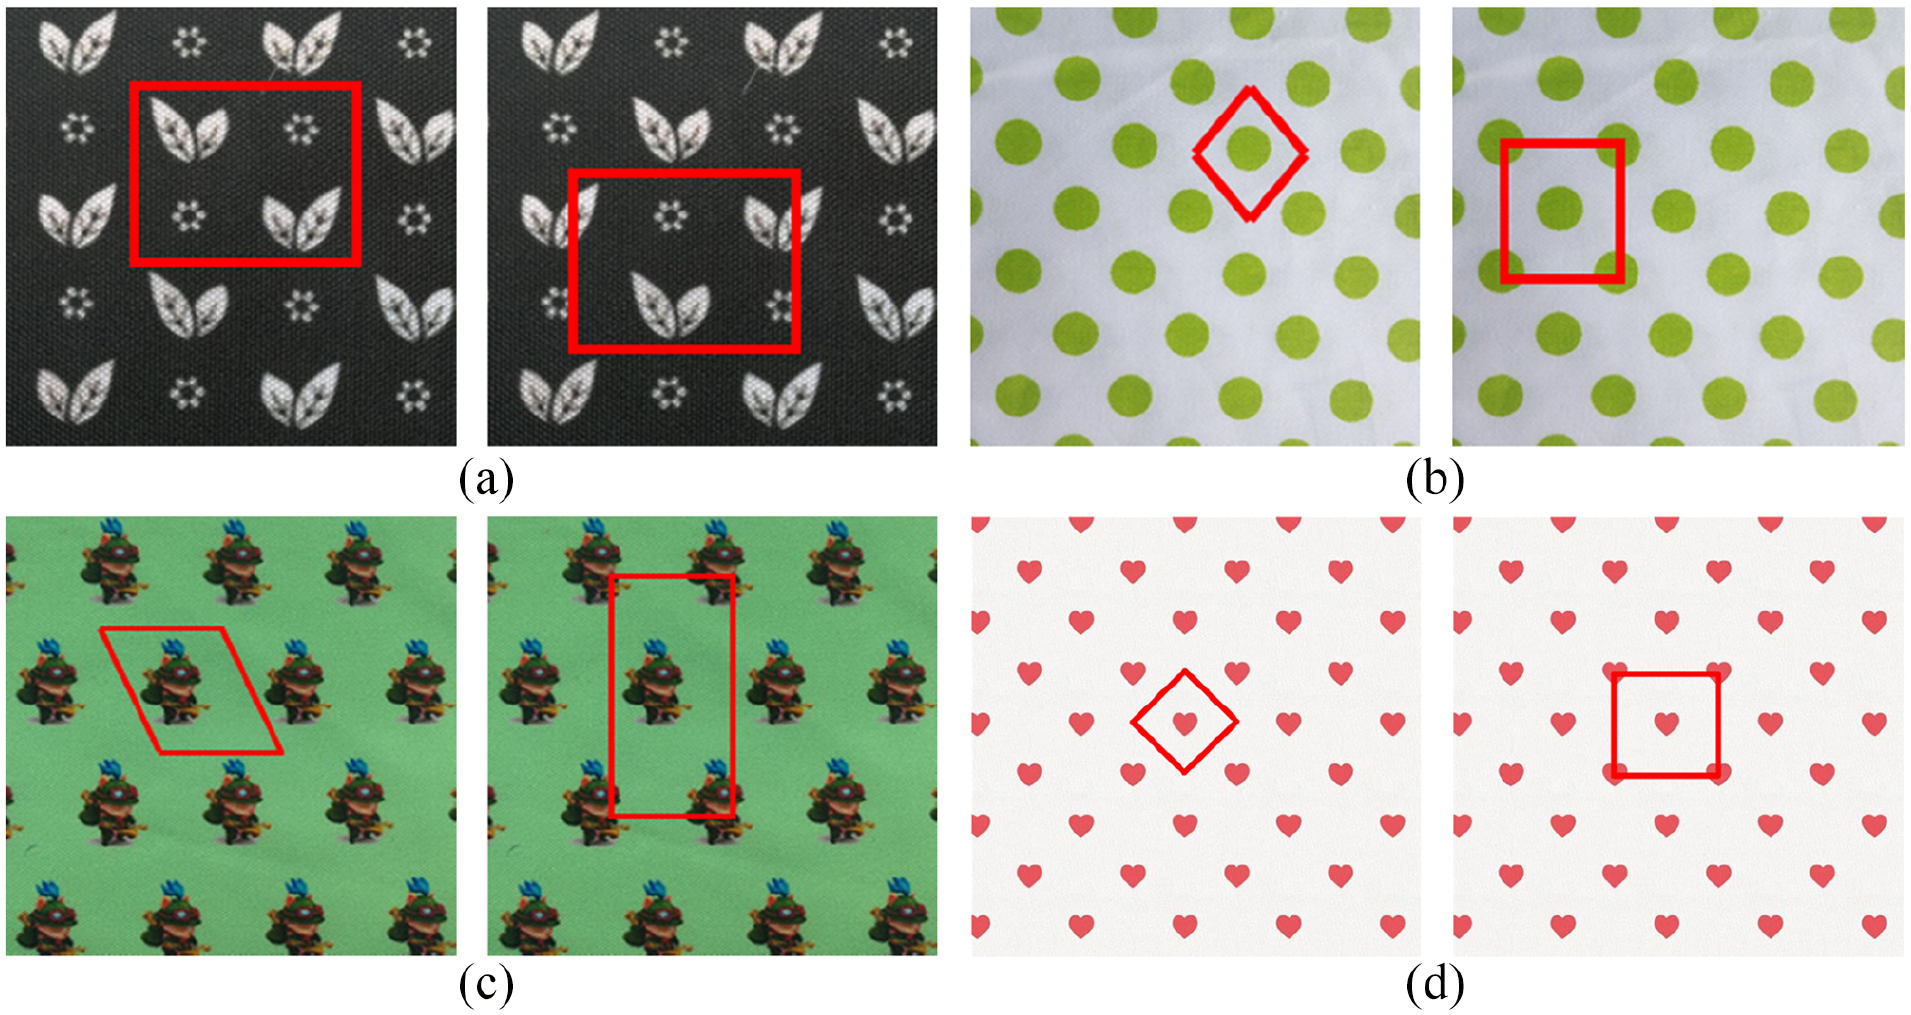
Comparison of segmented primitives with our method and HSDH (the left one is determined with our method): (a) determined primitive size: (200 × 160, 90) versus (200 × 160, 90), (b) determined primitive size: (56 × 55, 76) versus (220 × 110, 90), (c) determined primitive size: (93 × 110, 66) versus (220 × 110, 90), and (d) determined primitive size: (66 × 65, 90) versus (92 × 92, 90).
Conclusion
In this paper, adaptive template matching is used for periodic pattern size estimation and repeat pattern primitive segmentation. Unlike traditional template matching algorithms, the proposed adaptive template matching algorithm selects a part of the original image as the template image by analyzing the characteristics of the patterned fabric using the maximum edge density principle. Then the matching regions that are similar with the template image are identified and the two shortest displacements between the adjacent matching regions are used to determine the size of the pattern primitive. Compared with other periodic pattern analysis algorithms, the most valuable contribution of the proposed method is that in addition to detecting pattern primitive size, it segments a complete pattern that fits human perception well by applying the principle of minimum information loss. The experiments verify that the proposed method accurately estimates the size of the pattern primitive and segments a complete pattern primitive. In addition, it performs reliably, irrespective of whether the detected patterned fabric is a parallel or tilted pattern. Furthermore, the proposed algorithm has the advantage of rotation invariance, scaling invariance and will not be affected when background or foreground color is changed.
Footnotes
Acknowledgements
The authors thank the editor and anonymous reviewers for their helpful comments and valuable suggestions.
Declaration of conflicting interests
The author(s) declared no potential conflicts of interest with respect to the research, authorship, and/or publication of this article.
Funding
The author(s) disclosed receipt of the following financial support for the research, authorship, and/or publication of this article: This work was supported by the National Natural Science Foundation of China (grant number U1609205), (grant number 51605443), Key Research and Development Project of Zhejiang Province (grant number 2018C01027), as well as Natural Science Foundation of Zhejiang (LQ19F030014).