
Abstract
In order to better judge the fabric style of knitted suit fabrics and improve the production quality of knitted suit fabrics, we use principal component analysis and cluster analysis methods to process fabric samples and evaluation indicators, and use neural network technology to establish The fuzzy neural network model outputs comprehensive evaluation values to judge knitted suit fabrics. The results show that the predicted value of the model output is above 0.6. The style of knitted suit fabric is close to that of traditional woven suit fabric, the flexural stiffness is between 5 and 20 μN• m, the extensibility is between 10% and 20% and the shear stiffness is between 50 N/m. The value of wool and polyester fabric is basically above 0.7, and the style is similar to the woven suit fabric, followed by knitted suit fabrics of cotton and polyester.
Introduction
Suit fabric is a type of fabric used for business apparel, and its fabric style directly affects the quality of clothing. Fabric evaluation is divided into subjective evaluation and objective evaluation. The subjective evaluation is with the aid of authoritative expert’s sense, and the objective evaluation uses related statistical methods to judge fabric style. 1 When the multi-performance of fabric is evaluated comprehensively or the quantity of fabric is too large, the traditional evaluation methods are time-consuming and inefficient. Neural network technology is based on the physiological research results of the brain through the simulation of some brain mechanisms and mechanisms to achieve a function. Using neural network can predict yarn properties2,3 various clothing and human body sizes4,5 and so on. The neural network model saves the analysis flow, and can help the analyze according to the database. It is a significant method to obtain the necessary parameters for the market trend.
With the improvement of knitting technology and the development of people’s requirements for wearing comfort, the knitted suit fabric has gradually developed, and with its good quality has been recognized by all major textile manufacturers, as well as domestic and foreign brands to develop high-end knitted business apparel. Kanat and Özdil 6 used fuzzy neural network for classification, identification, prediction of properties and optimization problems. Ismail Hossain et al. 7 predicted the color strength of viscose knitted fabrics by using fuzzy logic model based on dye concentration, salt concentration and alkali concentration as input variables. Shabaridharan and Das 8 developed an artificial neural network model to predict the thermal and evaporative resistance of multilayered fabrics and compared with the experimental values. Haque et al. 9 built a fuzzy prediction model based on hydrogen peroxide concentration. In order to build up a holistic picture of purchase preferences, Čubrić et al. 10 studied to conduct an in-depth analysis of customer preferences for single jersey knit fabrics regarding the attributes of smoothness and softness.
Based on the development of knitted business dress, the quality of knitted suit fabric has been paid more attention. Improving and evaluating the quality of knitted suit fabric is quite important in industry practice. The software of Matlab is used in this paper to establish the mold and neural network model to predict the fabric style of knitted suit fabric, and to summarize the quality characteristics of knitted suit fabric.
Experiment of fabric style
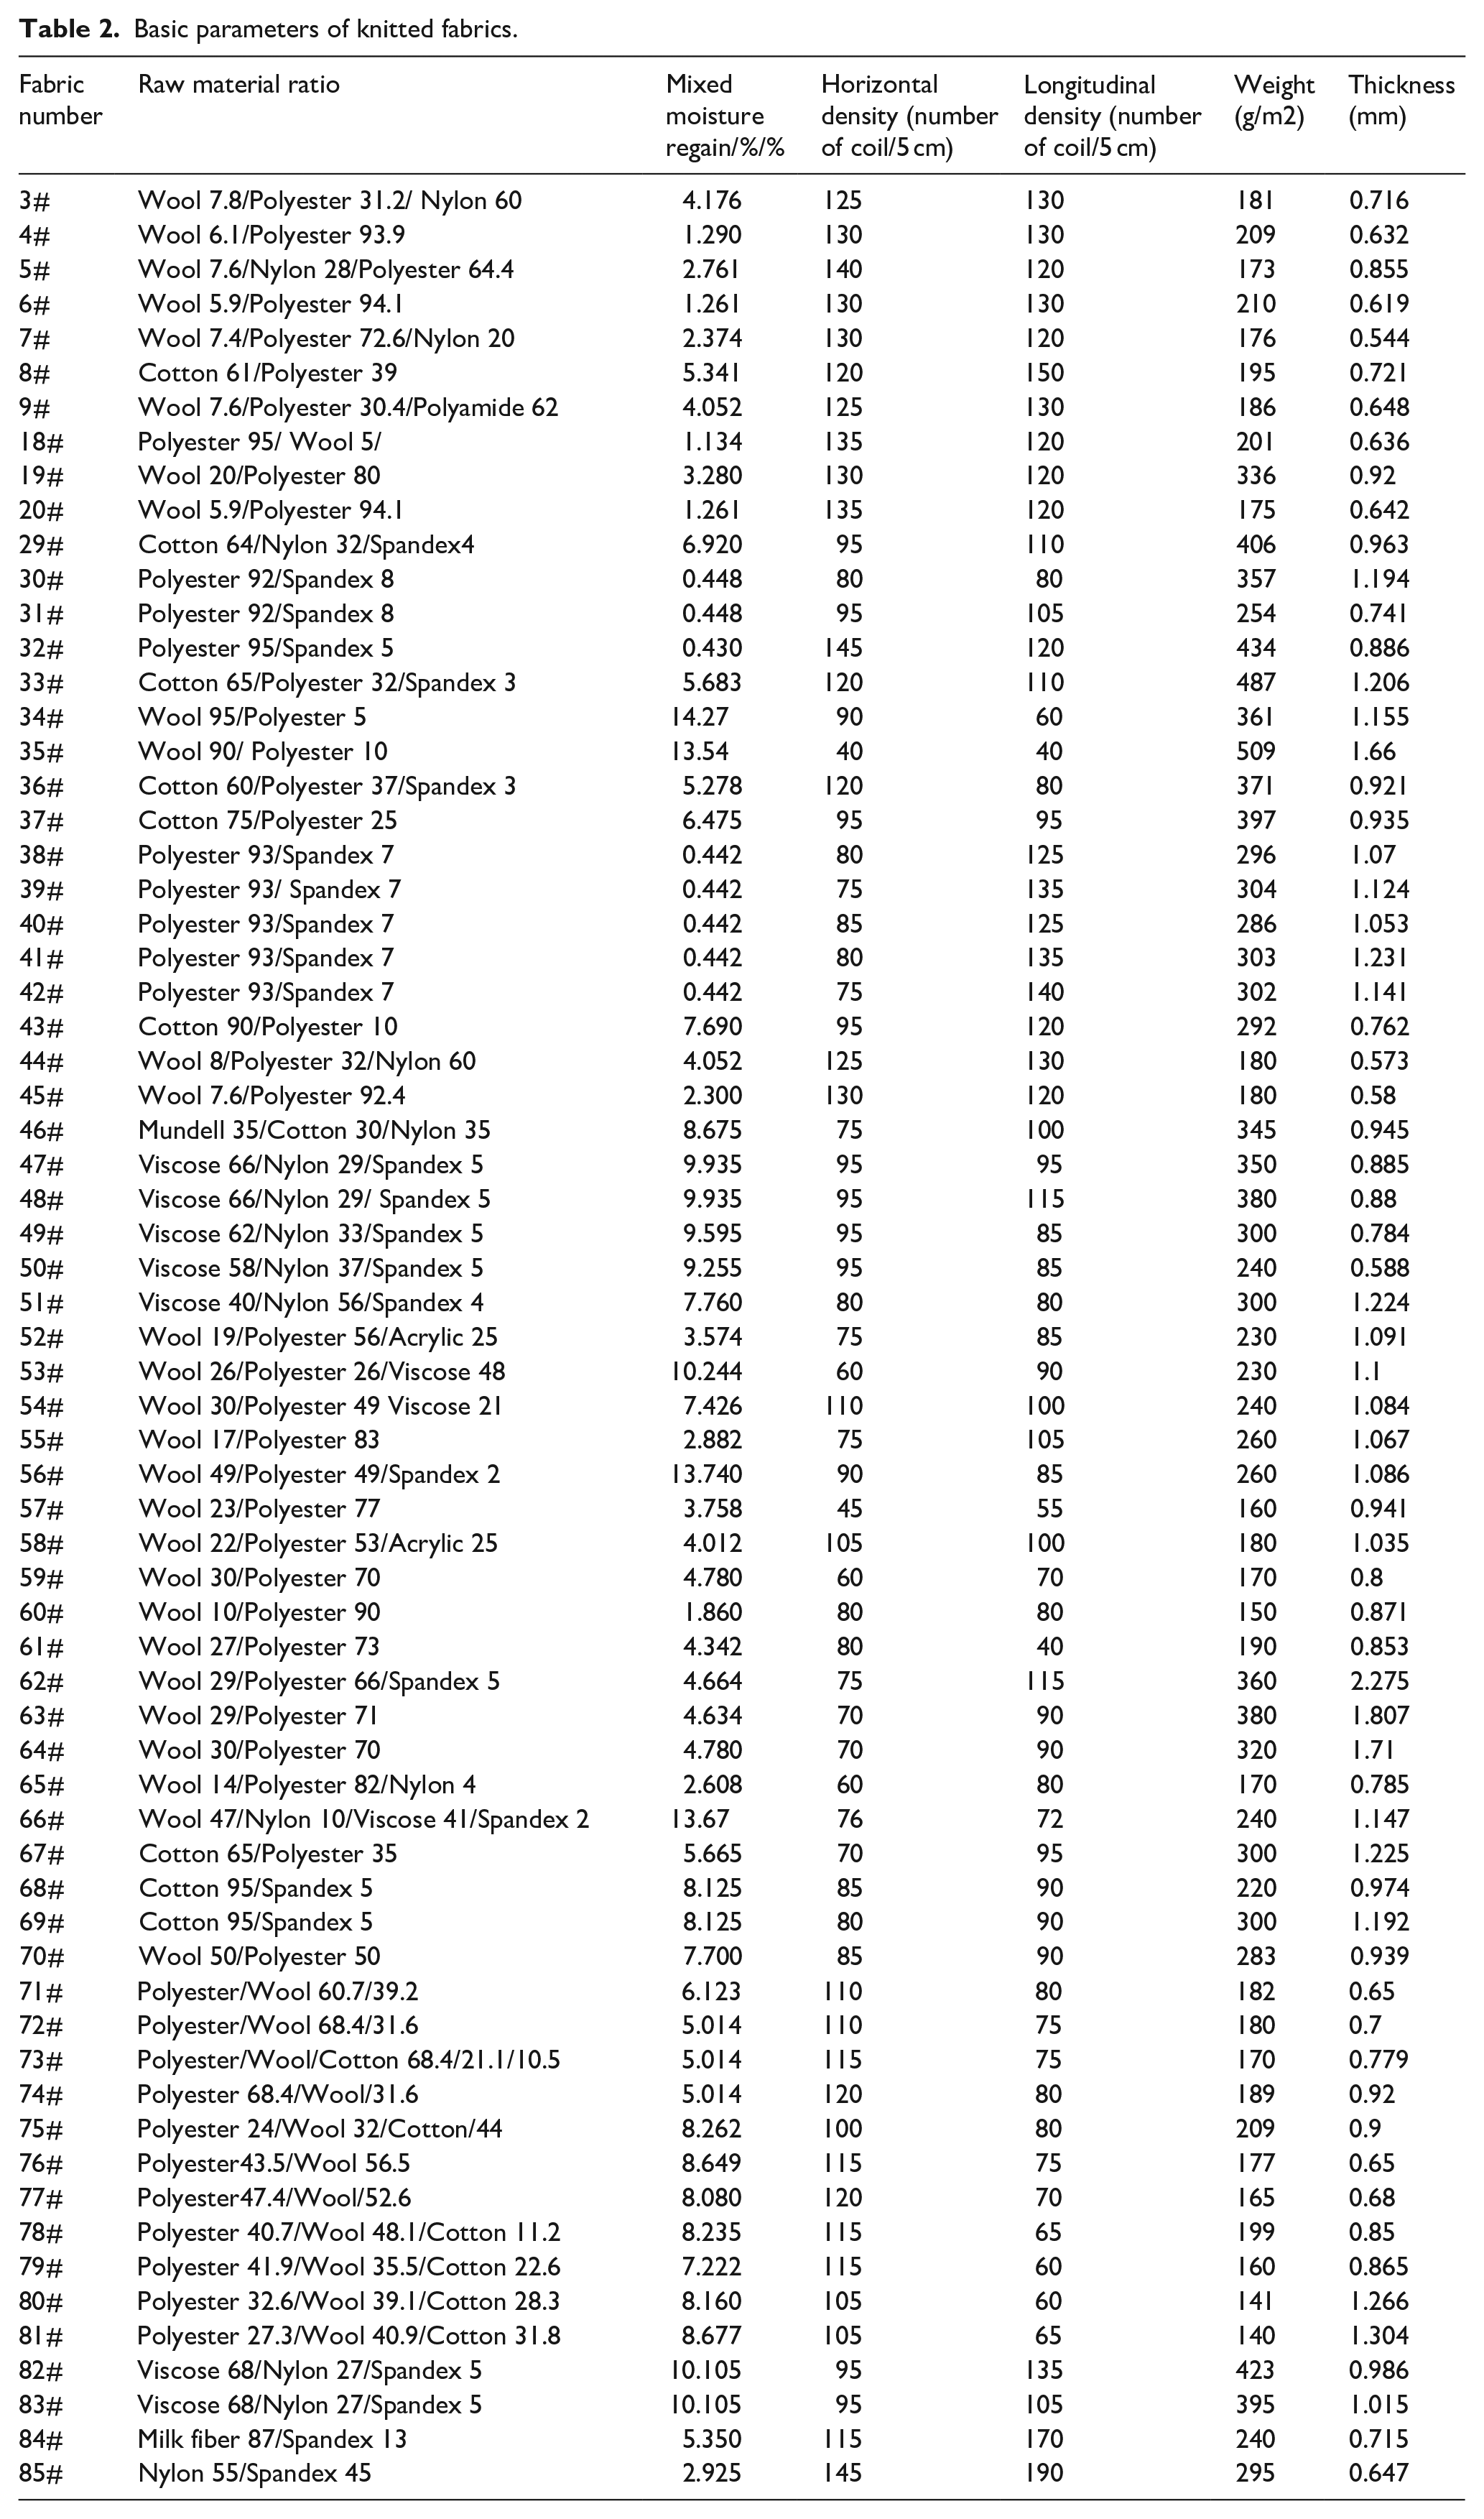
A total of 101 types of fabrics have been collected through textile companies, textile fabric markets and development, of which 18 are woven suit fabrics and 83 are knitted fabrics with an areal density of 180 g/m2 to 300 g/m2. Due to the lack of measurement standards for knitted suit fabrics, woven suit fabrics are used as a reference standard to judge the quality of the model output evaluation value. In the subsequent style testing process, some knitted fabrics were too soft, resulting in large errors in the test data. Some fabrics were removed. The basic parameters of the woven fabrics and knitted fabrics in the remaining samples are shown in Tables 1 and 2 respectively. As shown, the moisture regain of multi-component products is calculated based on the proportion of each component and the moisture regain.
Basic parameters of woven fabric.

Basic parameters of knitted fabrics.
Before the establishment of neural network model, the fabric samples are tested to obtain the data of style index, which is the data base for the model. The testing of fabric style includes KES style testing system,11,12 FAST fabric style testing system 13 home-made fabric style tester. 14 101 kinds of fabric samples were tested by FAST style tester, and 14 data were obtained:T2, T100, Cwarp, Cweft, Bwarp, Bweft, E5warp, E5weft, E20warp, E20weft, E5left, E5right, Gleft, Gright.
Compressibility
The FAST-1 compressibility testing instrument measures the thickness of the fabric by weight, as shown in Figure 1. The test area is 10 cm2 without weight added. The clockwise direction was rotated until it stopped. The Object Cup was raised, the anticlockwise direction was rotated until it stopped, and the Object Cup was lowered, under the lifting condition, a weight equal to 100 g F / CM2(9.81 KPA) was placed. The object cup was lowered by counterclockwise rotation. Since the compression test is not destructive, there is no need to cut the sample, but note that it is at least 5 cm away from the edge.

Fast-1 fabric thickness testing instrument.
Extensibility
Fast-2 Bending Tester provides a simple method for testing warp and weft direction of fabric. The bending property has a great influence on the drape, stiffening style and handle of the fabric. The instrument test uses the specimen to bend under its own weight until the front end of the specimen comes into contact with a 41.5-level slope, as shown in Figure 2. The specimens were cut along the Longitudinal Direction and the latitudinal direction respectively. The length and width of the specimens were 20 cm and 5 cm. The edge of the sample should be clean and straight, and the short rectangular edge should not be loose. During the test, hold the sample gently to avoid the influence of test data, place the fabric on the instrument surface, and make sure that one end of the sample is parallel to the fabric indicator, but not touching. Press the platen on the specimen, leaving a length of 1 cm. Slowly move the platen to the right during the test, driving the specimen to move until the indicator light on the surface is on. Continue to slide to the right and the specimen enters the cavity and begins to bend, when an electronic detector detects the specimen, the screen displays the bending length, moves the specimen slowly to the left, and records the data.

Fast-2 fabric bending length testing instrument.
Flexure
Fast-3 elongation test is a method to measure the elongation of fabric under certain load. It can measure the elongation in any direction. In general, the elongation of fabric in warp and weft direction can be measured, and the shear stiffness can be calculated by testing the elongation of fabric in Oblique 45 angle direction. The FAST-3 extension tester applies a certain load to the test sample according to the principle of balance. When the weight is removed, the test sample is subjected to a force. The sensor is tested by monitoring the position of the balance arm, as shown in Figure 3. Test sample size and bending length test sample size consistent, along the warp, weft or Oblique 45 cut width of 5 cm, length of 20 cm rectangle, fabric edge flat clean, warp and Weft test sample size and bending length consistent. As the ductility is in accordance with the specification of the bending length specimen, the bending length test is usually carried out first, and the ductility test is carried out finally. Before the test, humidity was adjusted in a standard atmospheric environment of 20°C and 65% relative humidity.

Fast-3 fabric elongation tester.
Fuzzy neural network model
Selection of characteristic parameters
C Warp, C Weft, E5leftward and E5rightward with obvious linear relationship are eliminated from fabric style test data. Principal component analysis was used to determine the characteristic parameters of the retained indexes. In the practice of comprehensive evaluation, multi-index evaluation can cause the overlapping and interference of evaluation information, which makes it difficult to objectively reflect the relative status of the evaluated object. It is an objective and scientific way for multivariate statistical analysis to use a few new indexes which are not related to each other instead of a large number of indexes which are related to each other.
Principle of principal component analysis
The non-random variable is discussed by principal component analysis, and then it is extended to the random variable. 15 The original variables are replaced by a few unrelated new variables, in which the new variables are a linear combination of the original variables. 16 A new variable formed by a linear combination of the original variables is called a principal component.
Let n objects be evaluated by using P indicators for representation, get a matrix x about the initial data, such as formula (1)

Row Ai in the data matrix x represents the P index of the I sample (Xi1, Xi2, Xi3. . . Xip)(I 1,2,3. . . N); Column J of the Data Matrix x represents the evaluation value of n fabric samples evaluated by the index xj (x1j, x2j, . . ., xnj)′ J = 1,2, . . ., p; There is overlapping information between Xp, forming an inner product Matrix, as shown in Formula 2:

Where, the Element Aij Xi ′ Xi is the inner product of the index vectors xi and xj, the real symmetric matrix a can be diagonalized with P eigenvalues1⩾2⩾ . . . ⩾0, and the corresponding unitized eigenvectors q 1, q 2, . . . qp constitute the orthogonal matrices q1, q 2, . . . qp, use it to do orthogonal transformation, as shown in formula (3)

The J column of Y, yi = Xqi = q1ix1+q2ix2+. . .+qnixn, indicates that the New Composite Index Yi (called the J principal component) is a linear combination of the original index x 1, x 2, . . . xn (J can be 1,2, . . ., P), line I of Y (Yi1, Yi2, . . ., Yip) indicates the value of the first evaluation object under the new P composite index.
Principal component analysis process
The procedure of principal component analysis is as follows: firstly, the original data needed for principal component analysis is standardized, and the covariance matrix of p indexes is calculated The eigenvalues and eigenvectors of the Correlation Matrix R are calculated (the first eigenvalues are the variance of the first principal component, which reflects the degree to which the first principal component plays a role in describing the sample) The variance contribution rate and the cumulative variance contribution rate of each principal component are calculated (the first characteristic root is normalized to get the variance contribution rate of the first principal component; then the number of principal components is selected, the initial information is obtained mainly by fewer principal components, and the cumulative variance contribution rate is usually over 85% .
When the evaluation sample size is large, the process is complicated and the workload is huge. At present, there are many kinds of mathematical statistics software which can carry out the calculation of principal component analysis, it is only necessary to test the evaluation index, record the data and analyze it with the existing modules in the software, which is convenient, fast and not easy to make mistakes.
Results of principal component analysis
The indexes of evaluating fabric samples (T2, T100, B Warp, B Weft, GleftOblique, GRightOblique, E5warp, E5 weft, E20warp, E20weft) were analyzed by principal component analysis with SAS software, the results of principal component analysis after running the program are shown in Table 3. The principal component was determined by the cumulative contribution rate of more than 85%, and the principal component was determined by the cumulative contribution rate of Z1, Z2, Z3.
Results of principal component analysis.

According to Z1, Z2, Z3, the relations between Z1, Z2, Z3 and the evaluation indexes are obtained: Z1 = 0.039y1+0.099y2+ 0.307y3+0.337y4+ 0.393y5+0.375y6 -0.369y7 –0.383y8+ 0.285y9+0.349y10; Z2 = 0.511y1+0.507y2+ 0.343y3+0.336y4 +0.096y5 +0.014y6 +0.212y7+ 0.192y8+ 0.292y9+ 0.276y10; Z3 = −0.204y1–0.189y2–0.247y3+0.044y4+0.433y5+ 0.578y6+ 0.361y7+ 0.139y8 +0.434y9 –0.031y10.The relation between the comprehensive evaluation value and each evaluation index is calculated by using the characteristic value: The Composite Index = 0.196y1+0.227y2+0.267y3+0.308y4+0.283y5+0.256y6–0.076y7–0.112y8+0.302y9+0.284y10. As for the Comprehensive Index, the influence degree of the seven evaluation indexes (y2–y6, y9, y10) is great, and these seven evaluation indexes are chosen as the input of the follow-up model. They are T100, Bwarp,Bweft、GleftOblique, GRightOblique, E5warp, E5weft, E20warp, E20weft.
Sample classification optimization
Cluster analysis was carried out on 85 fabric samples with valid experimental data. Cluster analysis is the grouping of many things which have the same or similar attributes. It is the basic content of numerical taxonomy and a multivariate statistical analysis method for quantitative classification of statistical samples. Applying this method to comprehensive evaluation, on the one hand, it can give direct evaluation results for classification evaluation problems, on the other hand, it can also provide training samples for other comprehensive evaluation methods such as follow-up discriminant analysis, to form the framework of integrated evaluation in order to improve the effectiveness of integrated evaluation. Cluster analysis is mainly based on point distance and class distance. There are euclidean distance and Prasanta Chandra Mahalanobis distance; there are minimum distance method, average distance method and ward method.
Principles of cluster analysis
Cluster analysis is faced with a group of unknown distribution data, using the relationship information between the data, the things are clustered into classes, so that the similarity between classes is small, the similarity within classes is large. 17 Using the method of square deviation and distance ward to cluster the samples: Suppose n Samples x1, x2, . . ., xn.They are all P dimensional row vectors. They are described by P indexes, we obtain that the center of gravity is a p-dimensional row vector, which is divided into k classes A1, A 2, . . ., AK, and recorded as the center of gravity of Class AI. When two classes merge into a new class, the ward distance of two classes is defined as the increase of the decrease of the sum of the squares of the differences between the two classes when the two classes are merged.
Cluster analysis process
According to the principle of cluster analysis, 85 kinds of fabrics were measured by ward method with SAS software, including moisture regain, transverse density, longitudinal density, weight and thickness. The moisture regain is calculated according to the proportion of raw materials in the fabric and the given moisture regain, and the transverse density and longitudinal density are taken as the number of coils of 5 cm in length in two directions respectively. The data set of fabric number and measured data is built, and the effective samples of data are analyzed by ward method. The main statement is as follows: proc cluster data=fabricsample method=ward.
Cluster analysis results
The results of cluster analysis were obtained by running in SAS software, and the fabric samples were divided into nine groups, as shown in Table 4. According to the results of clustering, some fabric samples were selected as training samples and test samples respectively. The training sample 70, the test sample 10 and the remaining samples were used to verify the accuracy of the model. The numbers of test samples were 24, 53, 54, 36, 64, 94, 35, 22, 93, 63; the verification samples were 42, 69, 26, 83 and 91. The rest were training samples.
Classification of fabric samples.

Models of the fuzzy neural network
Neural network model structure
Fuzzy neural network is a neural network with the structure and properties of a neural network. 18 A process in which the concepts and rules of encification are applied to a neural network to attenuate the interaction between them. The module and the neural network both the module and the logic knowledge extraction and the ability of self-learning.
The structure of the fuzzy neural network is mainly divided into four parts, including the input layer, blur, clarify and the output layer, 19 as shown in Figure 4. The input layer takes the index of principal component analysis as the input layer of the model, and gets a single comprehensive value by means of modularization and calculation of modularization rules.

Structure planning of fuzzy neural network.
Input Layer: the input layer mainly aims at the characteristics of knitted suit fabric, on the basis of ensuring stiffness and formability, it also has a certain degree of comfort, seven performance indexes, T100, B warp, B weft, GleftOblique, G RightOblique, E20warp and E20 weft. They are taken as input to establish a sample data set of 7 × 70. The data set is the experimental data in the actual style test, the original data set is processed by mold and melt layer to eliminate the dimension of different indicators, and the mold and normalization are carried out by Mapmin Max function Then u(i,j) = exp(–(x(i)–c(j,i))^2/b(j,i)), I are used to calculate the membership value of the Modulus, and w(i) = u(1,i)*u(2,i)*u(3,i)*u(4,i)*u(5,i)*u(6,i)*u(7,i); yi(i) = p0_1(i)+p1_1(i)*x(1)+p2_1(i)*x(2)+p3_1(i)*x(3)+p4_1(i)*x(4)+p5_1(i)*x(5)+p6_1(i)*x(6)+p7_1(i)*x(7); In the formula, b, c, p0-p7 are calculated randomly according to the number of model nodes, and i is the number of inputs Finally, the comprehensive evaluation value obtained by the inverse normalization function mapminmax is clarified and output.
The input node number I is set to 7, the implicit node number M is set to 14, and the output node number is set to 1. Structured as 7-14-1. There are 14 membership functions and 8 coefficients p0–p7 in the model. Membership Function c and b in the program randomly obtained.
Neural network model
Training of the fuzzy neural network model
The training process of the modular design includes parameter initialization, neural network training and neural network prediction 20
(1) Parameter initialization: Xite 0.002; Alfa 0.04; p0-p7, C and B are obtained randomly according to the system characteristics.
(2) Neural network training, including the calculation of output layer settlement and pattern and rule. In the output layer, the input value is modularized by means of the membership function to get the membership value U, and the W is calculated by means of the membership rule.
(3) Neural network test: The test process also uses the membership function and the modulus and rule to predict the network of the model.
The number of iterations in the model is 450, after training of the model and the neural network as shown in Figure 5. Figure 5 in the model training results, the red line represents the actual calculated output, the Blue Line represents the model training prediction output, and the Green Line represents the difference between the actual output and the predicted output, but the difference is less than 0.3, most of them are about 0.1, and the error is relatively small.

Neural network training data.
Modularization and neural network model testing
The test result of the model is shown in Figure 6. The error prediction of the test data in Figure 6 is about 0.02, except the error prediction of No. 7 sample is 0.22, the other samples are all within 0.1, basically, the error is about 0.02. The average value, Coefficient of variation and weight are calculated by using the sample data, and the difference between knitted suit fabric and woven suit fabric is characterized by European closeness. The serial numbers 1 to 10 in the neural network test correspond to 22, 24, 35, 36, 53, 54, 63, 64, 93, 94 respectively. The evaluation values of each fabric sample obtained by model prediction and practical calculation are shown in Table 5. Among the fabric samples, 22 and 24 are woven suit fabrics, and the other eight fabrics are knitted suit fabrics. The predicted value of No. 93 fabric is similar to that of No. 22 and No. 24, and that of No. 54 fabric is similar to that of woven fabric Except the value of No. 94 fabric is less than 0.5, the others are all over 0.6. According to the distribution of evaluation value, the primary selection evaluation value of knitted suit fabric is close to that of woven suit fabric, and the fabric with evaluation value above 0.6 can be used in knitted suit, most fabrics with a value less than 0.6 are not suitable for the application of knitted suits. The measured value is calculated by means of the test data of fabric style. The error between the actual calculation and the model prediction is small. The model can objectively evaluate the style of knitted suit fabric. Through the comparison and analysis between the predicted value and the bending stiffness of the sample, it is found that the higher the bending stiffness of the sample is, the higher the value of the sample is, it’s smaller. The evaluation value of bending stiffness is about 5 to 20, the extensibility is less than 20, the shear stiffness should not be too large, too large will affect the evaluation value.
Evaluation of test samples.


Neural network test data.
Input-end factors and output-end results
According to the control variable method, the data of the six input factors are kept unchanged, and the data of the remaining factors are changed 1.5, 2.5, 3.5, 3.5, 4.5, 4.5 and five times, and compare the output of the model under different multiples, as shown in Figure 7. The factor data of the input side is multiplied, and the factor data has a great influence on the output prediction value in the range of 2 times of the actual data.
(a) Relationship between predicted output values and changes in T100
(b) Relationship between predicted output values and changes in meridional bending stiffness
(c) The relationship between the output prediction value and the zonal bending stiffness change
(d) The relationship between the output prediction value and the left Oblique bending stiffness change
(e) Relationship between predicted values and changes in right oblique shear stiffness
(f) Relationship between predicted values and changes in warp elongation of fabrics
(g) The relationship between the predicted output and the change in the zonal elongation of the fabric

Relationship between model output data and input-side data changes.
Neural network model validation
The model was validated with five fabric samples. The basic parameters of 5 fabrics are shown in Table 6. The five samples cover a variety of raw materials as well as a variety of grams, which can objectively evaluate the style of the fabric. According to the input of the mold and neural network model, test the style of the verification sample, the experimental data include seven indexes: T100, B Warp, B Weft, E20 Warp, E20 Weft, Gleft Oblique, Gright oblique as shown in Table 7.
Basic parameters of validation samples.

Validation sample input data.

The data of seven parameters of verification samples were used as input to verify the model. According to the structure of the model, the input data are transformed into membership values by membership functions. The predicted values of the model are 0.905, 0.689, 0.697,0.834 and 0.780 respectively. The model prediction value of No. 1 fabric is 0.905, followed by No. 4 fabric and No. 5 fabric. The evaluation value of the two fabrics is 0.834 and 0.780 respectively. The other two fabrics are below 0.7. Through Tables 1–5, we can get the basic parameters of several fabrics, from which we can find that No. 1, No. 4 and No. 5 fabrics all contain wool and polyester two kinds of raw materials; No. 2 and No. 3 fabrics contain polyester, cotton respectively, although both of them have large weight and thickness, they have no obvious improvement on the overall style of the fabric. Although the weight and thickness of No. 4 and No. 5 fabrics are small, but its raw materials contain wool and polyester, enhance the fabric style, the model prediction evaluation is superior.
Comprehensive evaluation
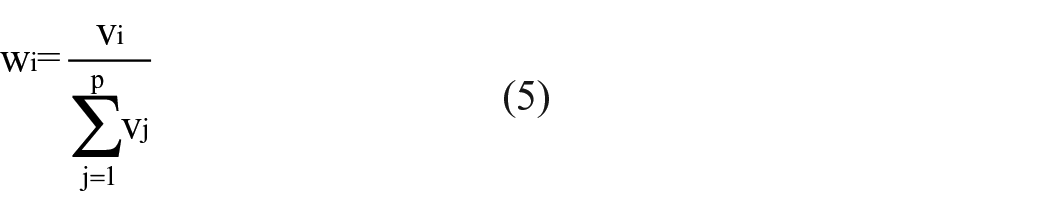
Comprehensive evaluation can be achieved by using different evaluation indexes to apply the characteristics and advantages of each index to the same problem by weighting them, thus improving the quality of comprehensive evaluation. 21 The linear comprehensive evaluation of 5 kinds of knitted suit fabric verification samples was carried out to prove the accuracy of output value predicted by the model. The variation coefficient and weight ratio are calculated from the test style data, and the comprehensive evaluation value is calculated as shown in formula (4) to (7).

Where, I takes 1,2, . . ., 7

Where, Xji represents the value of the J evaluated object in item I, Ximin and Ximax are the minimum and maximum in item I

Where, Z is the comprehensive evaluation value of the evaluated fabric, Wi is the weight of the index I, Yi is the evaluation value of the index I, and P is the number of the index.
Through formula calculation, the comprehensive evaluation values are 0.3, 0.7, 0.7, 0.3 and 0.1 respectively. Of the five fabrics, No. 1 is a woven suit fabric,others are knitted suit fabric. The comprehensive evaluation value of No. 4 knitted sample is very close to No. 1, followed by No. 5, while the comprehensive evaluation value of No. 2 and No. 3 fabrics is quite different from No. 1, it shows that the synthetic style is not close to No. 1 woven suit fabric, but No. 4 and No. 5 knitted suit fabric is similar to No. 1 woven suit fabric, which can be used in the application and development of knitted suit fabric. The result of multi-index comprehensive evaluation is consistent with that of model prediction. The style of No. 4 and No. 5 fabric is close to that of traditional woven suit fabric.
The relationship between the model output data and the linear comprehensive evaluation value is shown in Figure 8. According to the trend line, the mathematical relationship between the model output (Y) and the linear comprehensive evaluation (x) is y = 92.847x4–165.78x3 + 98.345x2–21.767x + 2.3082.
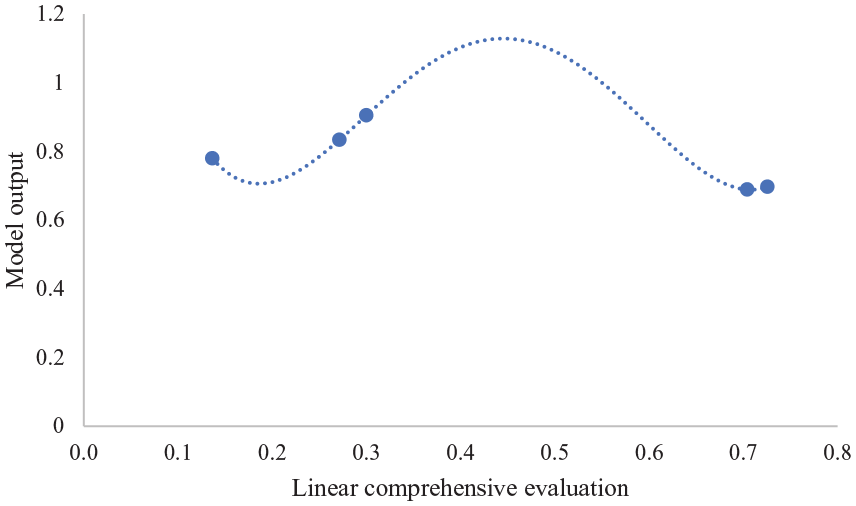
Relationship between model output and linear comprehensive evaluation.
Conclusion
The input, training and test samples of the fuzzy neural network were determined by principal component analysis, cluster analysis, and the model of the fuzzy neural network with 7-14-1 structure was established. The flexural stiffness is between 5 and 20, the extensibility is within 10 to 20, and the shear stiffness is within 50. The evaluation value is relatively good. Balanced seven performance indicators, fabric integrated style will be excellent, when a single index is too prominent, but will destroy the balance between fabric properties.
According to the characteristics of the output value of the model, when the output value of the model is above 0.6, the fabric style of knitted suit fabric is similar to that of woven suit fabric, the indexes basically meet the requirements of suit fabric and can be used for development and production. The evaluation results of five kinds of fabrics by linear comprehensive evaluation are consistent with the output of fuzzy neural network model. Polyester and wool are used in knitted suit fabric to obtain better fabric style. Polyester, which mainly provides support for the fabric, is an indispensable raw material for knitted suit fabric.
The relationship between the output and the input data of the model is a 6-degree polynomial, and the change of the input factor within two times on the prediction result. The relation between the output of the model and the linear comprehensive evaluation method is y = 92.847x4–165.78x3 + 98.345x2–21.767x + 2.3082.
Footnotes
Declaration of conflicting interests
The author(s) declared no potential conflicts of interest with respect to the research, authorship, and/or publication of this article.
Funding
The author(s) received no financial support for the research, authorship, and/or publication of this article.