
Abstract
Temperature and stretching are important factors in the high-temperature treatment of carbon fiber. The axial stress during carbon-fiber high-temperature treatment affects its ability to stretch. The high-temperature axial stress evolution mechanism of polyacrylonitrile-based carbon fiber was studied through in situ tension tests, Raman spectroscopy, X-ray diffractometry, elemental analysis, X-ray photoelectron spectroscopy, high-resolution transmission electron microscopy, thermal expansion coefficient tests, and density methods. The high-temperature axial stress evolution of polyacrylonitrile-based carbon fiber involved three stages: rapid increase, rapid decrease, and relaxation. The highest stress and relaxation temperatures of the polyacrylonitrile-based carbon fiber were 1600°C and 1950°C, respectively. The main factors that affected the fiber axial stress included carbon-structure rearrangement and the effect of thermal expansion and cold shrinkage on fiber length. During the first stage (T < 1600°C), carbon-structure rearrangement after nitrogen atom removal increased the fiber axial stress. In the second stage (1600 ⩽ T ⩽ 1950°C), the difference in the thermal expansion of fibers that entered the graphite furnace and the cold shrinkage of fibers that exited the graphite furnace increased gradually, which resulted in a decrease in fiber axial stress by up to 1950°C, where the fiber relaxed and the third stage (T > 1950°C) began. The difference between expansion and shrinkage increased significantly, which increased fiber relaxation. Carbon fibers with fewer nitrogen atoms and more regular structures had a lower axial stress during high-temperature treatment, but the trend and characteristic temperature remained unchanged. The corresponding fiber high-temperature maximum stretching ratio and axial stress showed opposite trends below 1950°C. The ability to stretch the carbon fiber increased above 1950°C, which differed from the axial stress relaxation.
Introduction
Polyacrylonitrile (PAN)-based carbon fiber (PANCF) is a preferred candidate for advanced composite reinforcement in many fields because of its high strength, high modulus, and low density. 1 3 During preparation, the temperature, time, and tension are three important factors that affect the PANCF’s final properties. A higher temperature, longer time, and an increased stretching tension promote the required structure, growth, and ordered arrangement of crystallites. The applied stretching tension affects the preferred orientation of microcrystals in the carbon fiber.4–7 In high-strength, high-modulus, carbon-fiber synthesis, an increase in treatment temperature increases the fiber tensile modulus but decreases the tensile strength. 8 Carbon-fiber preparation is continuous, which means the range of suitable treatment times is relatively narrow. Therefore, high-temperature hot stretching has become of significant research interest in carbon-fiber development. High-temperature treatment (HTT) and simultaneous moderate stretching can increase the carbon-fiber tensile strength and tensile modulus through a preferred orientation of carbon crystallites.9,10
Research5,9–12 has shown that carbon fibers can stretch during high-temperature graphitization. The specific mechanism that underpins this relationship remains unclear but it must be related to a series of complex changes that occur during HTT. Carbon fiber undergoes complex physical and chemical changes during HTT,11,13 including non-carbon element removal, the rearrangement and isomerization of carbon hexagonal ring planes, carbon crystallite growth, and preferred orientation alignment. HTT involves macrophysical changes, including the thermal expansion and cold shrinkage of carbon fibers that enter and exit the high-temperature graphitization furnace, respectively. The combined effects of these changes, which are induced by heat treatment, influence the macro axial stress of the fibers, which affects their ability to stretch.
Changes in fiber axial stress during HTT are common for organic and metal fibers. However, because of the complex internal carbon-fiber carbon structure, stress changes of the carbon fiber during HTT are more complicated than those of typical metal and organic fibers. Various application fields have different requirements for carbon-fiber performance. Carbon fibers with different properties have been prepared at different temperatures. Therefore, it is important to explore the axial stress high-temperature evolution law of carbon fibers and the internal mechanism, which favors the development of high-temperature stretching treatments and the design of carbon-fiber components and/or structures.
However, no studies have reported the axial tension evolution during the HTT of carbon fibers of a fixed length. The evolution of carbon-fiber axial stress in the temperature range between high-temperature carbonization and graphitization remains unclear. The treatment of carbon fibers in this temperature range is important for the preparation of high-strength or ultra-high-strength carbon fibers. The high-temperature evolution of axial stress was investigated through in situ detection of PANCF tension at a fixed deformation, and the intrinsic mechanism behind its axial stress changes was also explored by analyzing the physical and chemical changes of the carbon-fiber structures during HTT, whereas the axial stress evolution differences of carbon fibers with different initial structures were compared by investigating the structure and composition. Our objective was to establish the relationship between the axial stress of the carbon fiber and the treatment temperature to provide theoretical guidance for the high-temperature stretching treatment of carbon fiber.
Experimental
High-temperature tension test of carbon fibers
The PAN precursors with 12,000 filaments per tow and a single fiber diameter of ~9.0 μm were provided by the Research Institute of Jilin Petrochemical Company (Jilin, China). The precursors comprised PAN copolymer with 97.5 wt% acrylonitrile and 2.5 wt% itaconic acid. The PAN precursor fibers were stabilized and carbonized using a self-designed pilot production line, which comprised four stabilization furnaces and two carbonization furnaces. The stabilization furnaces were set at 200°C, 235°C, 255°C, and 270°C and stretching ratios of 2%, 1%, 0%, and 0%, respectively. The PAN fibers were stabilized by passing through all four furnaces for approximately 1 h in air at a constant flow rate of 65 L min−1. The continuous carbonization treatment involved pre-carbonization and carbonization, which were performed in nitrogen (>99.999%). During pre-carbonization, the fibers were stretched at 3% in the furnace at 650°C for 5 min. During carbonization, the fibers shrunk by 3% in the furnace at 1350°C for 3 min. The carbonized fibers that were produced under these conditions were denoted as PANCF-1. The nitrogen gas flow rate was kept at 10 and 5 L min−1 in the pre-carbonization and carbonization furnaces, respectively.
PANCF-1, from the high-temperature carbonization furnace, was treated continuously at 1400°C–2400°C in nitrogen (>99.999%) for 144 s in the graphite furnace. The fiber length was kept constant in the graphite furnace. The nitrogen gas flow rate was held at 15 L min−1 in the graphite furnace, and the fiber tension was measured in situ using a tension meter (DN1-5000; Schmidt, Berlin, Germany). A schematic diagram of the tension meter is shown in Figure 1. Each measurement was conducted five times and the mean values were used.

Schematic diagram of apparatus used to measure HTT tension of PANCF samples.
Another carbon fiber that was termed as PANCF-2 was prepared by increasing the carbonization temperature to 1450°C without changing any other conditions. PANCF-2 was heated continuously at 1500°C–2400°C. Besides the carbonization temperature, other conditions were the same as those that were used to fabricate PANCF-1. The fiber tension after graphitization was also measured using the same method as that to evaluate PANCF-1.
Preparation of carbon-fiber samples
Some samples were prepared and characterized to analyze the high-temperature axial stress evolution of the carbon fibers. Using PANCF-1 as the raw-material carbon fiber, fibers that were prepared at graphitization tension test temperatures of 1400°C, 1600°C, 1900°C, 2100°C, and 2400°C were used in structural tests. These fiber samples were denoted as F-XX. PANCF-1 and PANCF-2 were used as raw-material carbon fibers, and the fibers that corresponded to each graphitization tension test point were also sampled for bulk density and linear density tests.
Characterization
Elemental analysis
The elemental composition of the PANCF samples that were prepared at different temperatures was obtained by elemental analysis (Vario Micro Cube; Elementar Analysensysteme GmbH, Langenselbold, Germany). Each sample was analyzed twice and the mean values were used.
Raman spectroscopy
The chemical structure of the carbon fibers was measured by a Raman spectrometer (RM2000; Renishaw Plc, Pontyclun, UK) with an optical microscope. The excitation light of the Raman spectrometer was provided by a 532-nm laser (Ar ion) and a 0.7-μm-diameter laser spot. The fibers were fixed on a glass slide. The 50× objective lens of the microscope was used to focus the laser beam on the specimen and to collect the scattered radiation. Raman signals were observed for samples in the wavenumber range from 1000 to 1850 cm−1. Fibers were exposed to the laser for 15 s each time, with 10 cumulative exposures. The Raman spectra were curve-fitted to a Lorentz–Gauss area function using the software Peak Fit v4.12 to acquire peak positions. The Raman spectrum of each sample was measured five times and the mean values were used.
X-ray diffractometry
The crystal structures of the fibers were determined using an X-ray diffractometer (X’Pert PRO MPD; PANalytical, Almelo, The Netherlands) that was operated at 40 kV and 40 mA with Ni-filtered Cu–Kα radiation. The data were collected over a 2θ range from 10° to 90° at 4° min−1 in the equatorial and meridian scans, and data for the azimuth scan (002) were collected for 90°–270° at 6° min−1. The apparent crystallite size was calculated from the baseline-corrected and resolved peak profiles. The X-ray diffraction (XRD) pattern for each sample was measured five times and the mean values were used. The XRD patterns were curve-fitted to a Lorentz–Gauss area function using the software Peak Fit v4.12 to acquire the peak position, peak intensity, and full width at half maximum (FWHM). The diffraction peak positions and FWHM values were used to calculate the crystallite size using the Scherrer equation

where θ is the diffraction peak position of the (nlk) plane, λ = 0.15406 nm is the X-ray wavelength, B is the FWHM of the peak (rads), and K is the Scherrer geometric factor or shape factor. The crystallite correlation lengths along and perpendicular to the fiber axis, La|| and La⊥, respectively, were determined from the (100) diffraction peak of the meridian and equatorial scans, respectively. K was 1.84 for La.5,13 The orientation angle was calculated from the azimuth scan data. Equations (2) and (3) were obtained according to the method that is used to calculate Herman’s orientation factor


where I(φ) is the azimuthal intensity distribution function of the (100) diffraction and Φa,z, Φb,z, and Φc,z are the angles between one of the normal vectors of the lattice plane (i.e. vector

By combining equations (2)–(4),
High-resolution transmission electron microscopy
The crystal structure of the carbon fibers was observed using a high-resolution transmission electron microscope (HRTEM; ARM-1250; JEOL, Japan) with an acceleration voltage of 300 kV. For the HRTEM observation, the sample fiber was cut into small pieces and ground in an agate mortar. The ground powder was mixed with anhydrous ethanol (1:99 mass ratio) to form a suspension. After ultrasonic treatment, the suspension was dropped onto a microgrid and left for ~10 min before testing to allow the solvent to evaporate.
X-ray photoelectron spectroscopy
The binding state of nitrogen on PANCF-1 and F16 fiber surfaces was analyzed by X-ray photoelectron spectroscopy (XPS; ESCALAB 250; Thermo Fisher Scientific, USA). Spectra were collected in fixed-analyzer transmission mode. The high-resolution nitrogen scans were collected with a pass energy of 30 eV. The XPS curve for nitrogen was fitted to a Lorentz–Gauss area function using the software Peak Fit v4.12 to acquire the peak position and area.
Thermal expansion coefficient
The thermal expansion coefficients of the PANCF samples with different structures were determined by the quartz expansion method. A schematic diagram of the test is shown in Figure 2, in which the national standard test method for the linear expansion coefficient of solid materials (GJB332A-2004) was used as a reference. The sample holder in Figure 2 was made from quartz. The dried carbon fiber bundle was folded in half, passed through a hole at the lower end of the quartz support rod, and fixed at the upper end to prevent the carbon fiber from loosening. The carbon-fiber bundle was supported by a support rod with a constant small tension. A microdistance measurement device at the upper end of the rod was used to detect the change in length of the two carbon-fiber strands. The support rod and carbon-fiber bundle were placed in a temperature-controlled thermostat for testing. The calculation of linear expansion coefficient was according to equation (5)
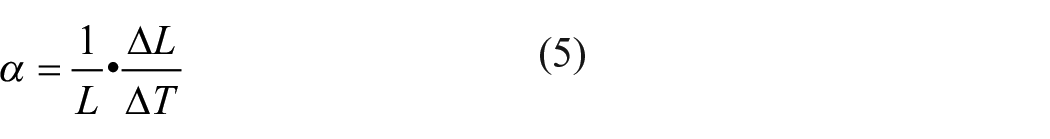
where ΔL is the change in object length at a given temperature change ΔT and L is the object length. An equation to calculate the coefficient of linear thermal expansion (CLTE) of the carbon-fiber bundle was obtained by combining the characteristics of the test device
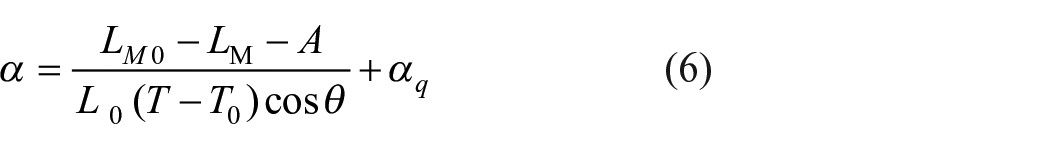
where α is the CLTE (°C−1); T0 and T are the room and test temperatures (°C), respectively; LM0 and LM are the displacements (mm) at temperatures T0 and T, respectively; L0 is one-quarter of the length of the carbon-fiber sample at T0 (mm); αq is the CLTE of quartz (°C−1); θ is the angle between the sample and the support rod (°); and A is the correction parameter (mm). The correction parameter A (mm) was obtained by calibration with high-purity quartz glass fibers. The initial length of the test fibers was 320 mm and the heating rate was 5°C·min−1. Each sample was measured twice and the mean values were used.

Schematic diagram of CLTE test device.
Results and discussion
High-temperature axial stress evolution of PANCF samples
Figure 3(a) shows the axial tension of PANCF-1 and PANCF-2 at different treatment temperatures. The PANCF-1 and PANCF-2 stresses in Figure 3(b) were calculated based on the in situ tension and their cross-sectional area at different treatment temperatures. The cross-sectional area of the PANCF samples with 12,000 filaments per tow was calculated by dividing the linear density by the bulk density. The trends of axial tension and stress of PANCF-1 and PANCF-2 with an increasing treatment temperature were similar. The curves contained three stages: a rapid increase in stage I, a rapid decrease in stage II, and slow relaxation in stage III. The maximum stress of both PANCF samples occurred at ~1600°C and their relaxation temperatures were ~1950°C. The three stages should be related to the complex changes that occurred during the HTT. PANCF-1 was used as an example to investigate the high-temperature evolution law by analyzing the physical and chemical structure of fibers that were prepared at different temperatures.

High-temperature axial tension (a) and stress evolution (b) of PANCF samples with a constant fiber length.
The axial tension and stress of PANCF-2 were lower than those of PANCF-1 before relaxation. According to the data in Table 1, compared with PANCF-1, PANCF-2 had a lower elemental nitrogen content, its carbon crystallite size was larger, and its crystallite alignment was more regular. Certain differences existed between the structures of the two fibers. During the high-temperature graphitization treatment of carbon fibers with different initial structures, their structural differences gradually decrease as the treatment temperature increases. 15 When the treatment temperature increases above 1800°C, their carbon structures converge. For the analysis of the internal factors of the high-temperature axial stress evolution of PANCF-1, in this study, the differences in stress between PANCF-1 and PANCF-2 during HTT were analyzed by comparing the structural differences between PANCF-1 and PANCF-2 and verifying the mechanism of the high-temperature axial stress evolution of the PANCF.
Basic composition and structural parameters of PANCF-1 and PANCF-2.

PANCF: polyacrylonitrile-based carbon fiber.
Chemical structure changes of PANCF samples during HTT
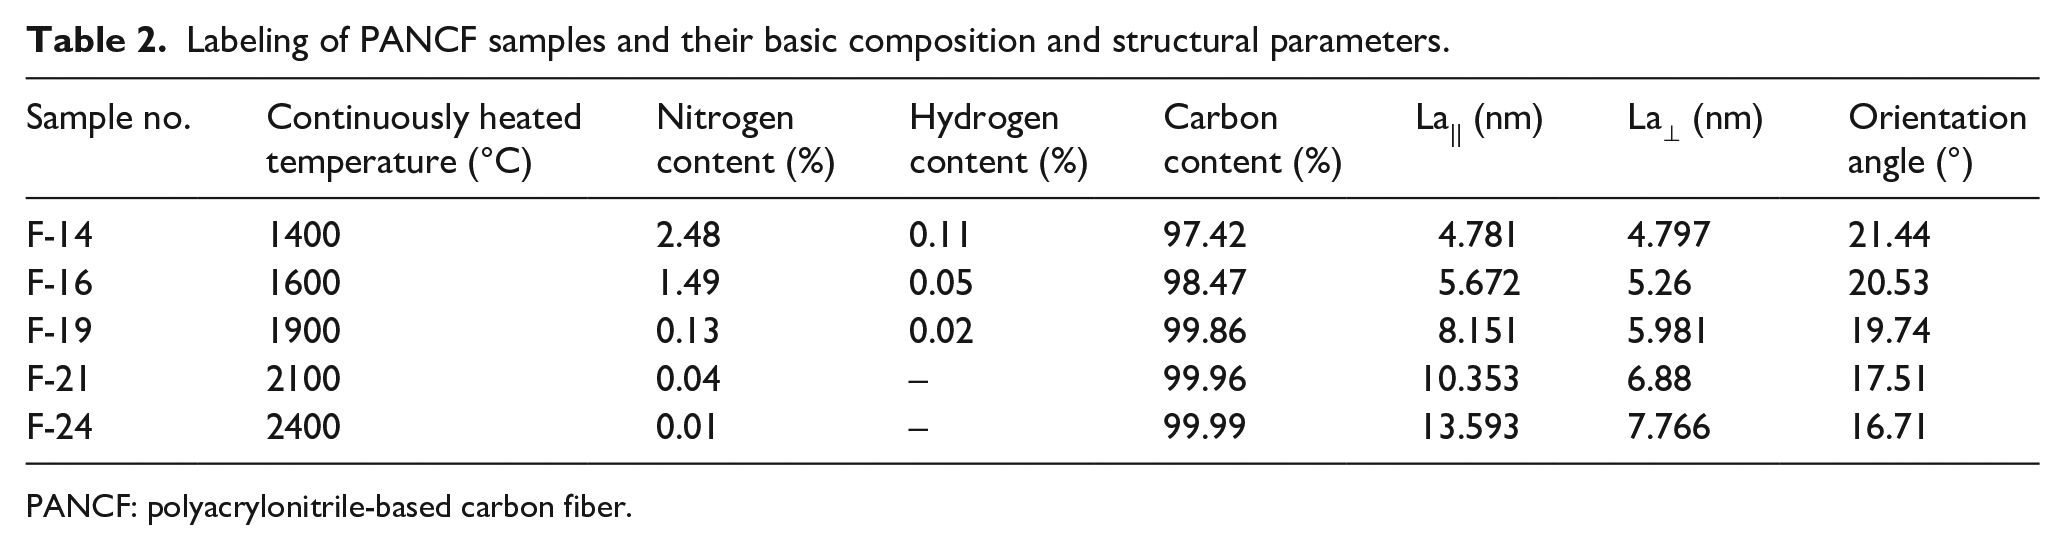
The HTT of the PANCF samples induced changes in their composition and crystalline structure, as summarized in Table 2. Nitrogen is the most abundant non-carbon element in the PANCF samples. Nitrogen removal at high temperature induced the carbon-structure rearrangement. The nitrogen bonding states of PANCF-1 and F-16 were analyzed by XPS, as shown in Figure 4.
Labeling of PANCF samples and their basic composition and structural parameters.
PANCF: polyacrylonitrile-based carbon fiber.

N 1s spectra of PANCF-1 (a) and F-16 (b).
The two main peaks at 397.9 and 400.5 eV in the N 1s spectrum of PANCF-1 in Figure 4 were consistent with the presence of pyridinic nitrogen and graphitic nitrogen, respectively.16,17 The ratio of each peak area to the total area was calculated from the peak fitting to determine the relative contents of the two bonding states and were 24.2% for pyridinic nitrogen and 75.8% for graphitic nitrogen. Based on the elemental nitrogen content of PANCF-1, the mass percentages of the pyridinic nitrogen and graphitic nitrogen states were 0.91% and 2.83%, respectively. Therefore, graphitic nitrogen was the main chemical bonding state of nitrogen in PANCF-1. Schematic diagrams of the two nitrogen bonding states in PANCF-1 are depicted in Figure 4.
To study the removal of nitrogen from the PANCF during HTT, the F-16 sample that was obtained by retreating PANCF-1 at 1600°C was subjected to XPS analysis. The N 1s spectrum of F-16 in Figure 4(b) indicated that its pyridinic nitrogen atom content was higher than that of its graphitic nitrogen atoms. The pyridinic and graphitic nitrogen values in F-16 were 59.0% and 41.0%, respectively, and their respective contents were 0.88% and 0.61%. A comparison of the contents of the two bonding states of nitrogen in PANCF-1 and F-16 showed that a large amount of graphitic nitrogen atoms was removed when the treatment temperature was increased to 1600°C.
After graphitic nitrogen atom was removed from the PANCF, an unstable structure that was similar to a single-hole graphene defect was generated in the carbon network. These defects recombined rapidly and grew, as shown in Figure 5. The rapid removal of nitrogen atoms and the isomeric rearrangement of the carbon network were two competing reactions during the HTT of the PANCF. These reactions caused the rearrangement of electron clouds; thus, the changes in Raman spectral characteristics reflect the interaction of these two competing reactions. The Raman spectra of carbon fibers at different treatment temperatures are shown in Figure 6(a). The spectra contain two characteristic bands18,19: the G band at ~1580 cm−1 and the D band at ~1350 cm−1. First-order D and G bands have been observed in the Raman spectra of many carbonaceous materials and their origin has been discussed in the literature.20,21 The G band is attributed to the in-plane tangential stretching mode of sp 2 C–C bonds (E2g vibration), which represents the ordered graphite crystallite structure. With an increase in treatment temperature, the G band shifted to a higher frequency initially and then to a lower frequency. However, the G band did not appear at 1580 cm−1, which is the characteristic peak position of regular graphite. The changes in G-band position indicate that rapid nitrogen atom removal caused a blue shift of this band and isomeric rearrangement of the carbon network that led to the G band appearing at 1580 cm−1. The interaction between the two reactions caused the initial increase and subsequent decrease of the blue shift of the Raman G band with an increase in treatment temperature, as shown in Figure 6(b). The maximum blue shift of the Raman G peak was observed for the sample that was treated at ~1600°C.

Rearrangement reaction caused by nitrogen removal.

Raman spectra (a) and Raman G-band shift (b) of PANCF-1 as a function of HTT.
With the removal of nitrogen atoms, the planarity of the carbon network increased, which promoted carbon crystallite growth. Carbon crystallite growth caused the fibers to shrink. According to the carbon crystallite sizes La|| and La⊥ in Table 2 and La in Figure 7, as the treatment temperature increased, the carbon crystallites tended to grow along the fiber axis direction, so the shrinkage along the fiber axis direction was more severe than that perpendicular to the fiber axis. Nitrogen removal caused the G-band blue shift. A maximum blue shift was observed for the sample that was treated at 1600°C, which indicated that planar isomerization of the carbon network occurred at this temperature, which resulted in the maximum carbon-fiber axial stress, as shown in Figure 3. When the treatment temperature exceeded 1600°C, a gradual strengthening of other effects caused the stress to decrease gradually, which is analyzed below.

La|| and La⊥ of PANCF-1 as a function of treatment temperature.
Physical structural changes of PANCF samples during HTT
Thermal expansion and cold shrinkage are the characteristic properties of most materials. In the HTT of the PANCF, PANCF-1 or PANCF-2, a turbostratic graphite structure was fed into a high-temperature graphite furnace at room temperature and was converted into target fibers with a pseudo-graphite structure, as depicted in Figure 1. The target fibers were collected at room temperature. Thus, the above process involved the thermal expansion of the PANCF and the subsequent cold shrinkage of the target fibers with a relatively regular structure. Thermal expansion and cold shrinkage were relative. The furnace temperature was much higher than room temperature. Compared with PANCF-1 at room temperature, the fibers in the graphitization furnace expanded linearly because of the heat. Compared with the fibers that had expanded in the graphitization furnace, target fibers at the exit of the graphitization furnace shrank linearly when they entered the room-temperature environment.
In theory, carbon fiber undergoes only physical structure changes when the treatment temperature is lower than the preparation temperature, and it undergoes complex physical and chemical structure changes when the retreatment temperature exceeds the preparation temperature. Therefore, the CLTE of the fibers along the axial direction could only be tested below the preparation temperature, as shown in Figure 8. Although the CLTE values of the fibers were negative when the CLTE test temperature was below 550°C, the CLTE of F-14 was positive when it was measured at 600°C. The continuous in situ stress tests were conducted above the preparation temperature of PANCF-1; the lowest in situ stress test temperature was 1400°C. As the CLTE test temperature increased, the CLTE values of different carbon-fiber samples increased linearly. The CLTE values of PANCF-1 would be positive during stress testing. A comparison of the crystallite structures of F-XX in Table 2, which were prepared from the PANCF-1, shows that the crystallites in F-14 were small and irregular, whereas those in F-24 were large and regular. Thus, F-14 would contain more porous irregular structures than F-24. Figure 8 shows that the CLTE of F-14 was highest and that of F-24 was lowest. The material structure changes that were caused by cold shrinkage and thermal expansion were opposite, but they are inherent physical properties of many materials. When the temperature change range is constant, cold shrinkage and thermal expansion are related only to the material’s inherent structure. Therefore, when the temperature change range was constant, as the temperature decreased, a material with a large thermal expansion coefficient showed more cold shrinkage. That is, the cold shrinkage of F-14 was largest, whereas that of F-24 was smallest.

CLTE of carbon-fiber samples as a function of tested temperature.
During the HTT of the PANCF, the temperature change range of the fiber thermal expansion was between room temperature and the graphite furnace temperature, which was the same as the fiber cold shrinkage. For the stress curve of PANCF-1 in Figure 3, the structure of the PANCF that was fed into the graphite furnace remained unchanged. However, as the treatment temperature increased, the PANCF expansion increased at the entrance to the graphite furnace. The target fiber structure became more ordered, which resulted in less shrinkage at the graphite furnace outlet. As the treatment temperature increased, the difference in the effects of thermal expansion and cold shrinkage on the fiber length increased, which caused the fibers to relax. The continuous orientation of the disordered graphite structure caused the fibers to elongate along the fiber axis, according to the HRTEM image in Figure 9 and orientation angles in Tables 1 and 2 as calculated from equations 1–3. The combination of these two factors induced fiber relaxation, which increased with an increase in treatment temperature.

Aggregation structures of different fibers.
Mechanism of high-temperature axial stress evolution of PANCF and its relationship with the maximum stretching ratio
Four changes during the HTT affected the axial stress of the fibers, namely, the differences between the effects of thermal expansion and cold shrinkage on the fiber length, the increased crystallite orientation, the rearrangement from the removal of non-carbon elements, and the growth of planar carbon hexagonal rings. The former two physical changes caused the fibers to relax axially, and the latter two chemical changes caused the fibers to shrink axially. The three stages observed for the high-temperature axial stress evolution of the PANCF resulted from the interactions of these four factors. Among these four influencing factors, the effects of thermal expansion and cold shrinkage and non-carbon element removal were significant.
The two main factors existed simultaneously, but changed and interacted with an increase in treatment temperature, which affected the change in carbon-fiber high-temperature axial stress. When the treatment temperature was lower than 1600°C, the axial fiber shrinkage due to the carbon-structure rearrangement from the removal of nitrogen atoms gradually increased as the treatment temperature increased. However, the graphite furnace temperature was low and the structural differences in the fibers that entered and left the graphite furnace were small, so the corresponding differences between the thermal expansion and the cold shrinkage of the fibers were small. Therefore, at this stage, the axial shrinkage from carbon-structure rearrangement after nitrogen atom removal provided the main effect and the axial stress of the fiber continued to increase with an increase in treatment temperature up to 1600°C. When the processing temperature exceeded 1600°C, although the fiber shrinkage continued due to nitrogen atom removal, the structural differences of fibers that entered and left the graphite furnace increased as the treatment temperature increased, and the difference between the effects of thermal expansion and cold shrinkage caused the fiber length to increase gradually. Therefore, at this stage, as the treatment temperature increased, the shrinkage due to the nitrogen atom removal and the relaxation due to the differences between the thermal expansion and cold shrinkage on the fiber length gradually decreased, and the axial stress of the fiber continued to decrease until the two effects canceled each other out at 1950°C. The stress was almost zero and the fibers began to relax. When the treatment temperature exceeded 1950°C, as the treatment temperature continued to increase, the differences between the thermal expansion and cold shrinkage on the fiber length continued to increase due to the fiber entering and exiting the graphite furnace; therefore, the fibers started to relax, which became more pronounced as the treatment temperature increased further.
According to Table 1, compared with PANCF-1, the content of non-carbon elements in PANCF-2 was relatively low and its crystallite structure was relatively regular, so the axial shrinkage from the carbon-structure rearrangement after nitrogen atom removal was weaker for PANCF-2 than for PANCF-1. The structural differences between PANCF-1 and PANCF-2 did not highlight the effect of their different thermal expansion. The structures of the corresponding fibers of PANCF-1 and PANCF-2 at the outlet of the graphite furnace did not differ greatly. Little or almost no difference in cold shrinkage existed between the two fibers. Therefore, the stress of PANCF-2 was always lower than that of PANCF-1 in stages I and II. The graphitic nitrogen removal rate was strongly dependent on the treatment temperature. Therefore, the maximum stress and relaxation temperatures of PANCF-1 and PANCF-2 were similar. However, when the treatment temperature exceeded 1950°C, both samples entered stage III. The difference between the initial structures of PANCF-1 and PANCF-2 was not important compared with the large difference between the dominant thermal expansion and the cold shrinkage. Therefore, both samples began to relax at 1950°C.
The axial stress of the carbon fiber during HTT affected its ability to stretch. The maximum stretching ratios of PANCF-1 at different treatment temperatures are shown in Figure 10. The stretching ratio is defined as the ratio of the stretched length (L) to the original length (L0), that is, L/L0. The maximum stretching ratio was measured in situ. As shown in Figure 1, the speed V1 of Roller1 was fixed and the speed V2 of Roller2 was increased. When the fiber breakage became visible on Roller2, V2 was recorded. The maximum stretching ratio was equal to the ratio of V2 to V1. The maximum stretching ratio of the fibers at each temperature was measured five times and the mean values were used. The change in maximum stretching ratio with temperature was opposite to that of the stress. The maximum stretching ratio decreased initially and then increased, and the minimum was observed at 1600°C. The minimum stretching ratio was observed when the axial stress reached a maximum. When the axial stress disappeared, the maximum stretching ratio of the fiber increased with the treatment temperature.

Maximum stretching ratio of carbon fibers as a function of treatment temperature.
Conclusion
The high-temperature axial stress evolution of the PANCF was divided into three stages: a rapid increasing stage below 1600°C (I), a rapid decreasing stage from 1600°C to 1950°C (II), and a continuous relaxation stage above 1950°C (III). The physical and chemical changes that affect the high-temperature evolution of the axial stress of carbon fibers include axial shrinkage from the carbon-structure rearrangement after the removal of graphitic nitrogen atoms and the difference between the thermal expansion and the cold shrinkage due to fibers that enter and exit the graphite furnace. The two main factors existed simultaneously, but they changed and interacted with an increase in treatment temperature, which affected the change in high-temperature axial stress of the carbon fibers. In stage I, the fiber axial shrinkage from the carbon-structure rearrangement after graphitic nitrogen atom removal was serious and caused the fiber axial stress to increase rapidly with an increase in treatment temperature. In stage II, although cold shrinkage by the removal of nitrogen atoms continued, the effect of thermal expansion and cold shrinkage on the axial elongation of the fiber became increasingly important and induced a rapid decrease in axial stress as the treatment temperature increased. In stage III, the thermal expansion and cold shrinkage on the fiber length became the main effect on the fiber axial stress and caused the carbon fibers to elongate. The fibers started to relax, which became more pronounced as the treatment temperature increased. Carbon fibers with fewer nitrogen atoms had a lower axial stress during HTT, but the trend and characteristic temperature remained unchanged. An increasing treatment temperature initially decreased and then increased the PANCF’s maximum stretching ratio with an opposite trend to that of the axial stress. The minimum stretching ratio was visible at 1600°C. The maximum stretching ratio of the fiber increased with an increase in treatment temperature in stage III.
Footnotes
Declaration of conflicting interests
The author(s) declared no potential conflicts of interest with respect to the research, authorship, and/or publication of this article.
Funding
The author(s) received no financial support for the research, authorship, and/or publication of this article.