
Abstract
The mechanical properties of molded pulp materials are the basis of the structural optimum design of molded pulp products. Therefore, the correlations between Poisson’s ratio and fiber structure, molding process, and thickness were found for materials including wood pulp, bamboo pulp, sugarcane pulp, white mixed pulp, black mixed pulp, recycled corrugated board pulp, and recycled newspaper pulp by the uniaxial tensile test and digital image correlation method. The fiber structures of the selected molded pulp materials were investigated by scanning electron microscopy. The results revealed Poisson’s ratios of wood pulp, bamboo pulp, sugarcane pulp, white mixed pulp, black mixed pulp, recycled corrugated board pulp, and recycled newspaper pulp to be 0.169, 0.108, 0.202, 0.120, 0.166, 0.098, and 0.044, respectively. Microstructural investigation further revealed that Poisson’s ratios of molded pulp materials were related to the fiber structure and drying method. The pulp material dried outside mold under lower pressure and temperature had a smaller Poisson’s ratio, while that dried inside mold under higher pressure and temperature had a larger Poisson’s ratio. The layered phenomenon of the molded pulp materials was also found by scanning electron microscopy images: the outer layer was denser than the inner layer. These results can provide guidance for the numerical simulation analysis and optimal design of molded pulp products.
Keywords
Introduction
As a new type of green packaging materials, molded pulp was widely used in the packaging industry. The molded pulp product can become a substitute for foam plastic cushion by suitable structural design and molding methods. Molded pulp products include a wide range of materials such as wood pulp, sugarcane pulp, bamboo pulp, recycled corrugated pulp, and recycled newspaper pulp.1–3 The performance and application of molded pulp materials have become one of the hot spots in the packaging industry.4,5 Molded pulp was basically a composite material consisting of fibers in a matrix of lignin and hemicellulose. 6 It can absorb shock without transmitting it to the packed items because the shock was dissipated by distortion and crushing at the point of impact. Unlike Expanded Polyethylene (EPE), Expanded Polystyrene (EPS) and other foamed plastics, the cushioning performance of molded pulp product relies on its structure and material properties.7,8 The main failure modes of pulp molding products were cracking and buckling. When buckling failure occurred, the average value of the maximum stress was less than the compression strength of this material. Therefore, it was not very important to know the compression strength precisely. Chu’s 9 investigation revealed that the draft angle and height of the unit structure were the main parameters affecting the bearing capacity of pulp molding. Zhang and colleagues10,11 studied the dynamic cushioning performance of a molded pulp product. Wang et al. 12 tested the compressive properties of molded pulp materials and proposed the constitutive equation. The results showed that the density and loading speed of the material had a significant influence on its elastic modulus and ultimate strength.
FEM modeling and analysis has been widely used in paper-pulp product optimization design,9,13 which provides means to optimize the geometry structure of packaging parts efficiently to meet the design requirements. However, studies on the mechanical properties of molded pulp materials are still scarce. Currently, traditional evaluation criteria based on the ring crush strength and bursting strength of the base paper are mainly used to calculate the performance of corrugated board and corrugated box. Along with the wide application of the numerical analysis technology in packaging structure optimization design, obtaining the elastic modulus and Poisson’s ratio of molded pulp materials has become a prerequisite to determine the accuracy of analysis. 13
In general, a larger Poisson’s ratio corresponds to a larger shear modulus. An accurately calculated Poisson’s ratio can greatly improve the accuracy of finite-element analysis, although it is not the most important factor of materials. To date, only a limited number of studies have been published about Poisson’s ratio of paper-pulp materials. Molded pulp is a thin-walled material with low strength and little transverse deformation during uniaxial tension or compression. The traditional strain measurement methods, such as mechanical method, acoustic method, and electrical method, find it difficult to meet the requirements.14,15 As a noncontact testing method, digital image correlation method (DICM)16–20 and scanning electron microscopy (SEM)21–24 are widely used to test the properties of thin-walled materials.
Molded pulp is a thin-walled material with low strength. The traditional mechanical measurement method may cause additional stiffness, which will affect the accuracy of Poisson’s ratio measurement of molded pulp materials. 25 In this article, three typical molded pulp materials, including raw pulp, mixed pulp, and recycled pulp, were selected to explore Poisson’s ratios. The DICM (a noncontact test method) and the uniaxial tensile test method are used to calculate Poisson’s ratio and stress–strain characteristics of materials. The microstructures of selected materials are determined by SEM. The results suggest that the fiber structural characteristics and molding method of molded pulp materials had a significant influence on their Poisson’s ratio. The research can provide guidance for the production, optimal design, and numerical simulation analysis of molded pulp products.
Materials
Three typical pulp molding materials, including raw pulp, mixed pulp, and recycled pulp, were selected. The beating degree, fines, drying method, drying temperature, and drying pressure of the selected materials are shown in Table 1.
Material parameters.

In Table 1, three types of raw pulp materials are included: pure wood pulp, pure bamboo pulp, and pure sugarcane pulp. These kinds of raw pulp materials were made into large-scale pulp sheets through beating, vacuum filtering molding, and drying processes. They were dried in mold at 105°C and under 2 MPa pressure. The mixed pulp materials, including white mixed pulp with a ratio of long fiber wood pulp to sugarcane pulp of 3:7 and black mixed pulp with a ratio of long fiber wood pulp to short fiber wood pulp of 3:7, were also dried in the mold at a pressure of 2 MPa. The drying pressure of the mixed pulp was the same as that of the raw pulp, while the drying temperature was different, which is also shown in Table 1. The samples of mixed pulp were cut from large-scale pulp sheets through beating, vacuum filtering molding, and drying processes. The recycled pulp materials including recycled corrugated board pulp and recycled newspaper pulp were dried in an oven at 80°C and under atmospheric pressure (0.1 MPa). The samples were also cut from large-scale pulp sheets through beating, vacuum filtering molding, and drying processeses.
Eight 100 mm × 25 mm (long × wide) samples were used for each pulp material in the experiment. The tensile tests were based on ISO 1924-2. Sample types, material thickness, weight, and density are shown in Table 2. Prior to testing, the samples were placed in a constant-temperature and constant-humidity chamber for 24 h (the temperature was 23°C, and the humidity was 50%).
Specimen parameters.

Experimental methods and instruments
Test system
The test system consisted of a universal testing machine GB/T 1040-92-I, a digital camera NK D5300, two light sources, and a computer, as shown in Figure 1. The tensile rate was set to 12 mm/min. The experimental environmental conditions were 23°C and 50% relative humidity.

Composition of test system.
Using the test system shown in Figure 1, the image before deformation (reference image) and the image after deformation (target image) of specimen were obtained. The deformation field information of the specimen was obtained by a correlation analysis between the reference image and the target image, and Poisson’s ratio of the testing material can be calculated. The measured load-deformation curves of the samples can be transformed into stress–strain curves.
Principle of DICM
DICM is a noncontact method to obtain the deformation field of an object based on the gray-level analysis of surface image. The basic principles can be described as follows: First, the undeformed image (reference image) before stretching test and the deformed image (target image) after stretching test were acquired. Second, the reference image and the target image were defined as meshed subregions. Third, the speckles in the subregions were tracked and matched.
As shown in Figure 2, the steps for calculating the deformation field by DICM are as follows: First, a subregion centered at P(x, y) points is selected in the reference image, which is divided into virtual grids; second, using a certain search method, the subregion P’(x, y) in the target image most relevant to subregion P (x, y) in the reference image is searched. Then, the displacement of P (x, y) in x and y directions is determined. The displacement information of the whole field can be obtained by calculating the displacement of each virtual grid node in turn. Poisson’s ratio of the tested material is given by

where Δx and Δy are the deformations in x and y directions, respectively.
The cross-correlation function is defined as a criterion for evaluating the similarity between the reference image subregion and the target image subregion

where

Basic principles of DICM.
Results and analysis
Result of DICM
It can be seen from Figure 3 that deformation of molded pulp is nonuniform. The top displacement was greater than the bottom displacement because the base of the equipment was fixed during the tension test, leading to the small bottom displacement of the sample. The maximum deformation in the x and y directions can be extracted by DICM. Poisson’s ratios of the white mixed pulp can be calculated from equation (1). The digital image processing results of the maximum displacement in the x and y directions and Poisson’s ratio of the white mixed pulp are shown in Table 3.

Deformation field diagrams of specimens: (a) overall deformation of the reference image and the target image of the white mixed pulp. The red points and blue points are the coordinate points of the reference image and the target image, respectively, and the green lines are the displacement of the reference point; (b) local enlargement at the bottom of the specimen; and (c) local enlargement at the top of the specimen.
Deformation parameters of white mixed pulp.

Δx and Δy are the deformations in the x and y directions obtained by DICM, μ is Poisson’s ratio calculated by Δx and Δy, and Δy′ is the deformation in the y direction measured by tensile testing machine.
The stress–strain curves of the eight samples of white mixed pulp are shown in Figure 4. The linear range of the stress–strain behavior of the white mixed pulp is 0–0.01. Therefore, image data with strain of 0.006 (the deformation in the y direction is 0.3 mm, corresponding to Δy and Δy′ in Table 3) were selected as the target image for digital image correlation processing. Furthermore, the displacement results were compared using DICM and the universal testing machine in order to prove the result accuracy of DICM (Table 3). The testing error of the machine was less than 4% by DICM and universal testing, suggesting that the DICM results are reliable. The great advantage of DICM is that the deformation data in both transverse and longitudinal directions can be obtained simultaneously, rather than only the deformation data in tensile direction by tensile test method.

Stress–strain curves of white mixed pulp.
Result of stress–strain
The stress–strain curves of white mixed pulp are shown in Figure 4. The average stress–strain curves of the pulp materials listed in Table 1 are shown in Figure 5. The ultimate strength of sugarcane pulp and white mixed pulp is higher, while the strength of recycled newspaper pulp and corrugated pulp is lower. The reason is that the sugarcane pulp fiber is thin and long and is dried under high pressure, which would make the pulp material to have a dense fiber structure and higher density. The white mixed pulp contains 70% sugarcane pulp fiber drying at a higher temperature and higher pressure, leading to the same density as the sugarcane pulp materials. The recycled newspaper pulp and recycled corrugated pulp are thicker than other materials and are dried outside mold under atmospheric pressure, leading to a loose fiber structure and lower density. The higher density causes greater fiber bonding, which improved the ultimate strength of molded pulp materials. In addition, the recycled pulp materials have less fiber and more fillers, which reduced the ultimate strength. Although pure bamboo pulp, pure wood pulp, and black mixed pulp are also dried under higher pressure and higher temperature, the freeness of bamboo pulp fiber and wood pulp fiber is smaller than that of sugarcane pulp, leading to a smaller fiber binding force. Generally, the results are in agreement with the literature. 10

Stress–strain curves of various pulp.
Result of Poisson’s ratio
Poisson’s ratios of other molded pulp materials are shown in Table 4. The data in Table 4 are obtained at the 0.6% elongation rate, which corresponds to the linear range of the molded pulp materials (Figures 4 and 5). The average Poisson’s ratio of sugarcane pulp is 0.202, which is the largest among all materials (Table 4). Poisson’s ratios of wood pulp, bamboo pulp, white mixed pulp, black mixed pulp, recycled corrugated pulp, and recycled newspaper pulp are 0.169, 0.108, 0.12, 0.166, 0.098, and 0.044, respectively.
Poisson’s ratio parameters of pulp molded materials at 0.6% elongation rate.

The larger material density corresponds to larger Poisson’s ratio (Tables 2 and 4). For example, the densities of wood pulp, bamboo pulp, sugarcane pulp, white mixed pulp, and black mixed pulp are higher than those of recycled newspaper pulp and recycled corrugated pulp, and the corresponding Poisson’s ratio is also larger. The density of recycled newspaper pulp is obviously larger than that of recycled corrugated pulp, so Poisson’s ratio of recycled paper pulp is about twice that of recycled corrugated pulp. This is because the pulp materials dried under higher temperature and higher pressure have a more compact fiber structure. A tighter fiber structure usually leads to a larger Poisson’s ratio and ultimate strength, while a looser fiber structure leads to a smaller Poisson’s ratio and ultimate strength.
Result of SEM
To study the relationship between fiber structure and Poisson’s ratio, the fiber structural characteristics at surface and fracture of the selected materials are observed by SEM (Table 2). The scanning electron microscopic images (SEMI) are shown in Figures 6 to 12.

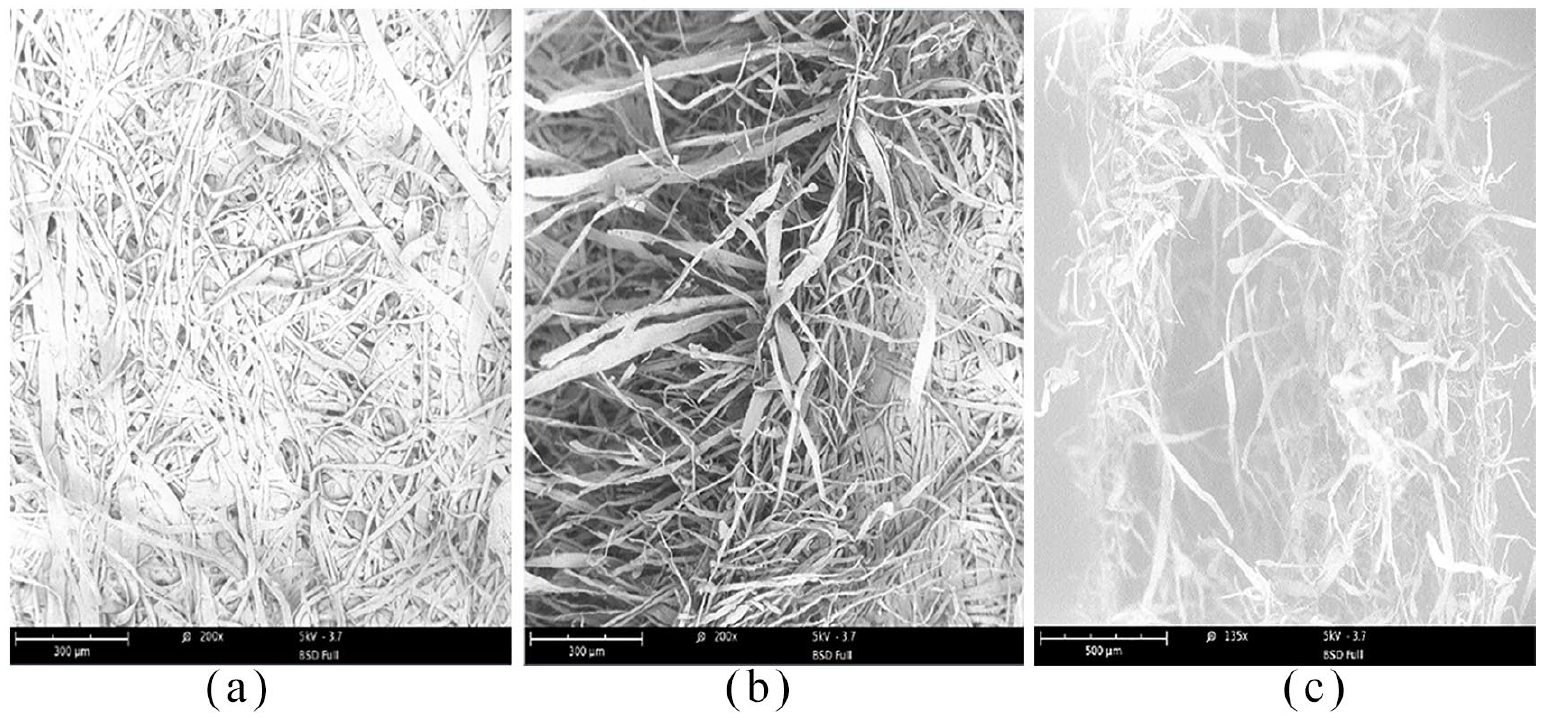
Scanning electron microscopic image (SEMI) of wood pulp: (a) surface micrograph, (b) fracture plane, and (c) fracture cross section.

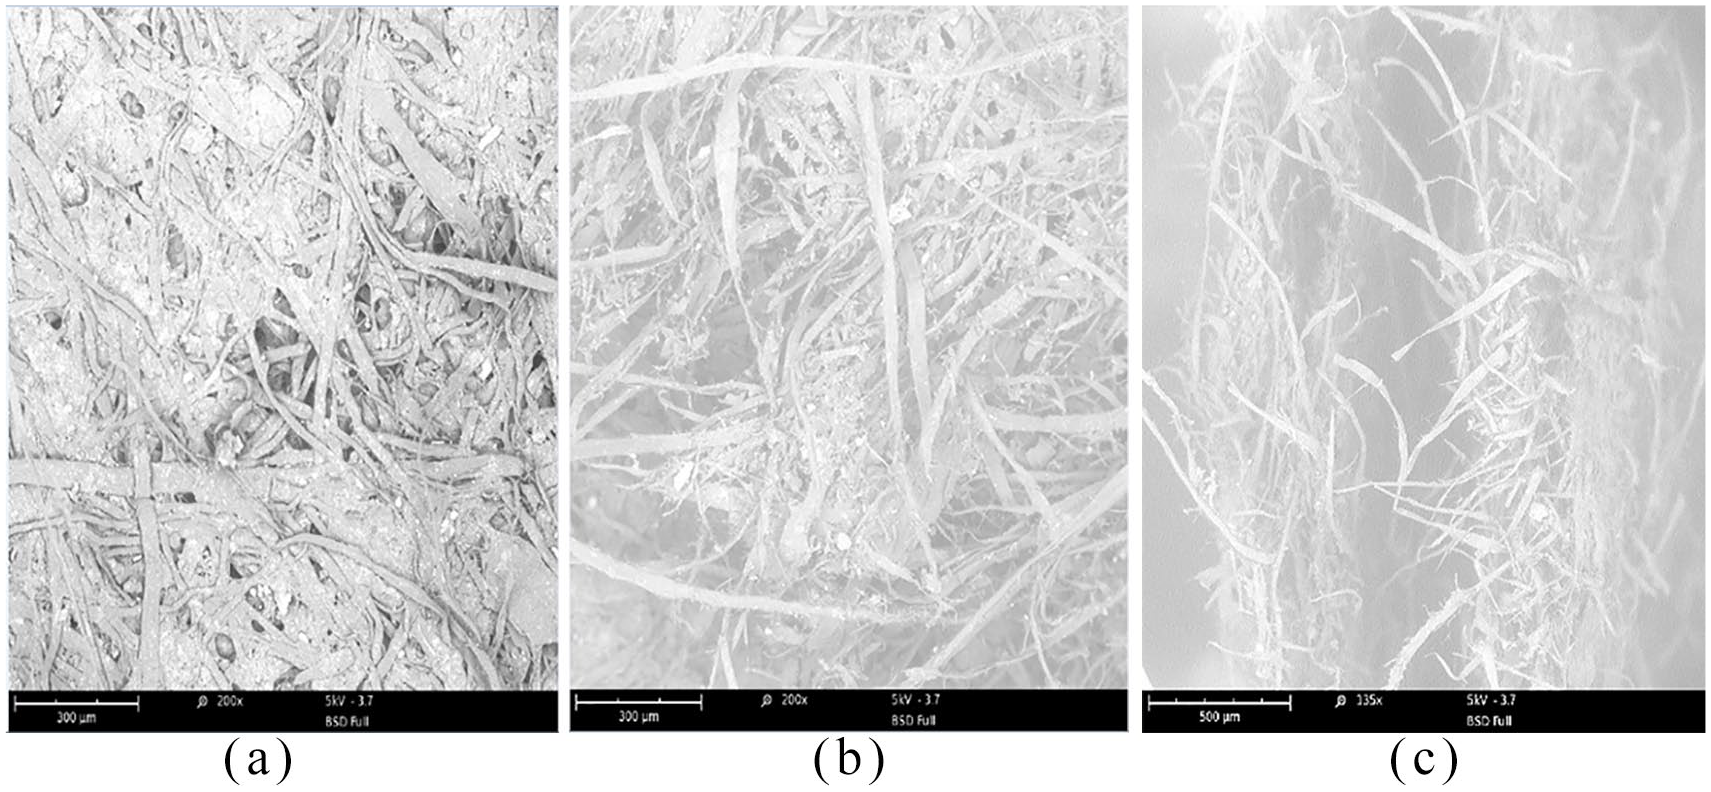
SEMI of bamboo pulp: (a) surface micrograph, (b) fracture plane, and (c) fracture cross section.

SEMI of sugarcane pulp: (a) surface micrograph, (b) fracture plane, and (c) fracture cross section.

SEMI of white mixed pulp: (a) surface micrograph, (b) fracture plane, and (c) fracture cross section.
SEMI of black mixed pulp: (a) surface micrograph, (b) fracture plane, and (c) fracture cross section.

SEMI of recycling corrugated paper pulp: (a) surface micrograph, (b) fracture plane, and (c) fracture cross section.
SEMI of recycling newspaper pulp: (a) surface micrograph, (b) fracture plane, and (c) fracture cross section.
The fiber of pure wood pulp is evenly distributed with less impurities, and there is no obvious stratification at the fracture (Figure 6). The width of wood pulp fiber is uniform and slightly spiral in shape. The fiber width ranges from 50 to 150 μm. The fiber length is generally between 2.56 and 4.08 mm. The length–width ratio of the fiber is less than 70 times.26,27 The fiber characteristics and the drying process (under high temperature and pressure) of pure wood pulp materials produce greater fiber bonding strength.
The bamboo pulp fiber is firm and smooth with a relatively low width–thickness ratio (Figure 7). The fiber is evenly distributed with massive nonfiber cell existing between the fibers. There is stratification at the fracture. The width of bamboo pulp fiber ranges from 10 to 100 μm. The fiber length ranges from 1.33 to 2.22 mm. The fiber length–width ratio is about 100 times. The bamboo pulp fiber has a relatively large wall thickness. These characteristics are consistent with the reported results. 28
The fibers of sugarcane pulp have a flat and straight shape, and there is sheet material between the fibers (Figure 8). The width of sugarcane pulp fiber ranges from 20 to 100 μm, which is smaller than wood pulp fiber and larger than bamboo pulp fiber. Sugarcane pulp fiber also has a large width–thickness ratio. Zhu et al. 27 show that the length of sugarcane pulp fiber is generally in the range of 1.01–1.6 mm, and the length–width ratio is generally about 70 times. The sugarcane pulp materials are divided into two layers at the fracture.
Manfred and Du 29 show that the secondary wall of the wood fiber has a reticular structure, while the microfibrils of bamboo fibers are arranged in parallel layers. The contact surface of flat and reticulated fibers is larger when they are interlaced, and the contact surface of cylindrical and layered fibers is smaller when they are interlaced. This may be one of the reasons for the smaller Poisson’s ratio of bamboo pulp. Li and Kim 30 show that the width–thickness ratio of bamboo fiber is about 2.44 times, and the ratio of cell wall to cavity is about 6.6 times. The width–thickness ratio of wood pulp fiber ranges from 5.04 to 9.1 times, and the ratio of cell wall to cavity is in the range of 0.28–1 times. The ratio of cell wall to cavity of sugarcane pulp ranges from 0.36 to 0.86 times. 26 Generally, a larger ratio of cell wall to cavity and fiber hardness results in a smaller fiber contact area and smaller binding force during paper forming. Therefore, Poisson’s ratio of bamboo pulp is smaller than that of wood pulp and sugarcane pulp.
Figure 9 indicates that the fiber shape of white mixed pulp material has the characteristics of wood pulp and sugarcane pulp, and the fracture surface is obviously divided into two layers. The width of the fiber ranges from 20 to 150 μm. The delamination of white pulp is similar to that of sugarcane pulp. This is probably because the white mixed pulp material is made of 70% sugarcane pulp fiber and 30% long wood pulp fiber. The addition of wood pulp fiber reduced the delamination of materials.
There are two kinds of fibers in black mixed pulp materials, and the width of a large-scale fiber is about four to five times that of a small-scale fiber (Figure 10). The width of fiber ranges from 20 to 150 μm. There is obvious delamination in the fracture of black mixed pulp material. According to section “Materials” of this article, the black mixed pulp material is composed of 30% long fiber wood pulp and 70% short fiber wood pulp. Compared with the results in Figure 7, it can be concluded that the addition of short wood fiber worsens the delamination.
The recycled corrugated pulp material and recycled newspaper pulp material have looser fiber structures and fewer fibers with many fillers between the fibers and many voids (Figures 11 and 12). The fiber size is close to that of black mixed pulp material. These two recycled pulp materials show a significant stratification phenomenon at the fracture. From Table 1, these two materials are dried outside mold at a low pressure and low temperature, which led to a larger thickness, smaller density, and loose tissue structure. Poisson’s ratio of the two materials is relatively smaller than other materials dried in mold at a relatively high pressure or high temperature.
Conclusion
In this article, Poisson’s ratio and stress–strain curve of various molded pulp materials are measured by DICM and uniaxial tensile test method. The fiber structure of the selected molded pulp materials is observed by SEM. Based on the experimental results, the following conclusions can be drawn:
The deformation errors measured by DICM and the universal testing machine were less than 4%, which can prove the accuracy of DICM to determine the deformation of molded pulp materials.
The type of molded pulp is an important factor in the performance of the material. In addition to wood pulp, there are different degrees of delamination at tensile fracture of other molded pulp materials. Poisson’s ratios of wood pulp, bamboo pulp, sugarcane pulp, white mixed pulp, black mixed pulp, recycled corrugated pulp, and recycled newspaper pulp are 0.169, 0.108, 0.202, 0.120, 0.166, 0.098, and 0.044, respectively.
Production process is one of the key factors affecting the performance of molded pulp materials. The pulp materials made by traditional drying method under higher pressure and higher temperature usually have larger ultimate strength and Poisson’s ratio. The pulp materials produced by an external drying method, such as recycled corrugated pulp and recycled newspaper pulp, have a smaller ultimate strength and Poisson’s ratio.
Footnotes
Declaration of conflicting interests
The author(s) declared no potential conflicts of interest with respect to the research, authorship, and/or publication of this article.
Funding
The author(s) disclosed receipt of the following financial support for the research, authorship, and/or publication of this article: This research was financially supported by the Green Packaging and Safety Special Fund of China Packaging Federation under the grants 2017ZBLY09; the Natural Science Foundation of Hunan Province under the grants 2018JJ3113; and the Excellent Youth Foundation of Hunan Province Education Department under the grants 18B295.