
Abstract
The conductivity of textile fabrics is not only relevant for highly conductive textile materials, which can be prepared by coatings with fine metal layers or conductive polymers, but it is also of large interest in antistatic or other textiles which necessitate relatively low conductivities. These high resistances are usually in a range of gigaohms to teraohms which is not accessible by common multimeters, but necessitates special teraohmmeters. Although these measurement instruments are not unusual in the textile industry, their applications necessitate knowledge of the measurement principle and especially of the influence of environmental conditions on the measurement results. Here, temperature- and humidity-dependent measurements for temperatures of 20°C/23°C/27°C and relative humidities of 50%/65% with a teraohmmeter on different textile fabrics are shown. The results show not only the strong impact of the environmental conditions, resulting in resistance deviations of more than one order of magnitude, but also give hints on how these environmental conditions can be stabilized to a large amount to enable reliable comparison between different textile materials.
Introduction
Antistatic properties belong to the not often investigated, but nevertheless, more and more important functionalities of textile materials. Electrically insulating textiles can accumulate electrostatic charges on their surfaces and thus make handling of the fibers, yarns or fabrics more complicated, but can also result in destroyed electrical equipment when such garments or their wearers get in contact with sensitive electronics. Even small electrostatic discharges which would not be recognized by a human could destroy a board with microscopically small components since the latter are not designed for such relatively small energies which are nevertheless much too large for sensitive modern electronic devices.
Antistatic agents were already discussed decades ago. Henshall 1 reported on antistatic agents used to increase the electrical conductivity of textile fibers by hydrophilic groups adhering to the fibers. Wilson 2 defined the surface resistivity as the best and most simply measurable property of antistatic textile fabrics. Steiger 3 investigated different antistatic finishings and suggested a double-logarithmic relation between the charge on a sample and the surface resistivity. Proffitt and Patterson 4 discussed oleochemical surfactants and lubricants with antistatic properties, while Grady and Hersh 5 suggested internal antistatic agents in different nylon fibers to increase their electrical conductivity.
More recently, Aileni et al. 6 investigated the influence of metal microparticles printed on a textile surface on the conductivity and found values in the range of 109–1011 Ω for the original samples and surface resistances between 23 and 7 × 10⁵ Ω for the best coating, as measured with a resistance measurement set which can be applied up to 1014 Ω, usually also called a teraohmmeter. Hassan and Koyama 7 found a surface resistance of 1.2 × 10¹² Ω/cm for untreated acrylic yarn, while this value was decreased by more than two orders of magnitude by a silver nanoparticle coating. Pramanik et al. 8 reduced the sheet resistance from 107 Ω to less than 104 Ω by adding multiwall carbon nanotubes in the polymerization of hyperbranched poly(ester amide).
Such high sheet or volume resistances are usually measured with a teraohmmeter. Interestingly, only few papers discuss this measurement and its prerequisites or mention the standard according to which the measurements are performed. The German standard DIN 54345 9 gives one definition of these prerequisites: The measurements of the electrical resistances of textile fabrics shall be performed in a climate chamber at a temperature of (23 ± 1)°C and a relative humidity of (25 ± 2)%. Other standardized climates are defined in EN ISO 139, 10 especially the standard atmosphere with a temperature of (20 ± 2)°C and a relative humidity of (65 ± 4)% as well as the standard alternative atmosphere, defined by a temperature of (23 ± 2)°C and a relative humidity of (50 ± 4)%. Both standards, thus, indicate strongly differing measurement conditions. This means that it cannot be excluded that common textile testing laboratories, working in the usual standard atmosphere, perform tests with a teraohmmeter in a completely different atmosphere than laboratories owning a special climate chamber which is able to reach the atmosphere defined in DIN 54345.
Here, the influence of different climates on teraohmmeter measurements of sheet resistances of various textile fabrics is investigated and suggestions are given how to reduce this problem to a certain degree when measuring outside a climate chamber.
Materials and methods
Measurements of the sheet resistance were performed with a teraohmmeter TO-3 (H.-P. Fischer Elektronik GmbH & Co. Industrie- und Labortechnik KG, Mittelwalde, Germany) which can measure resistances from 103 to 1015 Ω. Equipped with the electrode TE-50 according to DIN 54345-1, DIN EN 1149-1, and DIN EN 1149-2, it is well suited to investigate the resistance of textile fabrics without a textile coating or finishing.
Some of the measurements were performed in a climate chamber 125SB/+10JU/40DU (Weiss Umwelttechnik GmbH, Reiskirchen, Germany). Measurements were performed according to DIN 54345-1 at a temperature of 23°C and a relative humidity of 30% since a humidity of 25% could not be reached in the climate chamber for the desired temperature. Samples were either conditioned for 24 h inside the chamber before measurements or measured without conditioning. Measurements were usually taken for 60 min. Additional measurements were taken according to EN ISO 139 at a temperature of 20°C/23°C/27°C with a relative humidity of 50%/65%/50%. Long-term measurements were taken under different conditions.
To stabilize measurements in a common laboratory environment, a box was built from 6 mm cardboard with a transparent plastic sheave of thickness 3 mm in the top cover. It was equipped with a digital humidity and temperature sensor DHT21 AM2301 which has a temperature accuracy of ±0.5°C and a humidity accuracy of ± 3% (Eckstein GmbH, Clausthal-Zellerfeld, Germany). Measurements were taken with an Arduino Uno with Data Logger Shield (Eckstein GmbH). For programming the data logging function, Visual Studio 2017 (C#) was used.
The textile fabrics under investigation were cotton, wool, linen, nylon, polyester fabrics, and polyacrylonitrile (PAN) nanofiber mats 11 as well as poly(ethylene oxide) (PEO) prepared with different salts (NaCl, KBr, and KCl) in the spinning solution to modify their conductivity. 12 Table 1 gives thicknesses and areal weights of the samples under investigation. Values given for the nanofiber mats cannot be given with higher accuracy due to the very thin fabrics which could hardly be detached from the polypropylene substrates on which they were produced (and on which they were measured). A broad range of textile fabrics, including different materials and different fabric structures, was chosen for this first time-dependent teraohmmeter measurement series to give an overview on possible effect, caused by diverse materials, fabric thicknesses, porosities, and surface morphologies.
Textiles under examination.

PAN: polyacrylonitrile; PEO: poly(ethylene oxide).
Results and discussion
Measurements inside the climate chamber, taken on the cotton fabric under different temperatures and humidity conditions, are depicted in Figure 1.
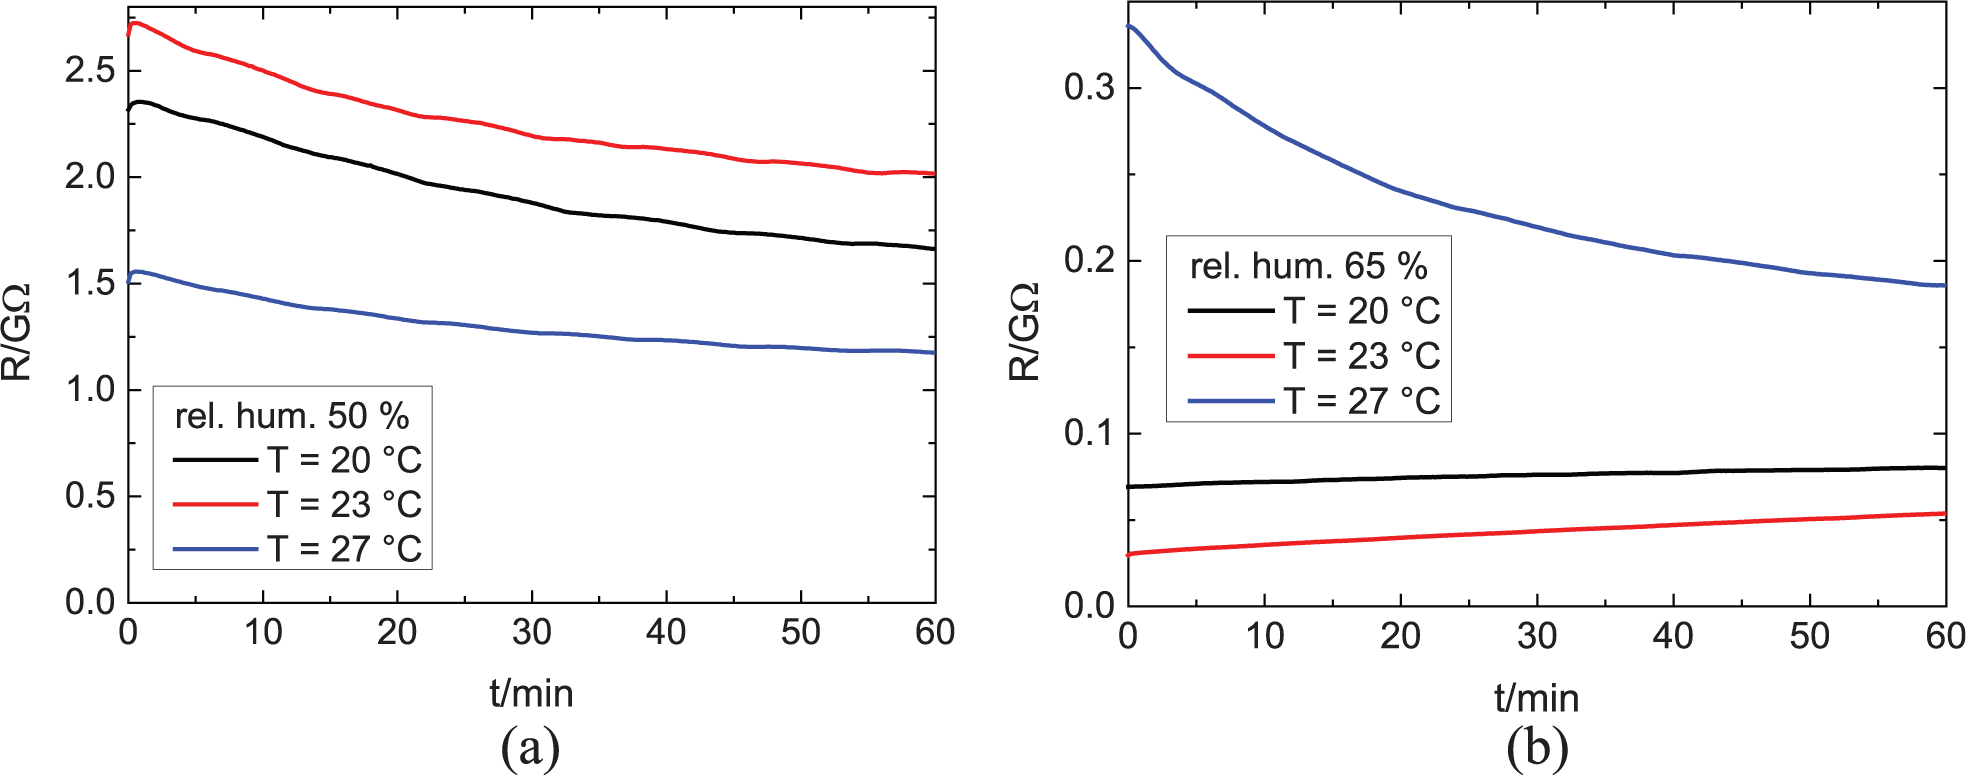
Time-dependent sheet resistance of a cotton fabric, measured with a constant voltage of 10 V in the climate chamber under different temperatures, applying a relative humidity of (a) 50% or (b) 65%.
First, the influence of the relative humidity is clearly visible. It is well-known that cotton can contain a large amount of humidity which influences the conductivity of the fabric; 13 thus it is obvious that for the lower humidity (Figure 1(a)), a larger sheet resistance can be expected.
Second, there is also a strong influence of the temperature, which may partly be attributed to the humidity again. For the temperatures under investigation here, the saturated amounts of water are 17.2848 g/m³ (20°C), 20.5596 g/m³ (23°C), and 25.7477 g/m³ (27°C), respectively. 14 This means that a relative humidity of, for example, 50% defines an approximately 25.7477/17.2848 = 1.49 times higher absolute humidity at 27°C than at 20°C. This again leads to the expectation that at 27°C, the sheet resistance should be significantly lower than at 20°C for identical relative humidity—which is the case for the relative humidity of 50%, but exactly opposite for the higher relative humidity of 65%.
Unexpectedly, while there are several papers reporting on making cotton conductive with different coatings or finishings, there are nearly no studies on these effects in the basic textile material. Cerovic et al. 15 investigated the influence of the volume resistivity of cotton, polyethyleneterephtalate (PET), and mixed material woven fabrics under different chamber humidities and found an increase by approximately a factor of 1.5–2 by changing the relative humidity from 60% to 45%, while the value was increased by a factor of 2–3 for PET. The temperature dependence was not tested here. Sengupta et al. 16 investigated the effect of temperature on the specific resistance of different samples from cotton, cotton/PET, jute, polypropylene, PET, and so on at a constant relative humidity of 65%. They found a decrease of the specific resistance for temperatures increasing from 30°C to 65°C, as could have been expected according to the aforementioned considerations. Cui et al. 17 pointed out the influence of moisture absorption on the surface temperature of cotton and polyester fabrics. They found decreasing fabric temperature and resistance with increasing moisture content. It should be mentioned that this experiment was performed in a different way than here, that is, by investigating the conditioning process, not fully conditioned samples.
Apparently, here the measurement process itself influences the measurement results. While this is obvious for the beginning of a measurement where the applied high voltage, typically of 100 V, will interact with the humidity in the sample, these long-term effects were not expected. Especially the modification of the temperature dependence due to a modified relative humidity is unexpected and cannot be explained by the physical effects reported in previous literature. Apparently, a full two-dimensional (2D) map correlating temperature and relative humidity is necessary to investigate these effects more in detail. Here, however, the physical reasons for these effects are not in the focus of the investigations, but will be studied more in detail in future experiments.
The importance of conditioning is visible in Figure 2. Here, the sample was stored at higher temperature and lower relative humidity (i.e. in the non-air-conditioned laboratory in summer) for 24h before inserting it into the climate chamber which was hold at a temperature of 23°C and a relative humidity of 65%. The initial decrease of the sheet resistance by approx. one order of magnitude happens mostly during the first 2h, while after 14–16h, the values become relatively stable. This finding suggests conditioning the samples not only by inserting them into the climate chamber before measurements but also possibly by already starting the measurement to apply the measurement voltage during conditioning and in this way to reach a really stable, static condition for the measurement.

Sheet resistance of a cotton fabric, measured with a constant voltage of 10 V for more than 17 h in a climate chamber at 23°C and 65% relative humidity without conditioning.
It must be mentioned that this result shows even more clearly than the ones depicted in Figure 1 that the common industrial practice of “waiting for 10 min and then taking the measurement value” is insufficient for a reliable comparison between different fabrics, investigated in different laboratories.
Next, Figure 3 depicts measurements performed on a wool fabric. Although the absolute values are approx. two orders of magnitude higher than for the cotton fabric (Figure 1) and the influence of the relative humidity is again visible, the measurements at a relative humidity of 50% (Figure 3(a)) show an unexpected increase of the sheet resistance with the temperature, as opposed to the idea that a higher temperature at identical relative humidity corresponds to a higher absolute humidity and thus to a lower sheet resistance.
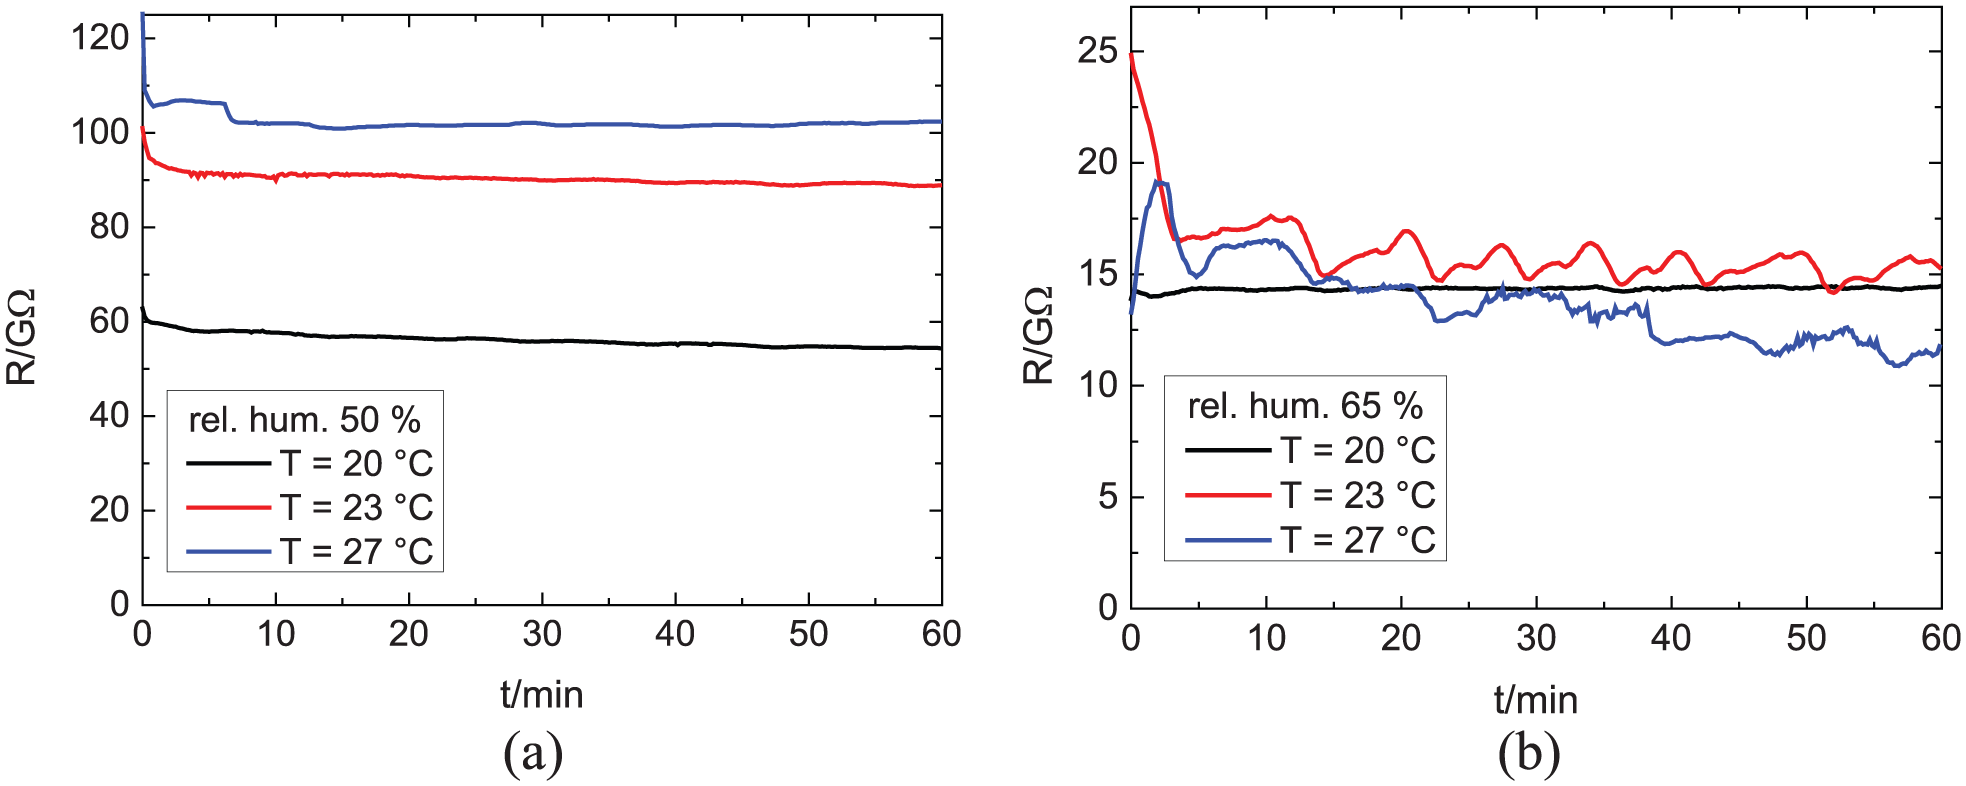
Time-dependent sheet resistance of a wool fabric, measured with a constant voltage of 10 V in the climate chamber under different temperatures, applying a relative humidity of (a) 50% or (b) 65%.
Even more unexpected is the result depicted in Figure 3(b) for a relative humidity of 65%. Here, the measurements at higher temperatures do not show relatively linear increasing or decreasing curves, as seen before, but regular oscillations. This behavior has not yet been reported in the scientific literature and also needs deeper investigation and modeling to find an explanation. It must be mentioned that the measurement voltage of 10 V remained constant throughout the measurement duration and thus cannot trigger these oscillations.
For the scope of the recent study, however, it is more important to state that this oscillation changes the measured sheet resistance values even on relatively short time scales of some minutes, making reliable measurements even more problematic.
For linen, Figure 4 shows again constantly increasing or decreasing sheet resistance curves without oscillations, besides a small peak during the first minutes which indicates the necessity to wait some minutes after starting the measurement until a value can be taken. However, especially for the highest temperature, for both relative humidities a strong decrease of the sheet resistance during the first hour of measurement is visible, underlining that even waiting for an hour until a value is taken is not sufficiently reliable.

Time-dependent sheet resistance of a linen fabric, measured with a constant voltage of 10 V in the climate chamber under different temperatures, applying a relative humidity of (a) 50% or (b) 65%.
The long-term test of a linen fabric without conditioning the sample before measurement is depicted in Figure 5.

Sheet resistance of a linen fabric, measured with a constant voltage of 10 V for more than 16 h in a climate chamber at 25°C and 50% relative humidity without conditioning.
This time, the climate chamber was adjusted to values nearer to the laboratory atmosphere as in case of the cotton fabric (Figure 2). However, there is again a decrease in sheet resistance by approximately one order of magnitude visible. Values become relatively constant after half a day, again suggesting starting measurements directly with the start of conditioning the sample.
The time-dependent sheet resistance of the nylon sample was measured with a constant voltage of 100 V which was necessary due to the much higher sheet resistance values, as visible in Figure 6. Here, all measurements show the irregular oscillations which were already visible in Figure 3 for the wool measurements at a relative humidity of 65%. Besides, while the temperature dependence for a relative humidity of 50% behaves like expected, that is, the sheet resistance decreases with increasing temperature, this is again different for the highest temperature and humidity (Figure 6(b)). The oscillations visible here can also be found in the long-term measurement (not shown).
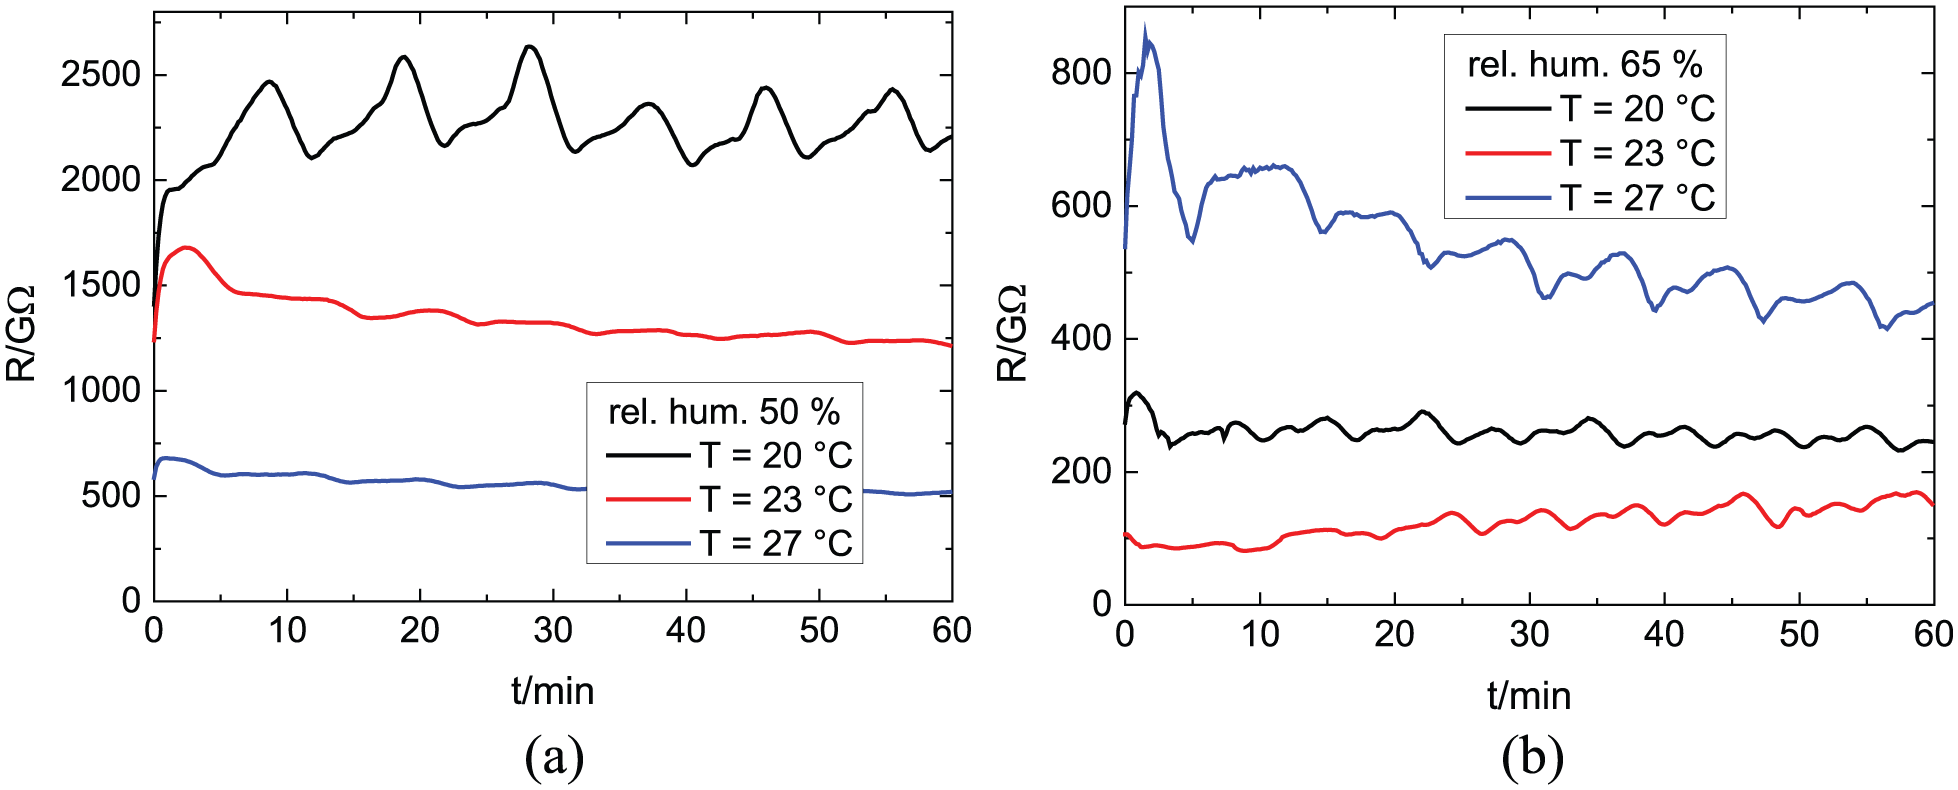
Time-dependent sheet resistance of a nylon fabric, measured with a constant voltage of 100 V in the climate chamber under different temperatures, applying a relative humidity of (a) 50% or (b) 65%.
The sheet resistances of the polyester fabric were in the same order of magnitude as the values found for the nylon fabric and thus had to be measured with 100 V again. Although for a relative humidity of 50%, temperature dependence is again as expected (Figure 7(a)), similar to the measurement on nylon (Figure 6(a)), the two lower temperature show nearly no difference in the measurements at the higher relative humidity of 65%. In addition, most curves show again irregular oscillations. It must be mentioned that this is not a feature only visible in measurements with the higher voltage of 100 V, but such oscillations were already visible for measurements on wool, performed with a voltage of 10 V, and resulting in much lower sheet resistances around 10–20 GΩ.

Time-dependent sheet resistance of a polyester fabric, measured with a constant voltage of 100 V in the climate chamber under different temperatures, applying a relative humidity of (a) 50% or (b) 65%.
This finding is supported by the results of sheet resistance measurements on pure PAN nanofiber mats, as depicted in Figure 8. Here, for the first time, values in the range of 3–60 MΩ were measured which can also be taken with common multimeters (at least up to values around 20–40 MΩ, depending on the model). Nevertheless, the strong irregular oscillations are again visible, clearly indicating that this effect does not only occur for very high sheet resistances.

Time-dependent sheet resistance of a PAN nanofiber mat, measured with a constant voltage of 10 V in the climate chamber under different temperatures, applying a relative humidity of (a) 50% or (b) 65%.
This finding suggests that normal four-point measurements, as usually applied on textile fabrics, should also be investigated over longer durations to find out whether this oscillating behavior can also occur in case of common four-point measurements.
Figure 9 depicts a long-term measurement of another nanofiber mat, a PEO sample with NaCl added to the spinning solution. 12 Similar to the PAN nanofiber mats (Figure 8), here again oscillations are visible after the conditioning which is relatively fast here, that is, within approximately an hour, most probably due to the very thin nanofiber mat.

Sheet resistance of a PEO nanofiber mat with 1 g NaCl in the spinning solution, measured with a constant voltage of 10 V for more than 6 h in a climate chamber without prior conditioning.
Finally, for comparison of PEO nanofiber mats with different salts, measurements were taken in the self-built box. It must be mentioned that opposite to the climate chamber, here, only measuring temperature and relative humidity are possible, not controlling these values.
Although more problematic curves due to this missing control functionality could have been expected, Figure 10 shows the opposite—here all time-dependent curves show no oscillations at all. This finding underlines that the previously visible oscillations stem from temperature and/or humidity regulations in the climate chamber. Although measurements were performed according to the standards or at different temperatures and relative humidities, and can be expected to be relatively constant inside a climate chamber, sometimes strong oscillations of up to 50% (polyester at 23°C and 65% relative humidity) were visible and in many cases significantly varied the measured sheet resistances.

Sheet resistances of PEO nanofiber mats with different amounts of different salts in the spinning solution, measured with a constant voltage of 10 V in the self-built box.
This finding is underlined by the fact that all other fabrics were also measured inside the box. While lifting the box always resulted in clearly visible abrupt modifications of the sheet resistance for the other fabrics and a slow drift of relative humidity and temperature was always visible, resulting in a drift of the measured sheet resistance values on corresponding time scales, measurements within reasonable times (approx. 10–20 min) were always possible. This means that in case of a planned comparison of different samples, as depicted in Figure 10, it may in many cases lead to more reliable results if measurements are performed, for example, 15 min each inside a box, allowing the sample under examination to stabilize, without too large deviations of relative humidity and temperature inside the laboratory and thus inside the box (which can only block short-term deviations of these values).
One possibility to increase this setup is building kind of glove-box with usual air inside, but allowing for changing samples under investigation inside the box without having to open it. Another possibility may be the integration of the box in the climate chamber, the latter stabilizing temperature and relative humidity on large scales, while the first levels out the short-term changes in these values. Both setups will be tested in the near future.
Conclusion
Sheet resistance measurements with a teraohmmeter were performed on different textile fabrics. Even under constant atmospheric conditions in a climate chamber, varying values were found, indicating that conditioning the samples should be performed while the measurement voltage is already applied. The obvious expectation that larger absolute humidity due to higher temperature and identical relative humidity should result in smaller sheet resistance values was not always fulfilled.
Unexpectedly, even the small variations of temperature and relative humidity in the climate chamber—both within the requirements of the standards DIN 54345-1 and EN ISO 139 according to which the measurements were performed—were in several samples strongly visible in the form of oscillations of the sheet resistance. Generally, cotton and linen showed relatively smooth time dependencies in the order of magnitude of 1 GΩ for a relative humidity of 50% and one order of magnitude lower for a relative humidity of 65%. Nylon, polyester, and the nanofiber mats under investigation showed strongly oscillating curves instead, with the largest values of 1–2 × 10³ GΩ reached for nylon and polyester. Wool shows relatively smooth curves for the lower relative humidity and oscillations for the higher one, with the sheet resistances also being between the aforementioned values and reaching the order of magnitude of 100 GΩ for the lower humidity and one order of magnitude smaller values for the higher relative humidity.
These findings suggest future investigations with a more sophisticated (uncontrolled) box in the normal lab environment and carefully measuring environmental conditions and/or using an additional box inside the climate chamber to level out short-term modifications of temperature and relative humidity. These tests will help finding the reasons for the aforementioned unexpected temperature dependence of some samples.
Footnotes
Declaration of conflicting interests
The author(s) declared no potential conflicts of interest with respect to the research, authorship, and/or publication of this article.
Funding
The authors disclosed receipt of the following financial support for the research, authorship, and/or publication of this article: The APC is funded by the Open Access Publication Fund of Bielefeld University of Applied Sciences and the Deutsche Forschungsgemeinschaft (DFG, German Research Foundation) - 414001623.