
Abstract
To reduce yarn breakage rates in spinning and increase production efficiency, we developed a detection device for spinning tension of the ring-spinning system by implementing the stress and displacement sensors with the yarn guide plate. The as-developed device receives data through signal acquisition system, and then the yarn tension at the thread guide and the displacement of the guide plate are obtained by solving the coupled physical-mathematical equations describing yarn tensions in twisting, ballooning, and winding processes, which gives the real-time dynamics. We found that the yarn tensions show periodical fluctuations along with the reciprocating movement of the yarn guide plate. In particular, the maximum tension at the initial winding stage has increased 12.6% when compared to the second winding stage, while the maximum tension at the third winding stage has increased 10.6% when compared to the second winding stage.
Introduction
Ring spinning is the process of forming yarns through drafting, twisting, ballooning, and winding of rovings. The attenuated rovings from the front roller pass through a thread guide and onto the bobbin that is fixed on the spindle. Due to high-speed spindle rotation, the rovings are twisted to form a twisting zone between the jaw of the front roller and the yarn guide plate. The high-speed spindle rotation drives the traveler to rotate along the ring, which compels strand of fibers to rotate at high speed, forming a yarn-ballooning between the thread guide and the traveler due to centrifugal force. Afterward, the yarn winds up onto the bobbin, which is controlled by the up and down ring rail motion and the difference in rotation velocities between the traveler and spindle, forming the winding zone between the ring rail and the bobbin.
The knowledge of yarn tensions during twisting, ballooning, and winding is the key to control the yarn breakage rate of spinning. In particular, the yarn tensions associated with the formation of yarn-ballooning provides insight into the structure and properties of ring-spun yarn, which helps to improve the quality and production efficiency of ring spinning. Chen 1 studied the spinning dynamics and derived a mathematical equation describing the formation of yarn-ballooning. Zhan and Zhong2,3 and Zhan 4 built a mathematical model describing the formation of duel balloonings to study the tension dynamics. Batra provided the numerical solution of the mathematical model that is capable of describing quasi-steady-state of yarn-ballooning.5,6 Fraser considered the region of traveler that is passed through by yarn as a boundary condition of free yarn-ballooning and discussed the relationship between quality of traveler and yarn tensions at yarn guide plate.7,8
In addition to theoretical works, experimental measurement of yarn tensions in the spinning process, including twisting, ballooning, and winding, reveals important information regarding the fiber configurations in the formation of yarn, advancing our understanding of the mechanism of yarn breakage in ring spinning. In general, the tension test includes a contact measurement method and a non-contact measurement method.9–11 For the contact measurement method,12–14 the running length of yarn interacts with an external device that is in conjunction with the ring frame, which measures the resulting impacts due to the interaction between yarn and device, for example, torque, mechanical power, force, or work. However, the interaction between yarn and device brings in additional friction forces, which changes the yarn trajectory in ring spinning. For the non-contact measurement method, there are mainly two approaches, which are optoelectronic type15,16 and electromagnetic type.17,18 For both types, a detector monitors the movement of the traveler, which provides the real-time dynamics of yarn tensions after processing the electronic signals with an A/D converter. However, it fails to detect the yarn breakage for the spun yarn that is formed through multi-channel drafting,19–21 which consists of at least two rovings. The breakage of one roving cannot be picked up by the sensor. In addition, the current non-contact methods are unable to detect the dynamics of yarn tensions in the whole spinning process.
In the present work, we use a self-developed device to measure the yarn tensions during ring spinning, in which the sensors are in conjunction with the guide plate to measure the stress of yarn and the displacement of the guide plate, respectively. The coupled physical-mathematical equations, which describe the evolution of the tensions associated with different spinning processes, that is, twisting, ballooning, and winding, are solved to obtain real-time tension dynamics. We found the occurrence of yarn breakage is associated not only with yarn path but also with time periods during ring spinning. Therefore, the detection of yarn tension, especially regarding its pattern and variation in various regions of yarn path and at different time periods, is greatly helpful for developing an early warning system to prevent yarn breakage.
Theoretical model
To establish the coupled physical-mathematical equation, we adopt the general assumption that the direction of air-drag force acting on the yarn is normal to the yarn.22,23 In addition, we do not take into account the influence of temperature and humidity of the environment on the balloon shape, since the evidence shows that these factors have a negligible effect on balloon shape. 22
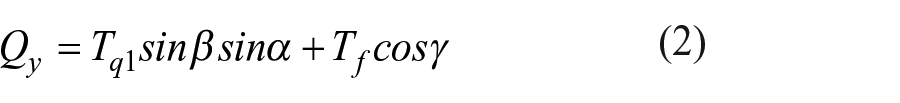
The bidirectional stress and displacement sensors are in conjunction with the guide plate to detect the tension and displacement of the guide plate, as shown in Figure 1. The region from the jaw of front roller A to the thread guide O is associated with twisting of rovings, where the tension of roving is denoted as upstream tension Tf. The region from the thread guide O to the traveler C is associated with yarn-ballooning, where the yarn tensions at the top and the bottom of ballooning are denoted as top ballooning tension Tq1 and bottom ballooning tension Tq2, respectively. The region from the traveler C to the winding point on bobbin D is associated with the winding of yarn, where the yarn tension is denoted as winding tension Tω. B refers to the bidirectional stress sensor and the displacement sensor attached to the guide plate.

(a) and (b) show schematic diagrams illustrating the detection system for spinning tensions and the structure of the sensor, respectively.
As shown in Figure 2, the signal acquisition system consists of a stress sensor, displacement sensor, A/D signal converter, programmable logic controller (PLC), and touch screen. In the process of spinning, the stress and displacement sensors at the guide plate generate signals magnified by an amplifier, which are converted into digital numbers representing the magnitudes of stress and displacement via an A/D converter. Subsequently, the digital numbers are displayed on the touch screen through the PLC control system. The touch screen can display all input and output data. 24

Signal acquisition system.
The attenuated roving goes through twisting, ballooning, and winding processes during ring spinning; therefore, it requires an exact knowledge of the tension dynamics in the three processes to control the yarn breakage.
Figure 3 shows the diagram illustrating the tensions at the thread guide. The center of the thread guide is denoted as O. X-axis, Y-axis, and Z-axis pass through point O, in which X-axis is parallel to the plane that holds the guide plate; Y-axis is perpendicular to the plane that holds the guide plate; Z-axis is perpendicular to X-O-Y plane. Therefore, a three-dimensional coordinate system is built with the center of the thread guide as the origin. Similarly, the X′-Y′-Z three-dimensional coordinate system is built for the ring rail where O′ is set as the center of ring rail. Both the upstream and downstream yarn tensions generate the stress signals via the stress sensor. The stresses Qy and Qz can be measured through the bidirectional stress sensor. In addition, the perpendicular displacement of the guide plate can be measured through a displacement sensor installed on the guide plate.

Stress analysis of (a) thread guide and (b) traveler.
According to Figure 3


where γ is denoted as the guide angle (°) between the attenuated roving and the X-axis; β is denoted as the top ballooning angle (°) between the tangent line to the top of yarn-ballooning and the Z-axis; α is the angle between the Y′-axis and the line passing to an arbitrary point in X’-Y’ plane, (°).
Stress analysis of the twisting region
According to Euler’s formula 25

Substituting equation (4) into equation (3), the upstream tension Tf can be written as
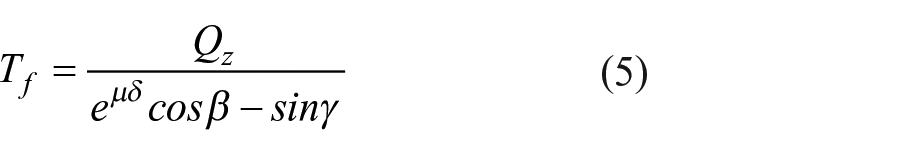
where μ refers to the dynamic friction coefficient between the yarn and the thread guide; δ refers to the wrap angle of the yarn around the thread guide, as shown in Figure 4. De Barr 26 found that, for the cotton yarn, μ is chosen to be 0.25. For the cotton/polyester blended yarn used in this study, the polyester staple fiber is longer and finer than the cotton fiber. Therefore, the cotton fiber tends to distribute on the surface of cotton/polyester blended yarn while polyester staple fiber tends to congregate near the core of the spun yarn. In addition, the blending ratio between cotton and polyester staples is 70:30 in the cotton/polyester blended yarn used in this study. Therefore, this means the friction properties of cotton/polyester blended yarn are dominated by the cotton fibers. As such, we can use the dynamic coefficient of friction of cotton yarn as the dynamic coefficient of friction of cotton/polymer blended yarn.

Schematic diagram illustrating the movement of roving across the thread guide.
Stress analysis of the yarn-ballooning region
Substituting equation (4) into equation (3), the top ballooning tension can be written as

According to Tang, 27 the relationship between the top ballooning tension and bottom ballooning tension is written as

where Rg refers to the radius of balloon; m refers to the linear density of roving involved in the yarn-ballooning; ω refers to the rotating velocity of the balloon, which is approximately equal to the rotating velocity of the spindle.
Substituting equation (6) into equation (7), the bottom ballooning tension can be written as

Stress analysis of the winding region
Proper winding tension is necessary to ensure the yarn to wrap around the bobbin. The bottom ballooning tension is associated with the winding tension Tw and their relation can be written as

Substituting equation (8) into equation (9), the winding tension Tw is written as
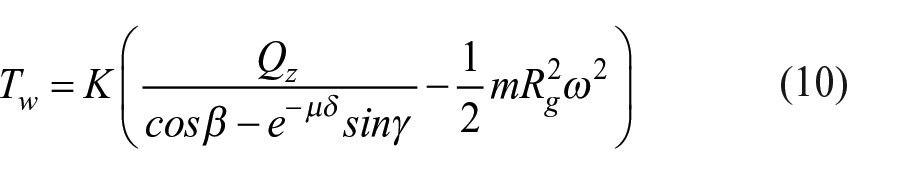
where K refers to the ratio between the winding tension and the bottom ballooning tension, which changes with the shape of the cross-section of traveler. In general, the shape of the cross-section is rectangle and K is determined to be 1.7 according to Tang. 27
Qy and Qz can be measured by the sensor. Therefore, the geometric parameters, including the guide angle γ, the angle β, and the wrapping angle δ, should be provided to solve for Tf, Tq1, Tq2, and Tw.
Analysis of geometric parameters
The knowledge of dynamics of geometric parameters, such as guide angle, top ballooning angle, and wrapping angle, provides insight into the yarn configuration in ring spinning, which is beneficial to the tuning of the manufacturing parameters to reduce the yarn breakage in ring spinning. The variations of geometric parameters are caused by the up and down ring rail movement as well as the position of thread guide. Therefore, an analytical model is built to describe the relationship of the geometric parameters with respect to the position of thread guide and the ring rail movement. During the yarn spinning, the traveler drives the yarn to rotate around the spindle. It is assumed that only the direction of the guide angle varies with the yarn rotation, as shown in Figure 5.

Diagram illustrating the motion of the thread guide.
According to the geometric relationship in Figure 5, the guide angle is written as

where a refers to the horizontal distance from the thread guide to the axis of bottom roller; h refers to the perpendicular distance from the sensor attached to the guide plate to the axis of bottom roller; Rq refers to the radius of bottom roller at the front roller; x refers to the perpendicular displacement of guide plate.
Based on the algebraic relation, that is, equations (2) and (3), between


When the roving rotates along the spindle, the wrapping angle reaches the minimum value as the traveler goes to the farthest location of the ring, whereas it reaches the maximum value as the traveler goes to the opposite side of the ring, as shown in Figure 4.
According to geometric relation, the wrapping angle is expressed as

Based on the stresses Qz and Qy and the displacement x, we can calculate the guide angle γ, top ballooning angle β, and wrapping angle δ, using equations (11) to (14), and then solve for the upstream tension Tf, top ballooning tension Tq1, bottom ballooning tension Tq2, and winding tension Tw using equations (5) to (10), which provides an insight into the mechanics of blended yarn.
Materials and method
Signal collection density refers to the data collection frequency of a signal collection system in unit time, that is, the number of times for which signal collections have been conducted by a sensor per unit time. The greater the signal collection density is, the higher the number of times signal collection will be conducted in unit time, in turn leading to increased accuracy. If the signal collection density is low, on the contrary, not only is the signal collection frequency comparatively small in unit time, but higher error may be also resulted in the measured data. The variations in spinning tensions include the change in tension during one revolution of traveler and the change in tension at one up and down reciprocating cycle of the guard plate. Therefore, we need to sample the stress signals in one revolution of the traveler for each up and down reciprocating cycle of the guide plate.
Signal collection in one revolution of the traveler is conducted as follows. The rotation speed of the spindle was 10,000 r/min. In this context, the spindle was rotated for 167 rounds per second and the traveler was revolved for 167 rounds along the ring, in which a layer of windings was formed around the bobbin in one revolution. In this case, 167 layers were estimated to be formed around the bobbin per second. Due to the combined effects of air drag, yarn-traveler friction, and traveler-ring friction, the traveler speed is slightly lower than the spindle speed, 28 in which the rotation speed of the traveler is approximately 9900 r/min according to the relationship of the traveler speed and the spindle speed. 29 As such, there is a 1% error in the estimated number of winding layers per second. The stress was measured when a winding layer was formed around the bobbin during the spindle rotation. In general, the rise and fall of a guide plate require 20–80 s. For this experiment, the time for rise and fall of the guard plate was designed to be 40 s. As a result, there were 6680 layers wound around the bobbin. Due to the rise and fall of the guide plate, the yarn was wound on the bobbin layer by layer, so yarn tensions exhibit a periodical change on a layer-by-layer basis. Both the tension sensor and the displacement sensor collect the data, respectively, in 1 s. Hence, 40 data were recorded at each winding layer. The average value of tensions measured from 167 winding layers on the bobbin was computed and used for data analysis. The entire spinning process was to last for 3.2 h. Moreover, the recorded data were categorized in accordance with the three spinning stages, as shall be discussed below. By processing the data collected in each stage, the corresponding yarn tension variations could be obtained.
In order to verify the performance of the self-developed sensors, we measure the tensions in y and z directions. There are three stages according to the characteristics of average tensions in the winding process. At the initial winding stage, the average tensions are the largest compared to those at later times, since the diameter of the bobbin is the smallest at this moment. After a short period of time, the average spinning tensions would decrease due to the increase in the diameter of the bobbin. 2 At the final stage, the average tensions start to increase due to the small gap between the bobbin and ring. Therefore, there exist three winding stages that are referred to as the initial, intermediate, and final winding stages. Then, we analyze the variation of tensions in three different stages.
The yarn is made of polyester and cotton. The linear density of yarn is set to be 19.4 tex and the yarn twist is set to be 77.1 twists/0.1 m. The horizontal distance from the center of thread guide to the axis of bottom roller is 57 mm; the distance from the center of sensor to the axis of bottom roller is 0.168 m; the radius of bottom roller at the front roller is 0.0131 m; the radius of ring is 0.021 m; the rotation speed of spindle is set to be 167 r/s; the delivery speed of yarn is 13 m/min. We further increase the spindle speed to examine the effect of spindle speed on the tensions and geometric parameters of the cotton yarn with the same configuration as the cotton/polyester blended yarn.
Results and discussion
Analysis of yarn tensions and geometric parameters
To prevent the yarn breakage, it requires a knowledge of the tension distribution and characteristics at different winding stages to realize the uniform tension control. Therefore, it is critical to accurately measure the variations and tensions, especially regarding their most important features, such as periodicity and fluctuation, in different spinning regions at different winding stages.
Figure 6(a) to (c) show the variations in tensions in y and z directions as well as the perpendicular displacement of the guide plate, with respect to an up and down reciprocating cycle of the guide plate. It can be seen that the measured stresses and displacement reach the maximum values at the highest position of the guide plate. Figure 6(d) to (f) show the variation of geometric parameters with respect to time. In an up and down reciprocating cycle for the guide plate, the geometric parameters exhibit the same periodic changes. In particular, the geometric parameters reach the maximum values as the guide plate is located at the lowest position, while they reach the minimum values as the guide plate is located at the highest position. Both the top ballooning angle and wrapping angle show certain irregularities due to the irregular distribution of fibers in the ballooning bundle that affects the balloon shape in the spinning process,14–17 resulting in the irregular top ballooning angle. The change of wrapping angle is irregular because it is related to the guide angle and the top ballooning angle.

Stress and displacement curves of the thread guide: (a)-(b) stress and (c)-(f) displacement curves of the thread guide.
As shown in Figure 7, the upstream tension, top ballooning tension, bottom ballooning tension, and winding tension demonstrate the same periodicity, in which they reach the minimum values as the guide plate is located at the lowest position, whereas they reach the maximum values as the guide plate is located at the highest position. The maximum tensions in stage I are greater than those in stages II and III. During the overall spinning process, the tensions in stage I are generally greater than those in stage III, followed by stage II. This can be explained as follows. It could be observed from equations (5), (6), (8), and (10) that the changes in yarn tension are related to the changes in stresses Qz, the guide angle γ, the top ballooning angle β, and the wrapping angle δ. While the yarn tension is proportional to Qz, β, and γ, it is inversely proportional to δ. Therefore, the yarn breakage occurs when these parameters reach their critical values. At stage I, a large value for stress Qz was detected by the sensor, in addition, both γ and β are comparatively large. For this reason, the four yarn tensions can be rather large in this period. During stage II, the stress Qz as measured by the sensor was low, so were the γ and β, which indicates that the four yarn tensions at this stage were all small. During stage III, the stress Qz measured by the sensor was greater than that detected in stage II; in addition, the values of γ and β were also greater than those obtained during stage II. Hence, the yarn tension during stage III was larger than that at stage II, but smaller than that during stage I. In an up and down reciprocating cycle of the guide plate, the winding tension is greater than the top ballooning tension, followed by the bottom ballooning tension, and then the upstream tension.

Changes of (a) upstream tension Tf, (b) top ballooning tension Tq1, (c) bottom ballooning tension Tq2, and (d) winding tension Tw with respect to time.
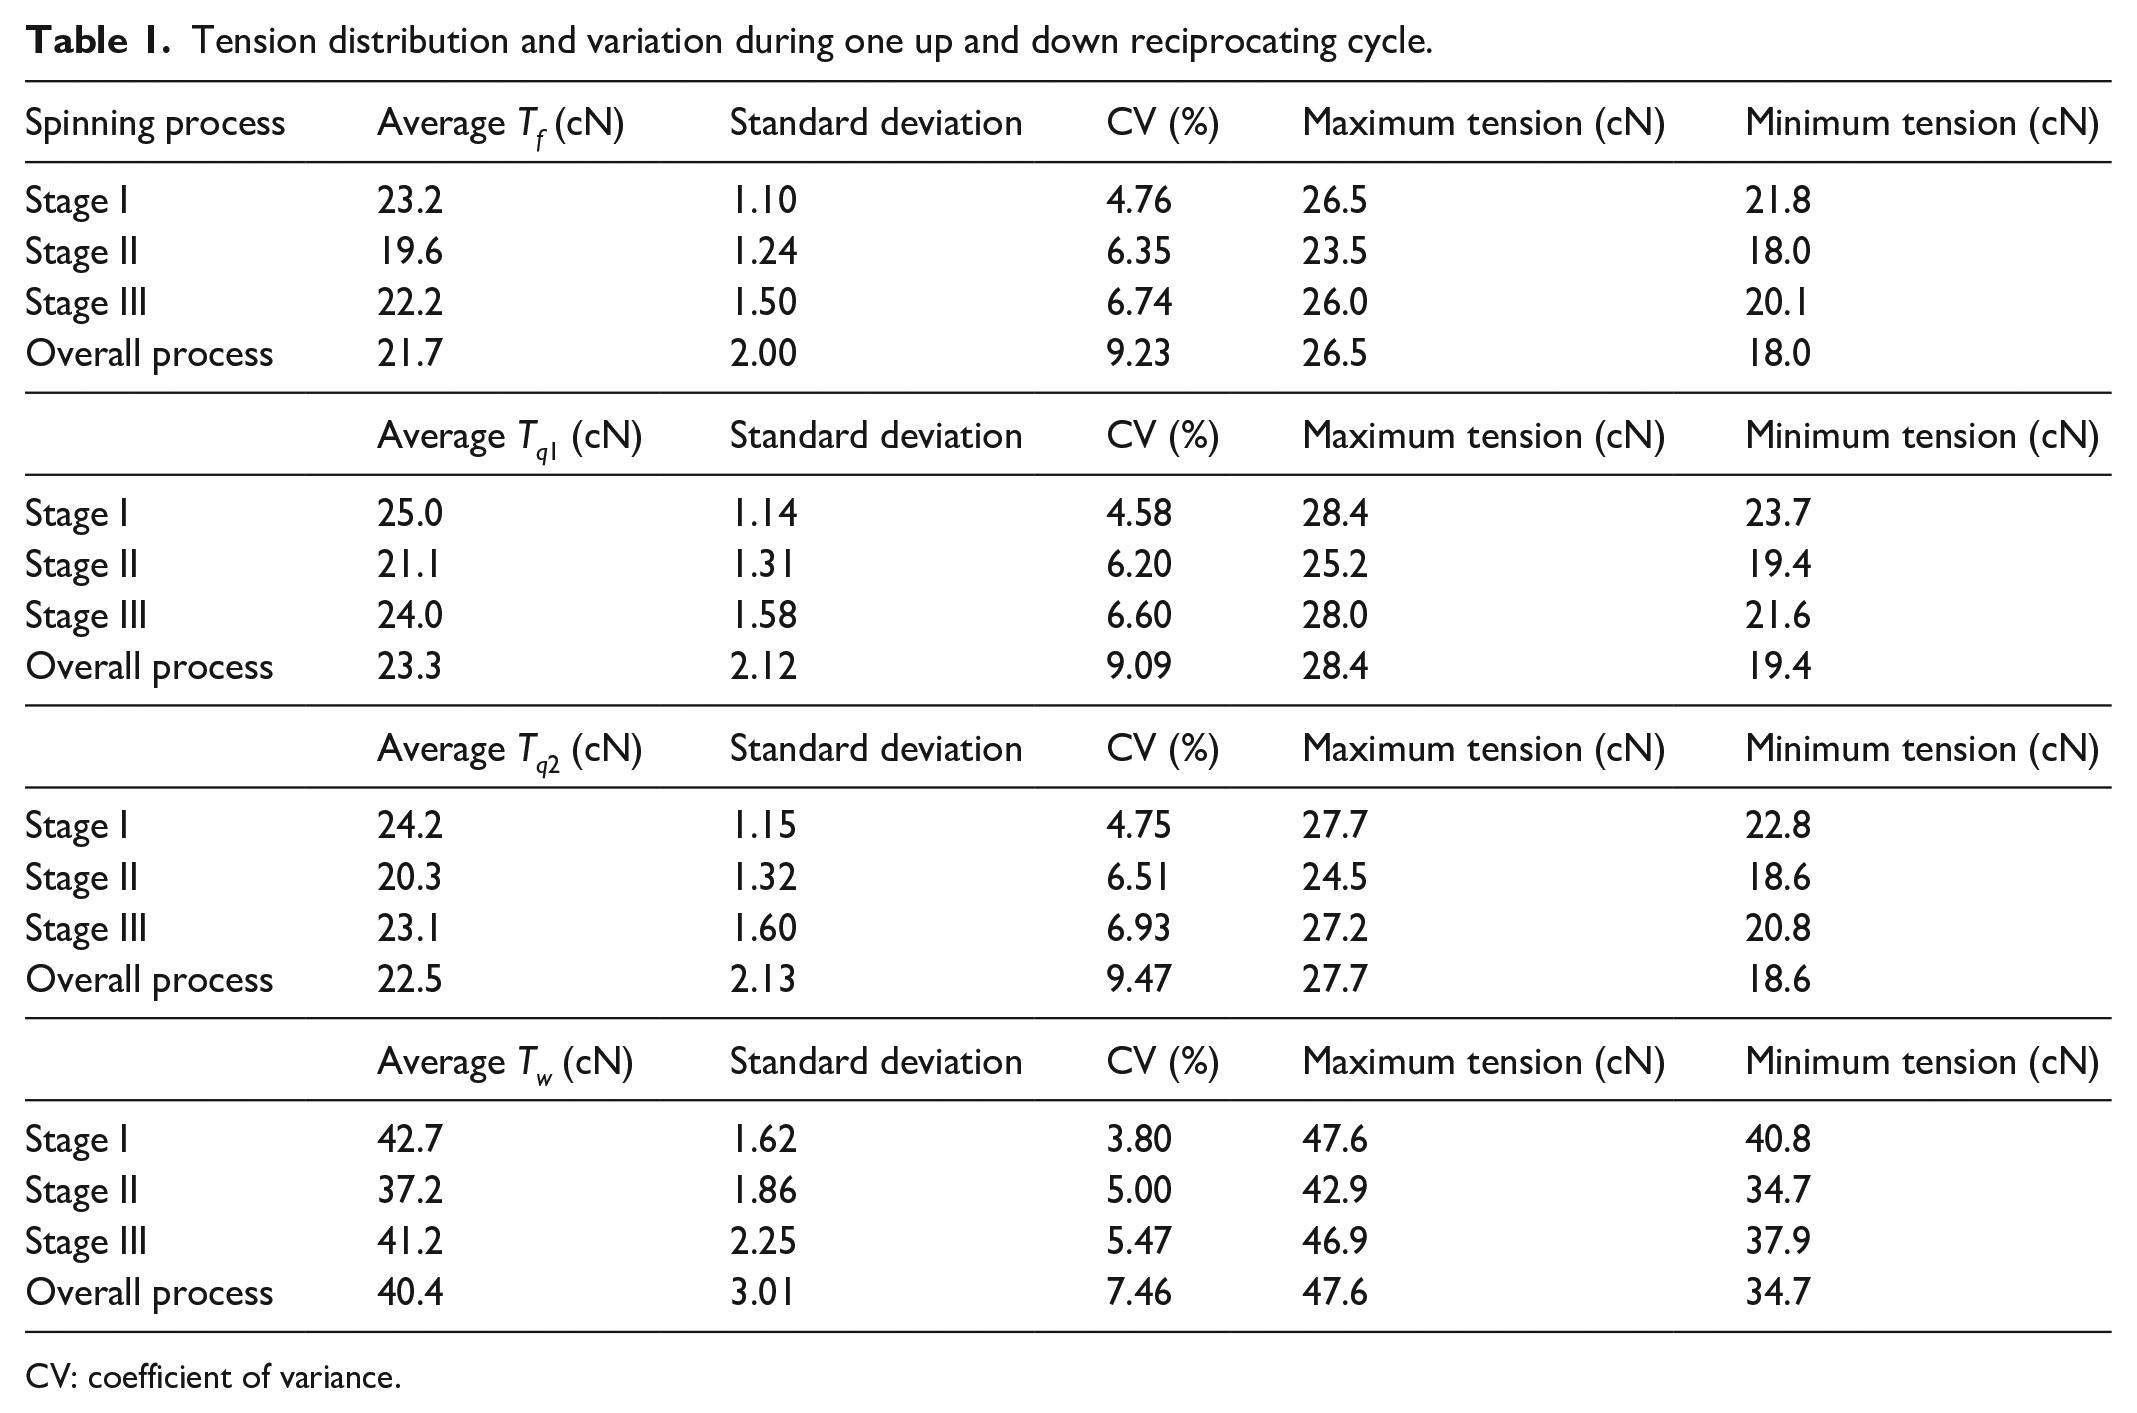
Table 1 summarizes the statistical results for the measured spinning tensions. The average tensions in stages I and III are close to one another; however, they are greater than the average tensions in stage II. The standard deviations and coefficients of variance (CVs) of spinning tensions in stage III are slightly larger than those in stage II, followed by stage I, which suggests that the yarn breakage is mostly likely to occur in stages III and II due to the large fluctuation of spinning tensions. Therefore, reducing the tension fluctuation in stages III and II is critical for enhancing the uniform qualities of ring-spun yarn. The realization of uniform yarn tension stabilizes the balloon and increases the maximum balloon height as well as the maximum spindle speed, 30 which accordingly increases the yarn twist and thus improving the mechanical strength of the spun yarn.
Tension distribution and variation during one up and down reciprocating cycle.
CV: coefficient of variance.
To verify the performance of the device, MATLAB image processing has been implemented for calculating the upstream tension for comparison, as shown in Table 1. The details of the MATLAB image processing method can be found in Chen. 31 The spinning tension obtained from the experiment is slightly lower than the one obtained from the image processing since the air resistance and environmental conditions are ignored in the test. When the guide plate is located at the bottom, both the bottom end diameter of the bobbin and winding angle are large, resulting in a small gap between the bobbin and ring; therefore, the tension is small. When the guide plate is located at the top position, the diameter of the bobbin and winding angle are small, resulting in a large gap between the bobbin and the traveler; therefore, the tension is large. 32 According to Table 2, the maximum value of tension in stage I increases by 12.6% when compared to stage II, while the maximum value of tension in stage III increases by 10.6% when compared to stage II.
Comparison of test results for two methods.

Effect of spindle speed on spinning tensions and geometric parameters
It can be seen from Figure 8(a) that when the spindle rotation speed is 13,000 r/min, the time spent in one up and down reciprocating cycle is shorter than when the spindle rotation speed is 10,000 r/min. In terms of the time, it takes a longer time in the rising process and a shorter time in the falling process of the guide plate. In the rising process, the yarn is winding on to the bobbin, so the speed is slower; the falling process is to reinforce the wound package on the bobbin, so the falling process is faster.
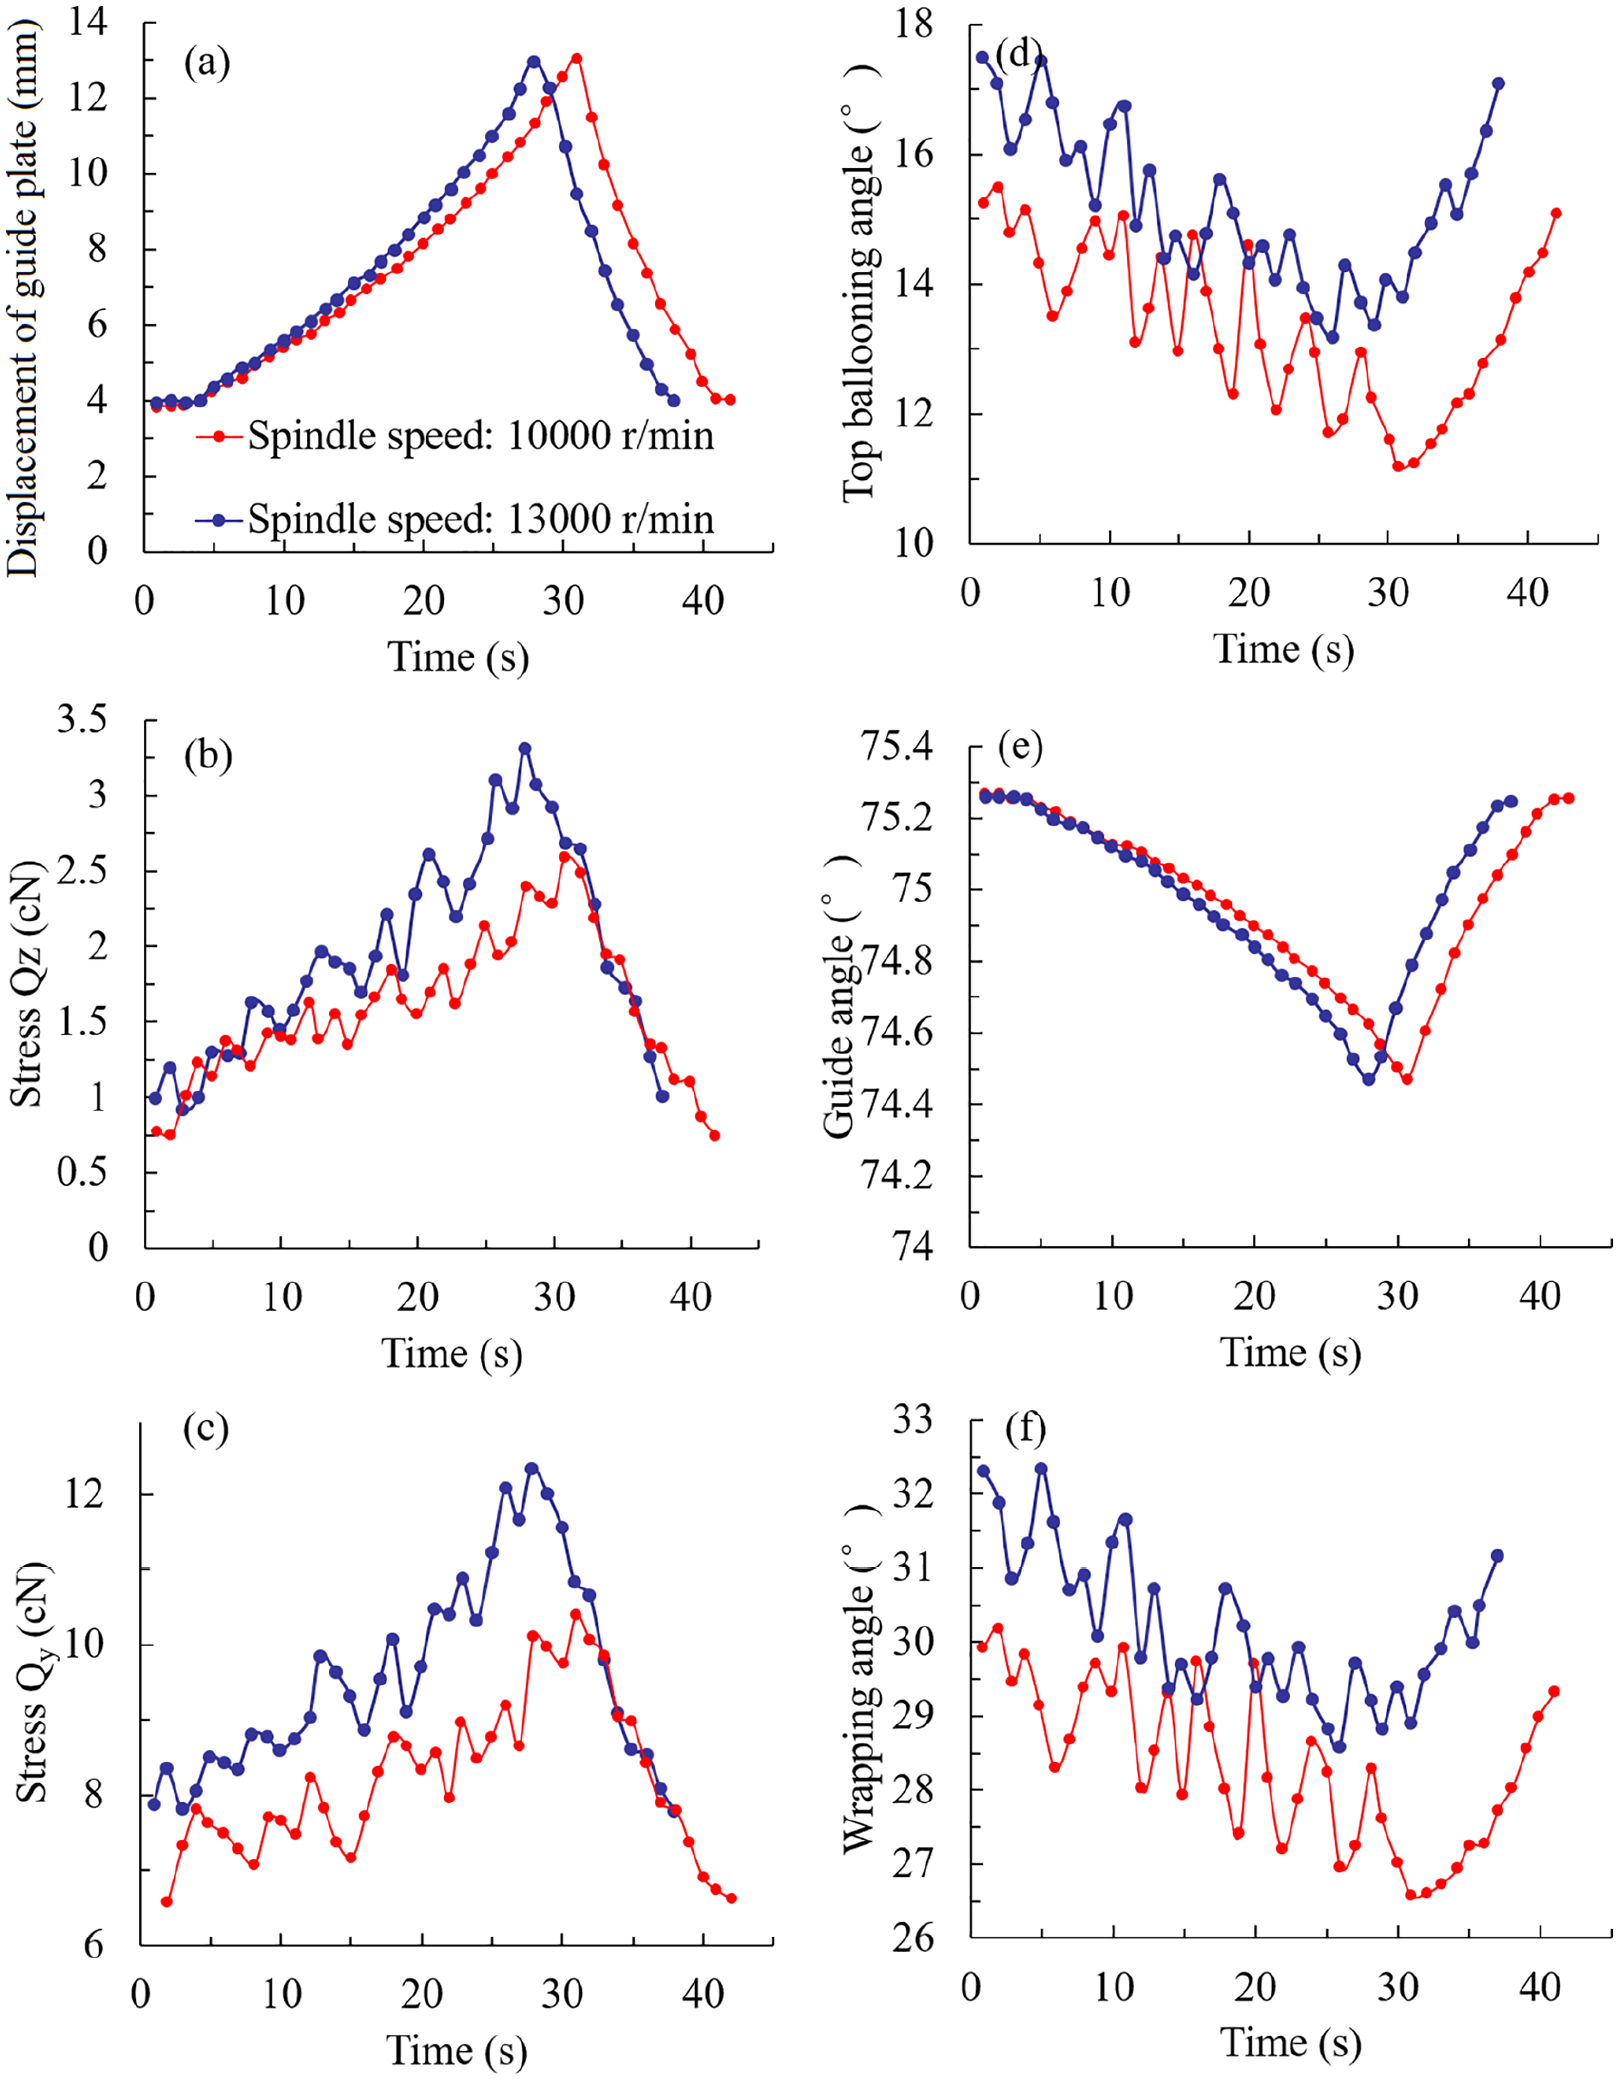
Effect of spindle speed on the yarn stresses, displacement of guide plate, and geometric parameters: (a) displacement of guide plate, (b)-(c) yarn stresses, and (d)-(f) geometric parameters.
The measured stresses Qy and Qz in one up and down reciprocating cycle are shown in Figure 8(b) and (c). When the spindle speed is 13,000 r/min, the measured stresses Qy and Qz are generally larger than when the spindle speed is 10,000 r/min. In addition, it is found that the fluctuations of horizontal and perpendicular tensions are smaller when the guide plate is at the bottom, and are larger when the guide plate is at the top. The fluctuations of top ballooning angle and wrapping angle exhibit the similar characteristics to those of Qy and Qz in one up and down reciprocating cycle of guide plate except that they do not correlate with the position of the guide plate, as can be seen from Figure 8(d) and (f).
Figure 9 shows the spinning tensions at 13,000 r/min are generally greater than those at 10,000 r/min, with some abnormal values due to the irregular fiber distributions in ballooning bundles in the spinning process. Therefore, the higher the spindle speed, the greater the spinning tension. The maximum ratio of the tension at 13,000 r/min with respect to that at 10,000 r/min is about 9.5%. The tension fluctuations are smaller when the guide plate is at the bottom, and are larger when the guide plate is at the top. Furthermore, the average tensions and their fluctuations get larger with increasing spindle speeds, as shown in Table 3, which indicates the real-time tension control can be realized by regulating the spindle speed based on the tensions dynamics measured using the self-developed system.

Effect of spindle speed on (a) upstream tension Tf, (b) top ballooning tension Tq1, (c) bottom ballooning tension Tq2, and (d) winding tension Tw.
Tension distribution and variation under different spindle speeds during one up and down reciprocating cycle.

CV: coefficient of variance.
Conclusion
In the present work, we developed a device that can measure the tensions at the thread guide as well as the displacements of the guide plate in different spinning processes. In particular, by solving the coupled physical-mathematical equations, we obtained the tensions at the top and the bottom of ballooning as well as the winding tension, which provides a detailed picture of tension dynamics in different stages of ring spinning and new insight into the mechanics of yarn configuration. We found the occurrence probability of yarn breakage in the initial winding stage reaches the maximum value, followed by the third winding stage and then the second winding stage, which is consistent with the well-established facts regarding the ring spinning, indicating the reliability of self-developed device. Furthermore, in an up and down reciprocating cycle of guide plate, the spinning tensions and geometric parameters exhibit similar periodic changes, which can be explained by the intrinsic correlation between the balloon geometry and spinning tensions from the coupled mathematical-physical equations.
Footnotes
Declaration of conflicting interests
The author(s) declared no potential conflicts of interest with respect to the research, authorship, and/or publication of this article.
Funding
The author(s) received no financial support for the research, authorship, and/or publication of this article.