
Abstract
The virtual crack closure technique is a well-known finite element–based numerical method used to simulate fractures and it suits well to both of two-dimensional and three-dimensional interlaminar fracture analysis. In particular, strain energy release rate during a three-dimensional interlaminar fracture of laminated composite materials can successfully be computed using the virtual crack closure technique. However, the element size of a numerical model is an important concern for the success of the computation. The virtual crack closure technique analysis with a finer mesh converges the numerical results to experimental ones although such a model may need excessive modeling and computing times. Since, the finer element size through a crack path causes oscillation of the stresses at the free ends of the model, the plies in the delaminated zone may overlap. To eliminate this problem, the element size for the virtual crack closure technique should be adjusted to ascertain converged yet not oscillating results with an admissible processing time. In this study, mesh size sensitivity of the virtual crack closure technique is widely investigated for mode I and mode II interlaminar fracture analyses of laminated composite material models by considering experimental force and displacement responses of the specimens. Optimum sizes of the finite elements are determined in terms of the force, the displacement, and the strain energy release rate distribution along the width of the model.
Introduction
Delamination is the most important life-limiting damage type in laminated composite materials1,2 because of the difference between the mechanical properties of reinforced plies and the resin rich interfaces. Delamination initiation can easily take place because of the manufacturing—machining processes or service conditions. Delamination propagates according to three distinct fracture modes: mode I—opening mode, mode II—sliding mode, and mode III—shearing mode. Presence of the continuous reinforcements in plies hinders the scatter of delamination crack into subsequent interfaces and the delamination propagates in a certain path.3,4 Therefore, virtual crack closure technique (VCCT) is an appropriate numerical method to model the interface delamination problems in the laminated composite materials,5,6 since the method assumes that the crack grows in a predefined path. VCCT was first introduced by Rybicki and Kanninen 7 and have been used by researchers since then to identify the interlaminar fracture characteristics of composite materials.6–11
Davidson et al. 12 modeled double cantilever beam (DCB) and end-notched flexure specimens (ENF) with three-dimensional (3D) shell elements to investigate the influence of bending–bending and the bending–twisting couplings of multidirectional laminates on the strain energy release rate (SERR) distribution along the delamination tip using VCCT. Similar investigations are performed for mode II interlaminar fracture and mode I interlaminar fracture by other researchers using 3D 8-node solid elements to identify the influence of the elastic coupling-related instabilities on the crack propagation.9,10,13,14 However, it is well known that the critical force and the critical displacement results obtained by the VCCT are dependent on dimensions of the finite elements (FEs).15,16 The size of the elements along the crack tip influences especially the force reaction of the displaced fracture models. Hence, the mesh sensitivity analysis for VCCT is necessary before the fracture analysis is performed. 8 However, the oscillatory stresses or displacements around the crack tip is another phenomenon that takes place as a result of the singularity of the stress functions. 17 The oscillatory behavior of the stresses causes the divergence of determined strain energy release rate at the crack tip. 5 The stress oscillations at the crack tip are more common in the interfaces that take place between the two layers with different fiber orientations. 10 Influence of the stress oscillations makes mesh sensitivity analysis even more important for interlaminar fracture analysis. Thus, the length of the element in vicinity of the crack tip (Δa) must be considered carefully. Krueger 11 advised a ratio of FE length to laminae thickness as 0.05 ⩽ t/Δa ⩽ 1. However, Zhang and Chryssanthopoulos 18 expresses that 2-mm FE length is just enough to achieve admissible fracture analysis.
The purpose of this study is to determine optimum mesh size for interlaminar mode I and mode II fracture analyses by considering numerical calculating time, SERR distribution along the specimen width and reaction forces. For this purpose, DCB and ENF specimens are modeled with initial delaminations using 3D solid elements in ANSYS® commercial software. Material properties of the models and the verification of the analysis performed by the aid of the experimental results of Jiménez and Miravete. 5 Element sizes of the models in vicinity of the crack tip are kept in the range of 0.125 ⩽ t/Δa ⩽ 2.5. Numerical models are forced to fracture by applying displacement, and the results related to forces and SERR are recorded. The numerical results are then compared with the experimental results provided by Jiménez and Miravete. 5
Numerical method and FE simulation
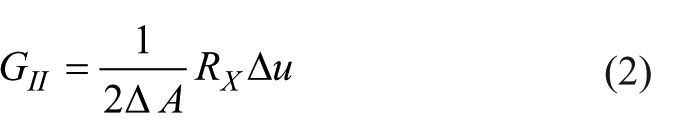
VCCT is an effective and simple method that takes care of the released strain energy rate (GI) during fracture phenomenon. The technique assumes that the required energy to obtain unit fractured surface (ΔA) is equal to the energy required to bring the fractured surfaces together, and that the crack progresses on a predefined path. The technique also hypothesizes that the stress state in the crack tip does not change since the crack propagation is too small compared to the full crack length. VCCT uses coincident nodes along a predefined crack path and calculates the SERR by considering displacements and reaction forces of the nodes at crack tip (Figure 1). If Δu, Δυ, and Δw are the relative displacements of the separated nodes in x, y, and z directions, respectively, and if the Rx, Ry, and Rz are the reaction forces at the crack tip, then the SERRs for modes I–III are computed as


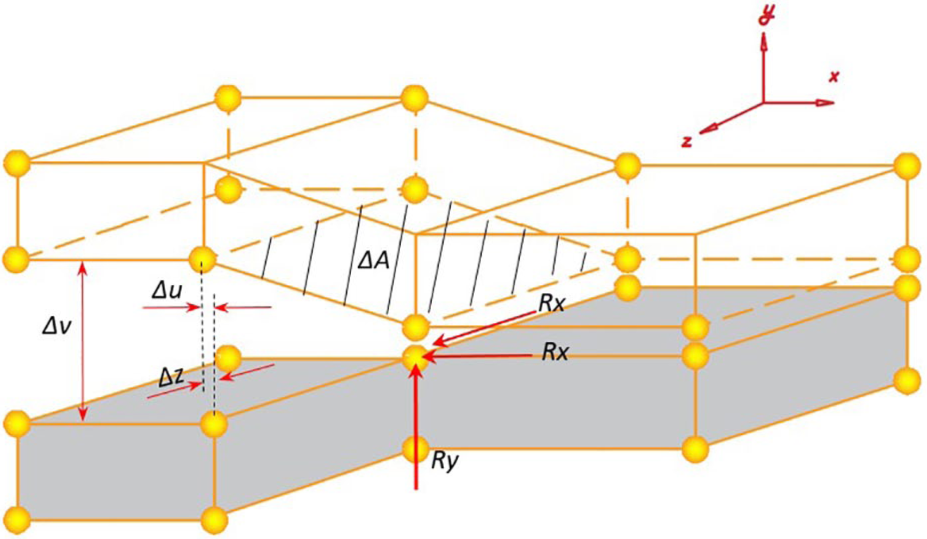
A 3D crack model for VCCT.
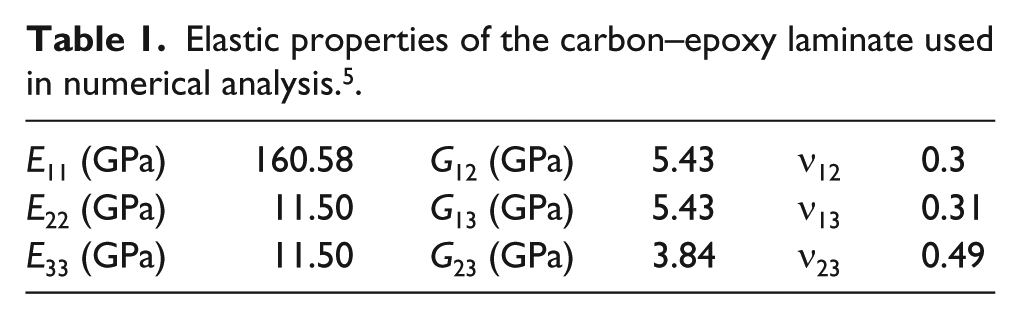
The 3D modeling of the carbon–epoxy IM7/8552 DCB and ENF specimens are prepared using SOLID185 which have eight nodes with 3-degree-of-freedom at each node. The 3D 8-node linear interface element INTER205 is used to obtain predefined crack path in the models. The numerical models are designed in accordance with the carbon–epoxy IM7/8552 specimens of Jiménez and Miravete 5 in stacking sequence of [0°]28 with 0.125 mm thickness of each layer (t). Geometry and dimensions of the DCB and ENF models with 3.5 mm total thickness (h) are shown in Figure 2. Initial delamination length is kept at 45 mm for DCB model and 50 mm for ENF model. Elastic properties of the models are also taken from Jiménez and Miravete 5 and are listed in Table 1.
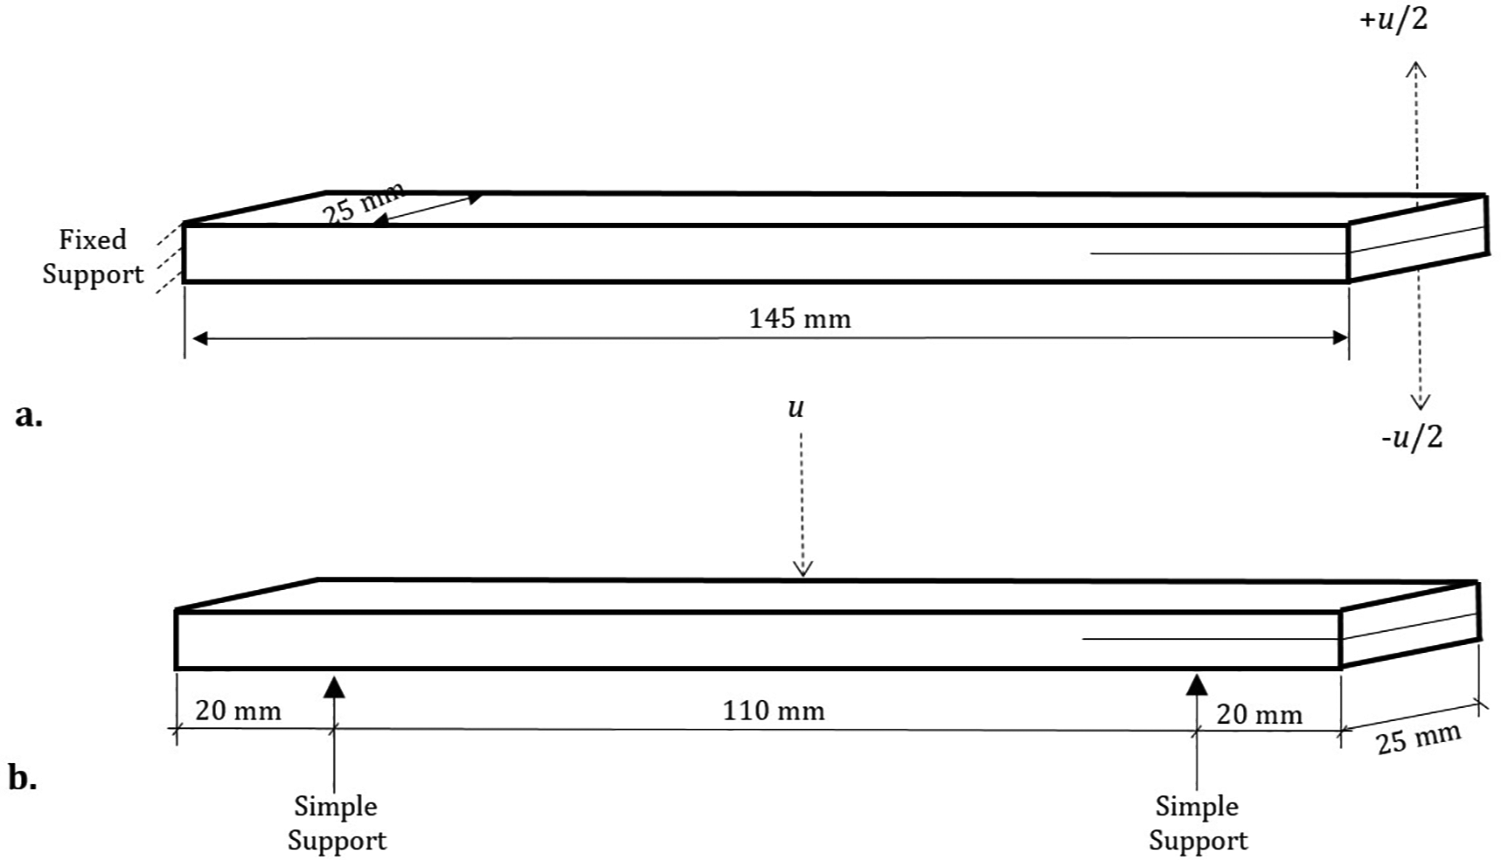
Geometry and dimensions of (a) DCB model and (b) ENF model.
Elastic properties of the carbon–epoxy laminate used in numerical analysis. 5 .
Height and width of all 3D FEs are kept constant for all numerical models. Height of the elements is equal to ply thickness (0.125 mm) and the width of the elements is 2 mm. Length of the elements differs between a predefined local finer mesh region and out of this region. Local finer mesh at the vicinity of precrack tip is preferred in order to reduce numerical calculating time of the computer. Length of the finer mesh region is limited to 10 mm where the precrack tip is located at the middle of the region (Figure 3). Some researchers kept the element length as 2 mm along the predefined crack path. Element lengths at the vicinity of precrack tip (Δa) are selected as 1, 0.5, 0.25, 0.1, and 0.05 mm while it is kept constant at 2 mm at the outer of the finer mesh region. The crack propagates by one element length (Δa) and the FE calculations are regenerated for each coincident nodes. The element length which is also crack propagation length, influences the oscillatory stress behavior because of the dependence of the stiffness to element length. Some researchers kept the crack propagation length as 2 mm constant for VCCT but there is lack of the detailed analysis about optimum element length for both mode I and mode II fracture analyses.19–24 Total number of the elements and the nodes are listed in Table 2 for each model. After the preparation of DCB and ENF numerical models, boundary conditions are applied and then the precracks are forced to propagate. Arms of the DCB model are forced to move in opposite directions along the y-axis. The ENF model is also subjected to displacement by its mid-line along the (−) y-axis. The nodes of the ENF models on the line of simple supports are located at the lower face of the model. These nodes are hindered to displace but are made free to rotate. Boundary conditions of the nodes that are located opposite to simple support on the upper face of the model, are also important. Displacement along the (−) y-axis of these upper nodes are also hindered to prevent the penetration the elements. Displacements of the models are continued until the coincident nodes at the crack tip is separated after which and progressive delamination initiates. Force and displacement responses, critical forces and displacements to propagate the precrack, GI distributions along the width, and the processing times are obtained after FE simulations. Preparation of the models and the simulations of the modes I and II fractures are achieved using a computer with 8 GB RAM and INTEL i7-6500U 250 GHz processor.

Numerical model with finer mesh in vicinity of crack tip for mode I fracture analysis. 19
Number of the nodes and elements for DCB and ENF models.

DCB: double cantilever beam; ENF: end-notched flexure.
Results
Force reactions of the DCB arms to the displacement in mode I fracture are shown in Figure 4 for different element sizes. It is observed that linear elastic deformation of the DCB arms and the separation of the coincident nodes after peak of the reaction force are apparent. The strain energy on the first coincident nodes along fracture path increases by the displacement of the arms of DCB model. Due to the nature of VCCT, when the concentrated strain energy reaches a critical value on the nodes, the length of the DCB arm increases with the separation of the coincident nodes. Therefore, an instant decrease of the reaction force takes place and then the force begins to increase again until the next coincident nodes. This behavior of the force and displacement occurs in the graphs as zig zag. The obtained critical forces and displacements from FE analysis for mode I fracture are listed and compared with the experimental results of Jiménez and Miravete 5 in Table 3. Total central processing unit (CPU) time spent to solve the numerical problem is also listed in Table 3. The consistency of mode I results compared with that of experimental results is quite good especially if the ratio of t/Δa is kept as 0.25 mm/mm. In that case, numerical Rcr is just 1.19% higher than the experimental one and the numerical δcr is 5.16% lower than the experimental δcr. The ratio of t/Δa = 0.25 is also in the range of advised ratio by Krueger 11 for 2D VCCT analysis. Results show that decreasing the mesh size around the precrack tip in direction of crack propagation causes to higher Rcr response corresponding to moderate δcr because of the decreasing compliance of the FEs. The CPU time spent to solve the problem also increases from around 55 min to around 8.5 h due to the increase in the element number.
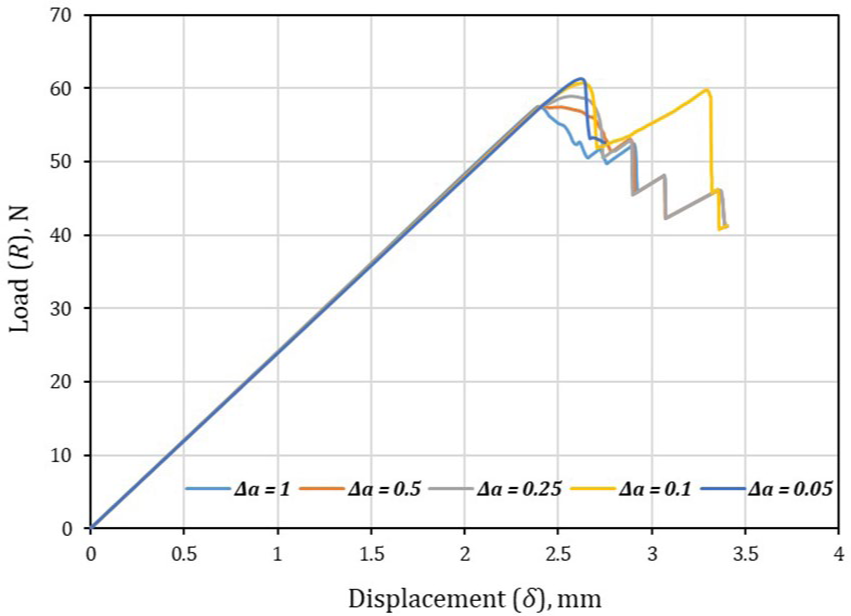
Force–displacement response of DCB models under mode I fracture.
Critical force, displacement, and processing time for mode I and mode II fractures.

GI distribution along the width for DCB specimens are shown in Figure 5. It can be seen that if the mesh size is decreased and the ratio of t/Δa is higher than 2.5 mm/mm, stress oscillations can take place. These oscillations cause a non-uniform GI distribution along the width since the distribution is still symmetric. If the ratio of t/Δa is lower than 2.5 mm/mm, GI distribution is not influenced by the FE length, and uniform symmetric GI distribution occurs. Therefore, the ratio of t/Δa = 2.5 mm/mm can be accepted as an upper bound in order to obtain a uniform GI distribution and achieve acceptable reaction force calculations when VCCT with 3D FEs is used for mode I fracture analysis. It is also a remarkable result that the calculated GI values along the width are identical when the t/Δa is kept below 2.5 mm/mm.

SERR distribution along the width in crack tip of DCB models under mode I fracture.
Force–displacement response of ENF models are shown in Figure 6. Moreover, the obtained critical forces and displacements for mode II fracture analysis are listed in Table 3. Effect of the mesh size reduction on calculated force and displacement is narrower in mode II fracture analysis than mode I, and the Rcr results of ENF models are very consistent. The maximum difference of the Rcr values within the ENF models with respect to mesh size change is 1.88%. However, calculated R cr values by VCCT are higher than that of the experimental cases. Differences between the experimental results and numerical ones are in the range of 6.18%–7.96%. Similar observations are valid for δcr values too. When the calculated δcr values are compared, it is observed that the results are consistent, and the effect of the mesh length reduction on the δcr values is limited. The maximum difference of the δcr values within the ENF models with respect to mesh size change is 4.03%. However, the maximum difference between the experimental and numerical δcr values is 22.82%. By considering Rcr and δcr values calculated in mode II fracture analysis and comparing them to experimental results, if the t/Δa ratio is kept as 0.25 mm/mm, the calculated δcr and R cr values are closest to experimental results. That is, the numerical δcr is 9.09% higher, and the numerical R cr is just 6.1% higher than those of the experimental ones. Similar to mode I analysis, it is seen that the time spent time to perform the mode II fracture analysis increases from around 55 min to 8.5 h.
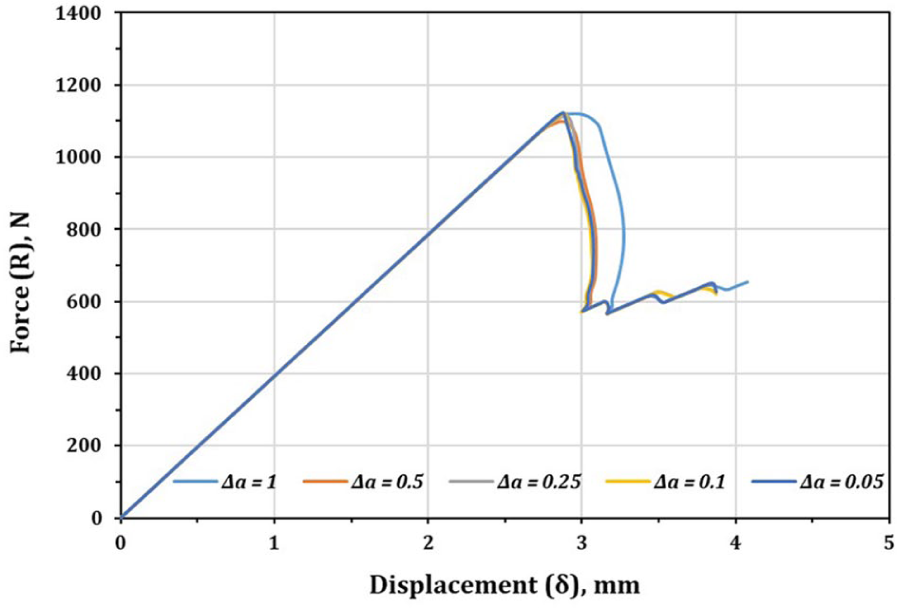
Force–displacement response of ENF models under mode II fracture.
GII distribution along the width for DCB specimens are also shown in Figure 7. Although GII distributions along the width are symmetrical for all models, non-uniform distributions occur in models with the t/Δa ratios of 0.25 and 2.5 mm/mm. This non-uniformity may be due to the oscillatory behavior of the stresses at crack tip. For other models, almost uniform and fully symmetric GII distributions are shaped. This means the mesh size in vicinity of the crack tip may not be related with the GII distribution along the width for mode II analysis.

SERR distribution along the width in crack tip of ENF models under mode II fracture.
Conclusion
Optimum FE sizes for mode I and mode II interlaminar fractures are analyzed in this study by considering critical force and displacement reactions, the SERR distribution along the width, and processing times. Fracture analyses of carbon–epoxy laminate are performed using VCCT and the concluding remarks are listed below:
VCCT successfully performs 3D linear elastic mode I and mode II fracture analyses of carbon–epoxy laminated composites.
For mode I fracture analysis, adjusting the t/Δa ratio to a value higher than 0.125 mm/mm and lower than 1.25 mm/mm can ensure optimum conditions to obtain most consistent results which were found in the experimental study. Time spent for the analysis is also acceptable within this t/Δa ratio range.
The GI distribution along the width is in a dumbbell form and it is uniform until the FE size decreases and the ratio t/Δa reaches 2.5 mm/mm.
Mode II fracture analysis with VCCT is less sensitive to the mesh size than mode I fracture analysis and its results are more consistent with the experimental results. However, adjusting the t/Δa ratio to a value in the range of 0.125–1.25 mm/mm may be more useful for obtaining an acceptable GII distribution along the width.
Footnotes
Declaration of conflicting interests
The author(s) declared no potential conflicts of interest with respect to the research, authorship, and/or publication of this article.
Funding
The author(s) received no financial support for the research, authorship, and/or publication of this article.