
Abstract
To study the relationship between the chemical composition and aggregation structure of windmill palm fibres, the Grey System theory, least-squares method and MATLAB® software were used to develop a grey model that relates the crystallinity index to the cellulose, hemicellulose and lignin content of the fibres after alkaline peroxide bleaching. The mean arithmetic error (=0.109) of the grey model (GM (1,4)) indicated that the model could predict the crystallinity of windmill palm fibre based on its chemical composition. Scanning electron microscopy, Fourier transform infrared spectroscopy and Raman microscopy were used to characterize the morphology and chemical composition of the windmill palm fibres before and after alkaline peroxide bleaching. The results indicated that silica, as well as most of the pectin, hemicellulose and lignin, were removed after peroxide bleaching, and thus, the crystallinity index of the peroxide-bleached samples increased. The GM (1,4) provided a reference for studying the influence of the chemical composition of windmill palm fibre on its aggregate structure.
Introduction
The aggregate structure of fibres is composed of crystal and amorphous cellulose, which influences the properties of the fibres. The region with regular cellulose macromolecules is called the crystal region. By contrast, the amorphous region consists of irregularly aligned cellulose macromolecules. The content of crystalline cellulose in the fibre is defined as the fibre crystallinity. Crystallinity has a great impact on the mechanical, thermal and optical properties of fibres. 1
Windmill palm is one of the most widely distributed trees in East Asia. 2 Owing to the advantages of windmill palm fibre, such as its low density, high strength, high biodegradability and high abundance, this fibre material has received much attention as an exceptional environmentally compatible resource.3–5 The main components of windmill palm fibre include hemicellulose, cellulose and lignin. 6 To date, several studies have examined the aggregation structure of flax, 7 ramie, 8 cotton, 9 oil palm empty fruit bunches 10 and windmill palm fibres. 11 However, there have been few reports that discuss the relationship between the chemical composition and cellulose crystallinity of windmill palm fibres. There are several mathematical tools that can be used to study the fibre, including fractal calculus, 12 the delayed fractional model, 13 Langmuir model 14 and grey model (GM). 15
The established process of the GM first constructs the original sequence based on the original data, initializes the original sequence, and obtains the accumulated generating sequence by accumulation. Then, the mean value generating sequence is obtained by using the data. This makes the data present regularity. A GM can be developed by solving a system of linear equations using process data as inputs. 16 The GM has the advantages of high precision, lower data requirements and unordered data. 17
In this work, alkaline peroxide bleaching was used to extract hemicellulose, cellulose and lignin from raw windmill palm fibres.18,19 The chemical composition and crystallinity index (CrI) were obtained using a statistical experimental design for a single factor that was orthogonal. A GM with four variables, GM (1,4), was developed to relate the chemical composition of the fibres to its cellulose crystallinity.
The morphology and chemical composition of windmill palm fibres were characterized before and after alkaline peroxide treatment using scanning electron microscopy (SEM), Fourier transform infrared spectroscopy (FTIR) and Raman microscopy. These characterizations were performed to provide a theoretical basis for understanding the aggregation structure and the potential applications of windmill palm fibres.
Experimental
Materials
Raw windmill palm fibres were obtained from the Yuanmu Company in Hubei Province (Wuhan, China). Sulphuric acid (H2SO4) and acetic acid (CH3COOH) were purchased from Qiangsheng Functional Chemical Reagent Co., Ltd., in Jiangsu Province (Suzhou, China). Sodium hydroxide (NaOH), sodium chlorite (NaClO2) and hydrogen peroxide (H2O2) were purchased from Aladdin Chemistry Co., Ltd. (Shanghai, China). All chemical reagents were of analytical grade and used without further purification.
Methods
Alkaline peroxide bleaching
Windmill palm fibres exhibit different levels of solubility in alkaline peroxide bleaching solutions based on treatment conditions. An orthogonal experiment design was used to examine the peroxide treatment variables of the NaOH solution concentration, H2O2 solution concentration, temperature, and liquor-to-fibre ratio at five different levels (Table 1).
Alkaline peroxide bleaching experiments with four independent factors and five levels.

Holocellulose content analysis
Holocellulose consists of cellulose and hemicellulose. 20 The holocellulose content was determined based on the chlorite delignification procedure as described by Guimaraes et al. 21 Water (120 mL) and glacial CH3COOH (1 mL) were added to a beaker. A dry fibre sample (3 g) and NaClO2 (2.5 g) were added to the beaker. The mixture was heated to 70°C for 1 h, then cooled and filtered. The previous process was repeated three times on the solid fibre residual (holocellulose). The holocellulose was dried and cooled to a constant weight (G1).
Cellulose and hemicellulose content analysis
The cellulose content of the sample was determined using the TAPPI Test Method T203 cm-09. 22 Dry holocellulose (1 g) was added to a beaker. The holocellulose was treated with 17.5 wt% NaOH (10 mL) for 8 min. Then, 17.5 wt% NaOH (10 mL) was put into the beaker with holocellulose for the second time. After 20 min, deionized water (40 mL) was added to the beaker for dilution. Last, the dissolved alkali residues on the fibre surface were removed via CH3COOH addition to neutralize the excess alkaline. The treated holocellulose was dried to a constant weight (cellulose weight). The hemicellulose weight was equal to the offset between the weight of the holocellulose and that of cellulose.
The cellulose content is calculated using equation (1). The hemicellulose content is calculated using equation (2)
where W1 is the cellulose content, G1 is the dry weight (g) of holocellulose and G2 is the dry weight (g) of cellulose

where W2 is the hemicellulose content, G1 is the dry weight (g) of holocellulose and G2 is the dry weight (g) of cellulose.
Lignin content analysis
Lignin is a complex phenylpropane polymer in the fibre walls. 23 The lignin content was ascertained using TAPPI Test Method T222 cm-11. 24 A dry fibre sample (1 g) was added to a flat-bottom flask (100 mL) with 72% H2SO4 (15 mL). Then, the sample was acid-hydrolysed for 24 h. Afterwards, distilled water was added to the flask. Finally, the diluted sample (3% sulphuric acid) was boiled under reflux for 4 h, and then a vacuum suction filter was used to filter the diluted samples. The samples were then dried (40°C) to a constant weight (G3).
The lignin content is calculated according to equation (3)

where W3 is the lignin content, G3 is the dry weight (g) of lignin and the water filtration membrane, e is the weight loss rate of the water filtration membrane (8%) and M is the dry weight (g) of the water filtration membrane.
X-ray diffraction analysis
The cellulose crystallinity of the fibre samples was determined using an X-ray diffractometer (Philips X’Pert Pro MPD, Eindhoven, Holland). The samples were scanned over a 2θ range of 5° to 45°.
The CrI is determined using the method of Chen et al. 12 (equation (4))
where I002 denotes the maximum diffraction intensity peak of the 002 lattice plane of crystalline cellulose (2θ of ca. 22°) and Iam denotes the diffraction intensity peak for amorphous cellulose (2θ of ca. 18°).
Grey model (GM (1,4)) relating fibre chemical composition to cellulose CrI
To establish the GM (1,4) relating the fibre’s chemical composition to its crystallinity as it is bleached with alkaline peroxide, the contents of hemicellulose, cellulose, and lignin were used as the comparison sequences X1, X2, and X3, respectively, and the corresponding CrI was taken as the reference sequence X0. The chemical constituents of the fibre samples were initialized to decrease the discretization of data (equation (5)).
The initialized each line data (hemicellulose content, cellulose content and lignin content corresponding to Table 2) were accumulated to the cumulative sequences
Effect of alkaline peroxide bleaching conditions on cellulose crystallinity index of the palm fibres.

Sample nos. 1–20 were single-factor experiments, and sample nos. 21–29 were orthogonal experiments.
The GM (1,4) is defined by equation (11). 25 The error analysis of GM (1,4) is calculated using equation (12)
In equation (5),

In equation (6),

In equation (7),


In equation (10), b1, b2, b3 and b4 represent grey action, and a is the development coefficient. In equation (11),

In equation (12), δ represents the arithmetic mean error, and
SEM evaluation
Imaging of the fibres was conducted with an SEM (Hitachi S-4800; Hitachi, Tokyo, Japan) under high vacuum.
Dried fibre samples were mounted on aluminium stubs and coated with gold (E-1045; Hitachi, Tokyo, Japan) to make the surfaces conductive. Images were collected using an accelerating beam voltage of 5 kV.
FTIR analysis
The FTIR analyses were recorded using the KBr tablet method with a Fourier transform infrared spectrometer (Nicolet5700; Nicolet, Madison, USA). Spectra were recorded in a wavenumber range of 4000–400 cm-1.
Raman microscopy
Palm fibres before and after alkaline peroxide bleaching were cut into 1-cm slices with a microtome at a slicing speed of 50 mm/s, freezing temperature of –100°C and electro-ion antistatic appliances at 220 V (50/60 H) (Leica EM UC7-FC7 freezing ultrathin slicer; Leica Microsystems, Beijing, China). The sliced samples were placed onto glass slides with iced acetone. The Raman spectra of the samples were recorded from 500 to 3000 cm-1 using a linear-polarized 532-nm laser with an excitation power of 25 mW (XploRA ONETM; Horiba, Shanghai, China).
Results and discussion
Chemical composition analysis
Images of the alkaline peroxide–bleached samples are shown in Figure 1 (numerical labels correspond to Table 2). The colours of the samples were notably different from each other, which was caused by different peroxide bleaching conditions. The untreated (raw) fibres were brown, thick, and stiff (Figure 2(a)). Chlorite delignification of the raw fibres resulted in holocellulose that was white and flexible, which indicated that the contents of pectin and lignin in the fibres had decreased (Figure 2(b)).

Images of the fibre samples treated with alkaline peroxide bleaching (numerical labels correspond to Table 2).
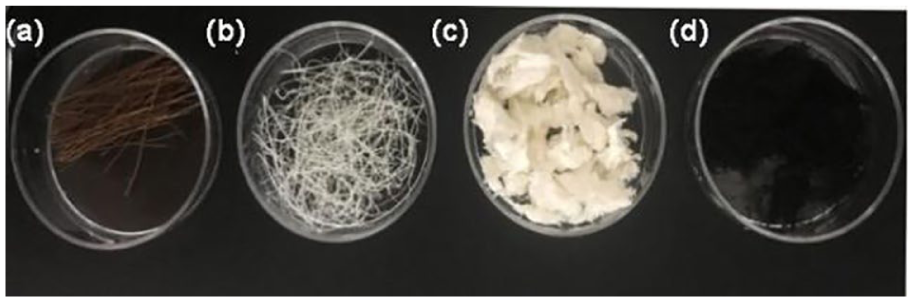
Images of windmill palm fibres: (a) raw fibres, (b) holocellulose fibres, (c) cellulose fibres and (d) acid insoluble lignin.
Cellulose fibres obtained from the holocellulose were bonded to one another by hydrogen bonding (Figure 2(c)) and were similar to bleached pulp fibres. Acid-insoluble lignin was black and sticky owing to the acid hydrolysis isolation procedure (Figure 2(d)). The hemicellulose mass in the fibres was calculated from the differences in the masses of holocellulose and cellulose. The cellulose fraction in the holocellulose was equal to the cellulose mass divided by the holocellulose mass.
The hemicellulose fraction in the holocellulose was equal to the hemicellulose mass divided by the holocellulose mass. The chemical constituents of the samples after alkaline peroxide bleaching are presented in Figure 3. The order of chemical composition was lignin, cellulose and hemicellulose. The various portions of the constituents varied as the peroxide bleaching treatment conditions were altered. Error bars in Figure 3 denote the standard deviations of the averages. The bar indicating the least number of errors of hemicellulose content proved there was a fluctuation in hemicellulose content.
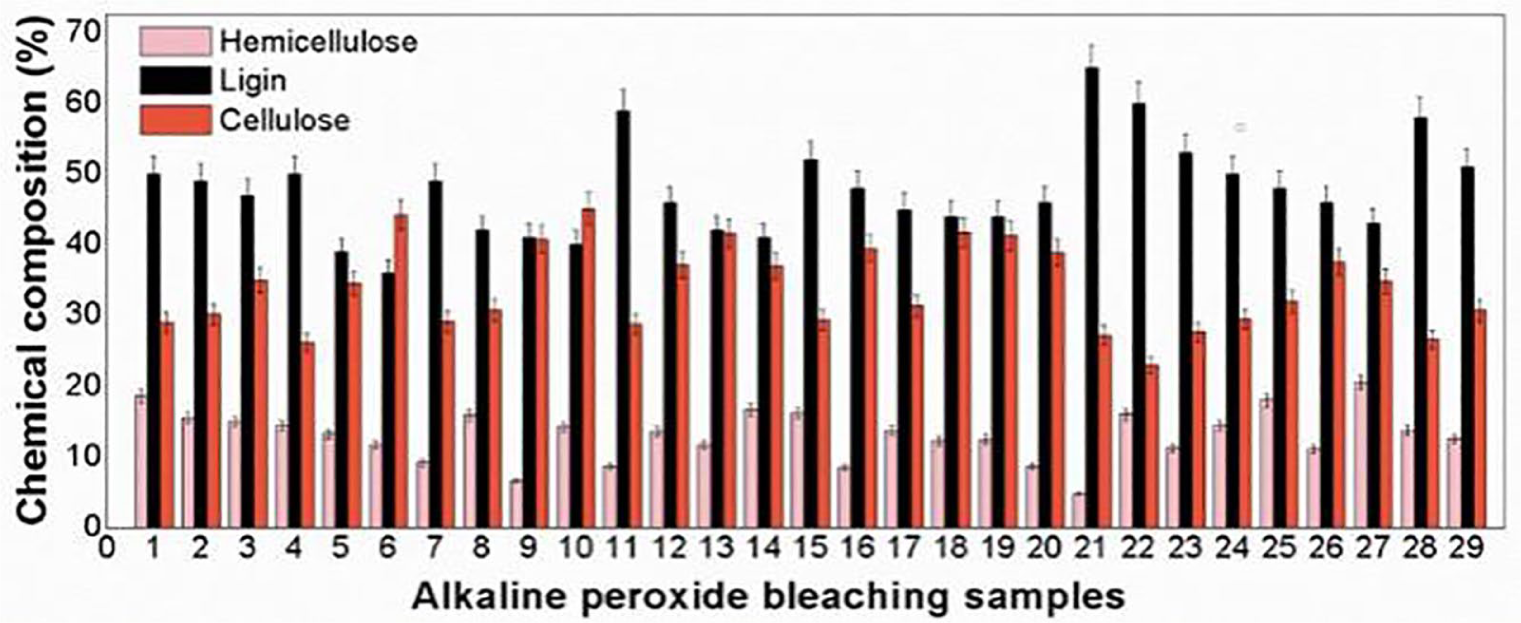
Chemical compositions of windmill palm fibres after various alkaline peroxide bleaching treatments (numerical labels of x-axis correspond to Table 2).
The error bar of cellulose content was moderate, which indicated a middle fluctuation of cellulose content. However, the lignin content with the largest error bar demonstrated that the fluctuation of lignin content was larger than that of the hemicellulose and cellulose content.
Crystallinity analysis
X-ray diffraction (XRD) analyses were conducted on the bleached samples to evaluate their crystallinity indices. Cellulose is a semicrystalline biopolymer that possesses both crystalline and amorphous characteristics in its molecular structure.26,27 As shown in Figure 4, the typical X-ray diffractograms obtained for all of the alkaline peroxide bleaching samples exhibited typical semicrystalline patterns with an amorphous broad hump and a crystallinity peak. 26 All of the samples possessed diffraction peaks centred at ca. 18° (overlapping characteristics of the 101 and 10ī planes of the amorphous cellulose) and ca. 22° (corresponding to the 002 plane of cellulose I). 28

X-ray diffractograms of alkaline peroxide bleaching samples: (a) sample numbers 1–7, (b) sample numbers 8–14, (c) sample numbers 15–21 and (d) sample numbers 22–29.
The cellulose CrI is used to quantify the ordered structure and the crystallinity present in the cellulose. The results from the XRD analyses of the peroxide-bleached samples are presented in Table 2. The highest CrI observed was 58.31%, whereas the lowest CrI observed was 43.75%. These observations indicated that different bleaching conditions affected the palm fibre crystallinity.
GM analysis
The GM (1,4) that related fibre chemical composition to cellulose CrI was determined to be

In equation (13),
It was determined that the grey action of the hemicellulose content was negative, while the grey actions of the cellulose and lignin content were positive (equation (13)). Therefore, the cellulose and lignin content had a positive effect on the fibre crystallinity. Higher cellulose and lignin content resulted in a higher fibre CrI. By contrast, a higher hemicellulose content resulted in a lower fibre CrI. To improve the CrI of the palm fibres, alkaline peroxide bleaching can be used to treat the raw fibres and remove the hemicellulose.
The mean arithmetic error of the GM (1,4) was 0.109, which indicated that the GM relating the fibre chemical constituents to the fibre CrI could be used to predict the palm fibre crystallinity after peroxide bleaching. The optimal peroxide bleaching conditions can be determined to obtain the desired fibre aggregation structure. In order to verify the effectiveness of the GM, the first three alkaline peroxide bleaching schemes were repeated in the experiment, and the crystallinity of the three schemes was 52.95%, 57.72% and 58.43%, respectively. This proved that the mean arithmetic error of the GM (1,4) was less than 0.109.
Morphology of windmill palm fibres
The surfaces of the raw palm fibres were covered with appreciable amounts of silica, pectin, hemicellulose and lignin (Figure 5(a)). Pectin, hemicellulose and lignin were removed to different extents based on their solubility in the bleaching liquor. The amount of each component removed was dependent upon the conditions used during alkaline peroxide bleaching. Silica was noted to be removed from the fibre surface (Figure 5(d)). Windmill palm fibres were almost elliptical in shape. There were sclerenchyma and parenchyma fibres that were clustered into fibrous sheaths around the vascular bundle (Figure 5(b) and (e)).

SEM images of windmill palm fibres: (a–c) raw and (d–f) alkaline peroxide bleached.
Most of the fibres were sclerenchyma fibres that had small cavities and thick cell walls (Figure 5(c)). When compared with the sclerenchyma fibres, the parenchyma fibres had larger diameters and larger cavities, whereas the cell walls were relatively thin. The cell walls of the windmill palm fibres had a laminated structure. A typical multi-layered structure was usually observed in the peripheral part of the fibrous sheath near the parenchyma cells (Figure 5(f)).
FTIR structural analysis
FTIR analyses of the raw fibre and peroxide-bleached fibre were performed from 4000 to 500 cm-1 (Figure 6). The recorded spectra were used to investigate the chemical groups of the windmill palm fibre. The absorption peaks in a range of 3700–3100 cm-1 were assigned to hydroxyl (HO) groups that are found in cellulose, hemicellulose and lignin constituents. 29
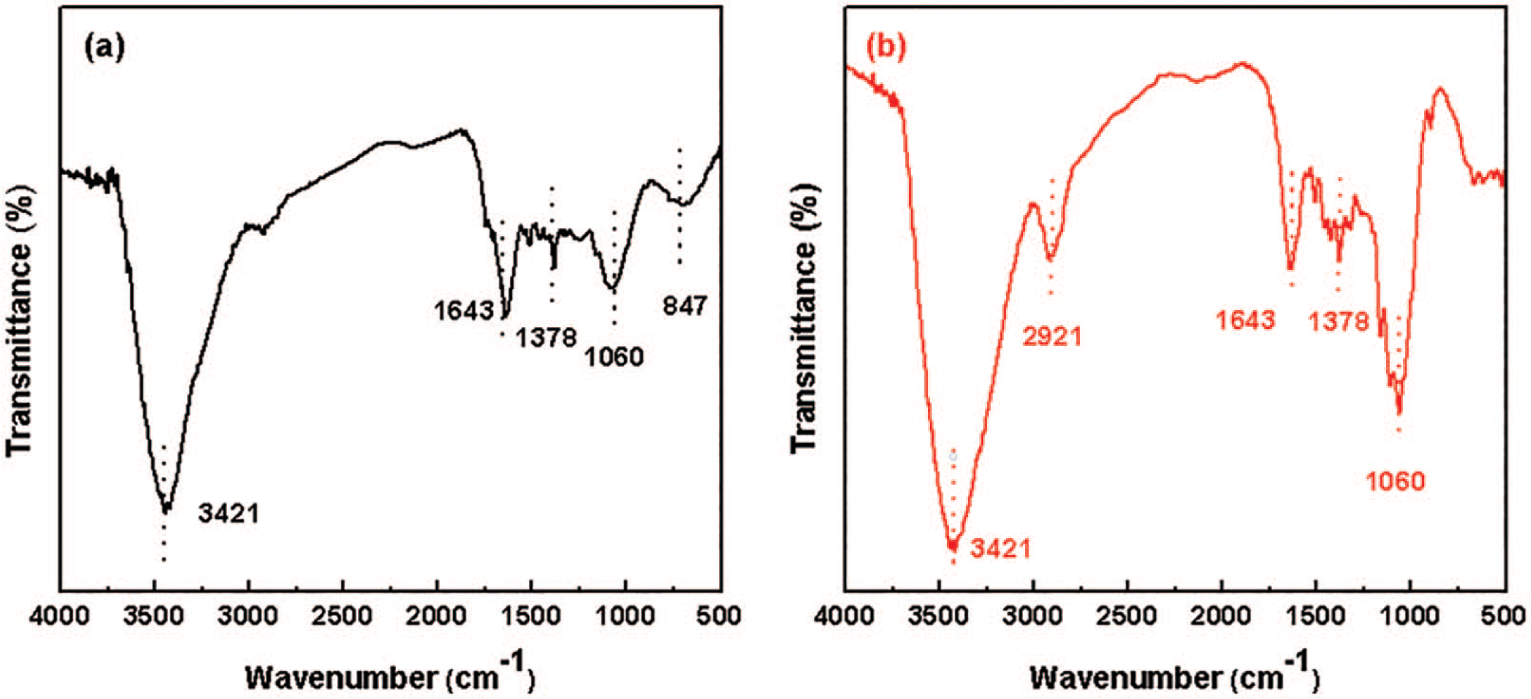
FTIR spectra of windmill palm fibres (a) before and (b) after alkaline peroxide bleaching.
The absorption peaks at ca. 2900 cm-1 and between 1650 and 1630 cm-1 were attributed to C-H and O-H stretching in the lignin and hemicellulose,30,31 respectively. The absorbance band in a range of 1390–1370 cm-1 was associated with the asymmetric vibration of C-O-C structures, which are found in the polysaccharides of holocellulose. 32 The absorbance bands at ca. 1100–1000 cm-1 were attributed to C-O stretching 33 found in the cellulose and hemicellulose.
These different bands could be seen in all of the recorded spectra regardless of whether the palm fibres were treated with alkaline peroxide bleaching. Peaks at 1800–1000 cm-1 indicated the presence of carbonyl groups (C=O) in the lignin and hemicellulose, 34 which were found in the raw fibres. The absorption peak at ca. 1010 cm-1 (Figure 6(b)) was significantly stronger than the absorption peak at ca. 1010 cm-1 (Figure 6(a)). This was mainly caused by increasing the cellulose content after alkaline peroxide bleaching.
Raman microscopy analysis
The Raman spectra of the fibre walls before and after alkaline peroxide bleaching are shown in Figure 7. There were notable absorption peaks at 581, 943, 1096, 1461, 1517, 1628, 2879, 2907, and 2933 cm-1. These were generally attributed to the vibration of molecular groups found in cellulose, hemicellulose and lignin. The Raman band positions in at 579, 581, 943, 2907 and 2898 cm-1 were attributed to the vibration of molecular groups in cellulose and hemicellulose.

Raman spectra of windmill palm fibres (a) before and (b) after alkaline peroxide bleaching.
The most notable peak was around 1094 cm-1, which was ascribed to the asymmetric stretching vibration of the C-O-C group found in holocellulose. The 1094 cm-1 peak was sensitive to changes in the orientation of the cellulose polymer chains; this peak is often used to study the orientation of cellulose microfibrils in the cell walls. The peaks at 2907 and 2898 cm-1 were ascribed to the stretching vibration of C-H and HCH groups that are found in the cellulose polymer. The Raman spectral peaks of the hemicellulose were very similar to those of cellulose. However, the Raman signals of the hemicellulose were weak and broad and were often overlapped by the Raman signals of cellulose. Hence, it is impossible to distinguish the Raman signals of the hemicellulose from those of the cellulose.
The differences between the Raman spectra of lignin and cellulose were notable. The main characteristic peaks of lignin were at 1461, 1517, 1628 and 2933 cm-1. The 2933 cm-1 absorption peak was ascribed to the stretching vibration of the methoxyl (-OCH3) group on the aromatic ring of lignin. The intensity peak at 1461 cm-1 was attributed to bending vibrations of HCH and HOC of lignin and cellulose. The absorption at 1517 cm-1 was caused by the stretching vibrations of the aromatic rings of lignin. The vibration at 1628 cm-1 was attributed to the aromatic ring of guaiacyl-type moieties. The peak width at 1461 cm-1 for the alkaline peroxide sample was wider than that of the untreated (raw) sample. This observation suggested that the crystallinity of the cellulose in the alkaline peroxide sample was higher than in the untreated (raw) sample.
Conclusion
A GM (1,4) relating fibre chemical composition to the cellulose CrI was developed based on experimental data. It was concluded that higher levels of cellulose and lignin in the alkaline peroxide–bleached fibres resulted in a higher cellulose CrI of the fibres. By contrast, a higher hemicellulose content in the alkaline peroxide–bleached fibres resulted in a lower cellulose CrI of the fibres. The mean arithmetic error of GM (1,4) was 0.109, which indicated that the GM could predict fibre crystallinity based on its chemical composition. This GM can be used to study how the aggregation structure of the palm fibres is altered via alkaline peroxide bleaching. Crystallinity size is an important factor that affects the fibre mechanical property. In addition to the GM, the Hall–Petch effect and fractal theory can be used to analyse the fibre crystallinity.11,35,36
The surfaces of raw palm fibres were covered with appreciable amounts of silica, pectin, hemicellulose and lignin. Pectin, hemicellulose and lignin can be removed from the fibres via alkaline peroxide bleaching treatment. Silica was also removed from the fibre surfaces during bleaching. The windmill palm fibres were almost elliptical in shape, and the fibre walls ranged from thick to thin. These fibres were clustered to form fibrous sheaths around the vascular bundle.
Both FTIR and Raman microscopy analyses indicated that the raw (untreated) fibres were rich in lignin and lean in cellulose content. The cellulose content increased relative to the decrease in hemicellulose and lignin levels when the fibres were bleached with alkaline peroxide. The changes in chemical composition from different alkaline peroxide bleaching process parameters resulted in a difference in the CrI of the treated samples. The developed GM (1,4) can be used to predict the windmill palm fibre CrI based on how bleaching affects the fibre chemical constituents. The optimal alkaline peroxide bleaching conditions can be determined to acquire the ideal fibre aggregation structure.
Footnotes
Declaration of conflicting interests
The author(s) declared no potential conflicts of interest with respect to the research, authorship, and/or publication of this article.
Funding
The author(s) disclosed receipt of the following financial support for the research, authorship, and/or publication of this article: This work was funded by the Qing-Lan Project of the Jiangsu Higher Education Institutions of China ((2017)15/(2019)3); the Brand Professional Construction Funded Projects of Jiangsu Province, China (No. PPZY2015C254); the Natural Science Foundation Project of Jiangsu Province, China (No. 17KJD540001); the Project of Yancheng Polytechnic College (2018/2019HX-05); the scientific research platform open project of Yancheng Polytechnic College (201707/201805); the Funded Project of Overseas Research and Study Plan of Jiangsu Universities in 2017 (No. 314); the scientific research platform open project of Yancheng Polytechnic College (YGKF-201804); and the Jiangsu Overseas Research & Training Program for University Prominent Young & Middle-Aged Teachers and Presidents in 2016.