
Abstract
Compression garments apply garment pressure to suppress growth and flatten hypertrophic scars caused by serious burns. In order to reduce the pain caused by a trial-made compression garment for burn patients, one of the most studied parts of the human body, the arm, was selected as the research object, and the characteristics of an arm model that could be used for compression sleeve design and garment pressure measurement were studied. Five human arm models were made based on three-dimensional-printing technology, and then a compression sleeve was made based on Laplace’s law. After that, the garment pressures that the compression sleeve applied on the five human arm models and on a real human arm were tested. Finally, the garment pressure magnitudes and the distribution on a real human arm and on each arm model were compared and analyzed. The results show that when other conditions were consistent, the garment pressure on the arm model was inversely proportional to the hardness of the model, and the garment pressure magnitudes and the distribution on the model whose hardness was close to that of a real human arm were very similar to those of a real human arm. Moreover, consistent with the previous research results, the garment pressure of the compression sleeve that was made based on Laplace’s law increased with the increase of the arm circumference, and it decreased with decreasing circumference. The results of this study can provide a reference for the exploration of a mannequin that can substitute for a real human body in the design of compression garments.
Introduction
Hypertrophic scarring is one of the serious complications after a deep burn, 1 and its incidence rate after a burn is as high as 91%. 2 This scarring not only seriously affects body function and aesthetics, but also causes anxiety, depression, or sleep disorders due to pain and paresthesia and significantly reduces the quality of life for patients. 3 Pressure therapy is one of the most effective methods to flatten and suppress the growth of hypertrophic scars caused by serious burns. 4 The treatment principle of pressure therapy is that compression garments can apply a certain amount of pressure (namely, garment pressure) 5 to human bodies. 6 Therefore, the magnitude of the garment pressure applied by a compression garment on skin is the key to determining its efficacy.7–8 According to repeated clinical trials and studies, it has been reported that garment pressures between 20 and 25 mmHg had better therapeutic effect on hypertrophic scars. 9 Therefore, the design of a compression garment that can accurately apply specific garment pressure is crucial for achieving the precautionary and therapeutic effectiveness of hypertrophic scars.
For burn patients, due to individual differences, irregular shapes of different parts of the body, and differences in skin hardness and elastic moduli, even tailored compression garments need to be fitted and garment pressure need to be measured, in order to adjust the sizes of compression garments and get the required garment pressure. For patients with moderate and severe burns, compression garments will be worn as soon as the wound surfaces are healed, and the affected areas will be relatively fragile at this time. The sizes of the compression garments are much smaller than the sizes of the patients’ bodies. Repeated fitting and garment pressure measurement will bring obvious pain to the patients, and will even cause secondary trauma. Therefore, it is necessary to study the design of non-contact compression garments and pressure test methods for burn patients. At present, contactless methods include the theoretical calculation method10–14 and the compression garment design methods based on mannequins.15–21 In view of the difficulty and complexity of the theoretical calculation method, many scholars have turned their attentions to mannequins for the design of compression garments and the evaluation of garment pressure.
Yu et al. 15 developed a mannequin with a bone skeleton, imitating soft tissue and skin. It was reported that the mannequin could provide a novel tool for testing the performances of pressure garments. Fan and Chan 16 used a mannequin dummy to test the garment pressure of girdles, and the prediction equations of the model were efficient in estimating garment pressure on human bodies. Bi 17 studied an adult female upper body movable software dummy and made the bones, muscles, and skins as real as possible, and the experimental results showed that the model could replace a real human body for a garment pressure test. Xu 18 developed an adjustable software dummy that was composed of bone, skin, and a control system. A linear relationship between the skin hardness of the dummy and that of a real human body was found, and a relationship between the garment pressure of the dummy and that of a real human body was obtained as well. In the research of Wang et al., 19 a mannequin with the dimensions of a standard female body was developed for testing garment pressure. The mannequin could extend transversely at the postmedial and antemedial lines to a maximum level of 5 cm. The results showed that the garment pressure distribution showed obvious differences among the measuring points. Wang et al. 20 used modeling and three-dimensional (3D)-printing technology to establish a human leg model based on Chinese adult body size standards, and the simulation effect of the leg model was verified by testing the garment pressure distribution of a compression sock.
The accuracy and the material biofidelity of the mannequins in the above studies reached a high level, and in recent years, a dynamic garment pressure test has been achieved. However, the mannequins developed by predecessors in this area were usually complicated and they had longer production phases and higher costs, mostly integrating the group characteristics and rarely realizing the customization of specific human bodies and their special parts. Therefore, these mannequins were not conductive to application and popularization.
The purpose of this study is therefore to develop simpler, shorter phases and lower costs for a mannequin manufacturing method to substitute for a real human body and to make compression garments and test garment pressure. For burn patients, the arm is one of the most researched burned parts of a human body and the shape and structure of the arm are relatively regular and easy to study. Therefore, the arm of a human body was selected as the research object in this study. First, the external contour data for a human arm were collected by the laser scanning method, and arm models with different hardnesses were made. Then, a compression sleeve was made based on the method of Maklewska et al. 21 and the garment pressure was tested after the compression sleeve was worn on the real human arm and each arm model. Finally, the characteristics of the arm model that could be used for compression sleeve design and garment pressure measurement were studied by analyzing the test results.
Make arm model
The 3D data of a human arm were obtained with a 3D laser scanner, and a resin arm model shell (used for casting the arm model) and a resin arm model were printed by a 3D printer. Five kinds of arm models with different elastic moduli and hardnesses were obtained by injecting gypsum and vulcanized silicone rubber materials into the shell of the resin arm model, respectively.
Materials and devices
The right arm of a healthy Chinese female subject (age 28 years, with a height of 159 cm and a body mass of 51.8 kg) was recruited.
Vulcanized silicone rubber, photosensitive resin, and gypsum were used as the materials of the arm models.
The devices used included a VTOP600H hand-held laser scanner and a SPS450H photosensitive resin 3D printer.
Production processes
1. The external contour data of the subject’s right arm were collected by scanner.
2. The model data were imported into Geomagic Studio 2013 to process and repair the model. The processed model is shown in Figure 1. Then, the model was treated with an external expansion and an internal expansion with thicknesses of 3 mm.
3. Based on the above-processed data of a human arm model, the model entity was printed to complete the transformation from the data to the model. The model with external expansion was printed to obtain the mold (as shown in Figure 2) for the casting of the resin arm models. The model with internal expansion was printed and used as a photosensitive resin arm model (see Figure 3, and named #5) for the garment pressure test.
4. Silicone rubber casting materials are made of two components, component A and component B, with three different hardnesses. In this case, component A was silica gel liquid and component B was the curing agent. Different types of silicone gel liquid were used to obtain the silicone rubber arm models with different hardnesses, and these models were successively named #1, #2, and #3.
5. Gypsum powder was mixed with water with a ratio of 2:1 by volume. After mixing, the liquid was poured into the mold (Figure 2) to make the plaster arm model (named #4).

Arm model processed by Geomagic Studio software.

The mold for the casting of the resin arm models.

Photosensitive resin arm model.
Examination of the hardnesses and the elastic moduli
The hardness and elastic modulus of each model were tested by a Shore Hardness Tester and Dynamic Thermomechanical Analyzer. The results are shown in Table 1.
The hardness and the elastic modulus of each mode.

A correlation analysis was made for the hardness and the elastic modulus of each arm model in Table 1 (not including the data of the real human arm, because it is difficult to test the elastic modulus of a real human body). It was found that there was a positive correlation between the hardness and the elastic modulus (within this range of hardnesses and elastic moduli), with a correlation coefficient above 0.9. Therefore, in the subsequent test analysis, it was considered that the influence trends of the elastic moduli and the hardnesses of various model materials made in this study of garment pressure were consistent. In the follow-up study of the relationship between the material properties of the arm models and the garment pressure, only the influence of the models’ hardnesses on the garment pressure was studied.
Production of the compression sleeve
The compression sleeve fabric used in this experiment was one of the fabrics commonly used in a hospital burn department. The starting point of the compression sleeve was the styloid process of the ulna on the wrist. Thirteen test circles were marked along the length of the arm, and each test circle was 3 cm apart. The corresponding circumference sizes were measured. The compression sleeve was made based on the method of Maklewska et al., 21 and the preset pressure was 24 mmHg.
To test the garment pressure systematically and comprehensively, the compression sleeve mentioned above was put on the arm of the female subject in order to divide the grids before testing. As shown in Figure 4, the notation of every column of grids was composed of numbers while that of every row was composed of alphabets, that is, the grids that ran down from the top of the first left column were named A1, B1, C1, to N1 and the grids of the first row from the left to the right were named A1, A2, A3, to A22.

Grid marks on the compression sleeve.
Measurement and analysis of the garment pressure
The garment pressures of the real human arm and the #1–#5 arm models were tested by Flexiforce A201 pressure sensor after wearing the sleeve. The pressure sensor was placed in the center of each grid of sleeve (shown in Figure 4, and the area of each grid is about 1 cm2) for testing, so as to ensure the accuracy and representativeness of the test data. Garment pressure was tested three times on each grid, and three data were averaged for subsequent experimental analysis.
Longitudinal distribution of the garment pressure
The longitudinal garment pressure distributions of the real human arm and the #1–#5 arm models after wearing the sleeve are shown in Figures 5 to 10, and the longitudinal garment pressure magnitudes and distributions of the real human body and arm models were analyzed.

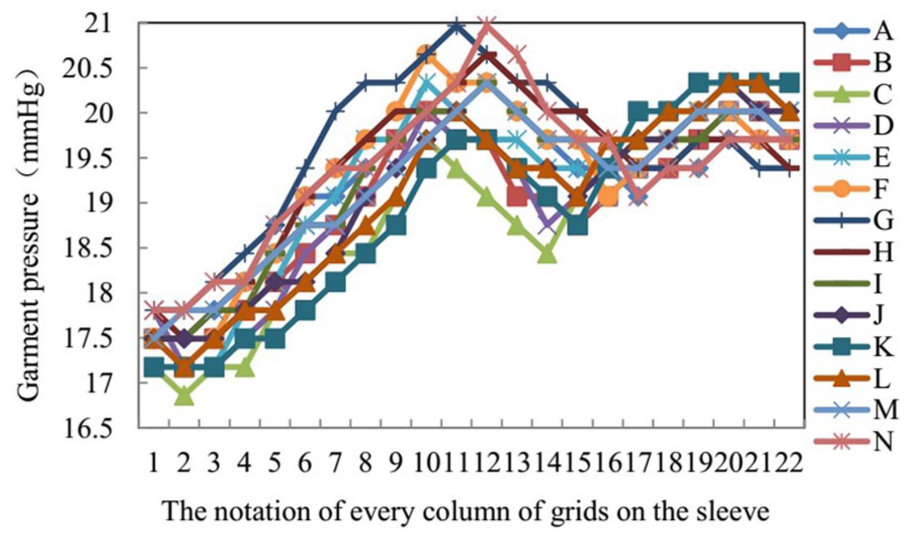
Longitudinal garment pressure distributions of the real human arm.

Longitudinal garment pressure distribution of the #1 arm model.

Longitudinal garment pressure distribution of the #2 arm model.

Longitudinal garment pressure distribution of the #3 arm model.
Longitudinal garment pressure distribution of the #4 arm model.

Longitudinal garment pressure distribution of the #5 arm model.
As can be seen from Figure 5, (1) the garment pressure magnitudes of each column of the grid on the real human arm were between 20.5 and 24 mmHg. These values were within the range of the optimal garment pressure for suppressing the growth and flattening of hypertrophic scars caused by serious burns. 9 (2) The garment pressure applied by the sleeve on the arm gradually increased from the wrist to the end of the forearm as a whole. From columns 1 to 3, that is, at the wrist of the forearm, the garment pressure was the lowest of the overall values. This may have been because the muscle quantity of the forearm muscle in these places was less here, and the circumference of the arm was smaller here. From columns 3 to 12, the garment pressure increased to the highest point, since the circumference of the forearm increased to the maximum, and the soft tissues such as muscles were relatively thick here and had good elasticity (lower hardness). Columns 14 and 15 were located at the elbow joint of the arm, and due to the physiological structure of the elbow, the curve of the body surface changed, which made the garment pressure at the concave part of the arm lower. Through the elbow of the arm to the upper arm, the circumference of the upper arm gradually increased and the corresponding garment pressure gradually increased. As the circumferences of columns 21 and 22 decreased, the garment pressure decreased gradually. (3) A special point that should be noted was located at D1. Its garment pressure value was significantly higher than those of the surrounding test points were. The reason for this may be that this point was located at the styloid point of the ulna of the arm, and the protruding surface made the garment pressure value here significantly larger.
From Figure 6, it can be seen that the compression sleeve applied higher garment pressure on the #1 arm model, between 24 and 30 mmHg, higher than the set garment pressure of 24 mmHg.
It can be seen from Figure 7 that after wearing the sleeve, the garment pressure magnitudes of each column of grids on the #2 arm model were between 21.5 and 25 mmHg, and the pressure value was within the optimal garment pressure range for preventing and controlling a hypertrophic scar. The longitudinal garment pressure distribution on the #2 arm model after wearing the sleeve was also similar to that of the real human arm mentioned above. In addition, the hardness of the #2 arm model was similar to that of the real human arm (see Table 1).
Figure 8 shows that compression sleeve applied lower garment pressure on the #3 arm model, between 18 and 23 mmHg, which was not in the optimal garment pressure range for preventing and controlling a hypertrophic scar in some positions.
Figure 9 shows that the compression sleeve applied lower garment pressure on the #4 arm model, between 16.5 and 21 mmHg, and it was basically not in the optimal clothing pressure range to suppress the growth and flatten the hypertrophic scars caused by serious burns.
Similar to the #4 arm model, the garment pressure applied by the compression sleeve on the #5 arm model was lower, between 15.5 and 19.5 mmHg, and it was absolutely not in the optimal clothing pressure range to prevent and control a hypertrophic scar.
Interfacial pressure of each cross section of the human arm
It can be seen from Figures 5 to 10 that only the #2 human arm model’s garment pressure magnitudes and distributions were similar to those of a real human body. Therefore, in order to further verify the above research results and explore the interfacial pressure of each cross section of the human arm, the garment pressure magnitudes and distributions that were applied by a compression sleeve on the real human arm and the #2 arm model were analyzed. Figures 11 and 12 show the garment pressure magnitudes and the distributions of each cross section of the real human arm and the #2 arm model.

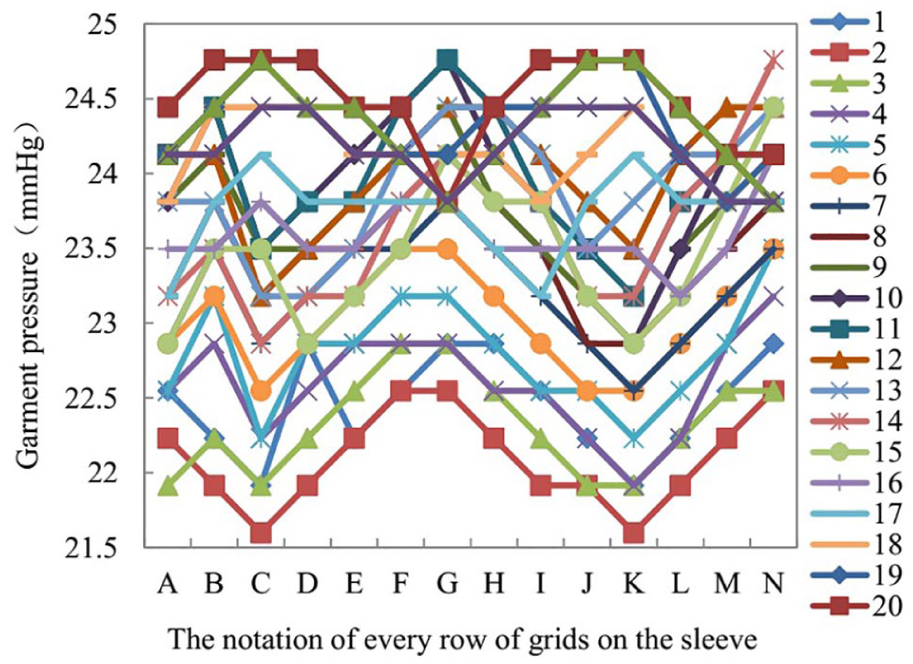
Interfacial pressure of each cross section on the real human arm.
Interfacial pressure of each cross section on the #2 arm model.
As can be seen from Figure 11, similarly to Figure 5, the garment pressure magnitudes of each row of the grid on the real human arm were between 20.5 and 24 mmHg. However, the interfacial pressure of each cross section on the same column line of the arm varied greatly; the differences were in the range of 3.5–4.5 mmHg. In the figure, the columns 1–16 refer to the position of the forearm to the elbow. Row G and row N were the positions with the maximum garment pressure in each column position, while row C and row K were generally the positions with the minimum garment pressure in each column position. The reason for this may be that the radius and ulna for three prisms, and the forearm muscle group are attached to the bone, so the forearm section presents as the oval. On the same cross section, the connection between the G and N points can be viewed as the long axis of the ellipse section, and the connection between the K and C points can be seen as the short axis of the elliptical cross section. By the Laplace formula (Garment pressure (Pa) = Tension per unit fabric length (N/m)/Radius of curvature of the circular surface(m)), 22 the smaller the radius of curvature is, the greater the pressure is. Therefore, at the same cross section, the G and N points had smaller radii of curvature, which led to larger garment pressure, and the C and K points had bigger radii of curvature, which led to the smaller garment pressure values. For the columns 17–22, which refer to the position of the upper arm, row C and row K were the positions with the larger garment pressure in each column position. This may have been due to the C and K rows on the upper arm being located in the most developed places of the triceps and the biceps muscle belly. This was more prominent at the same cross section. Therefore, compared with the other points at the same cross section surface, the curvature radii of the C and K points were larger, and according to the Laplace formula, the larger the radius of curvature is, the smaller the garment pressure is.
It can be seen from Figure 12 that (1) the magnitudes of the garment pressures of the #2 arm model were between 21.5 and 25 mmHg, just in the range of the optimal garment pressure values for preventing and controlling a hypertrophic scar. (2) The garment pressure magnitudes and the distribution of each test point on the same cross section surface were similar to those of the real human arm in Figure 11. Again, this was proved that #2 arm model, which had a similar hardness to a real human arm, can replace a real human arm to make compression garments and to test garment pressure.
Longitudinal garment pressures on different arm models and a real human arm
In order to clearly compare the garment pressure magnitudes and the distributions of the real human arm and each arm model after wearing the sleeve, the average garment pressure of each cross section of the real human arm and of each arm model was calculated, as shown in Figure 13.

Longitudinal garment pressure distribution of the real human arm and each arm model.
Some conclusions could be drawn from Figure 13: (1) The longitudinal garment pressure distributions of the real human arm and each arm model were consistent. The longitudinal garment pressure started from low to high, reached the highest point around column 11, then decreased and reached a trough at column 15 in the longitudinal position, and then continued to increase. In short, the change trend of garment pressure was consistent with the change trend of the physiological curvature of the arm surface, and the garment pressure was larger in the larger circumference place and smaller in the smaller circumference place. (2) With the increase of the hardness of the arm model, the garment pressure value gradually decreased; that is, the hardness of the arm model was inversely proportional to the garment pressure value. The reason for this may be that the lower the hardness of the model was, the greater the deformation when wearing the pressure clothes was, and the greater the elastic recovery after deformation was, so that the greater the deformation of the fabric was, and the greater the garment pressure was. (3) The test results of the garment pressure of the #2 arm model and the real human arm were extremely similar. This further shows that the #2 arm model is best suited to replace a real human arm for compression garment design and garment pressure measurement, and the hardness and elastic modulus values of the #2 arm model can be referred to in making a model to replace a real human arm.
Conclusion
To study the models that can replace real human bodies for the design of compression garments and for garment pressure measurement, 3D printing technology was used to make five human arm models with different hardnesses and elasticity moduli. By testing the garment pressure and analyzing the test results, the garment pressure magnitudes and the distributions of the arm models and the real human arm were obtained, and the characteristics of the arm model that could replace a real human body were found.
The lower the hardness and the elastic modulus of an arm model were, the higher the garment pressure on it was; that is, the hardness and the elastic modulus of the model were inversely proportional to the garment pressure. The garment pressure magnitudes and the distribution of the #2 arm model were extremely similar to those of a real human arm. This means that the #2 arm model is best suited to replace a real human arm for compression garment design and garment pressure measurement, and the hardness and the elastic modulus values of the #2 arm model can be referred to in making a model to replace a real human arm. The garment pressure applied by the compression sleeve on the arm models and the real human arm was consistent with the change trend of the physiological curvature of the arm surface. The garment pressure on the convex points was larger, whereas the garment pressure on the concave points was smaller. A possible reason for this is that the curvature radius of the position where the arm protruded more significantly was smaller, so the garment pressure on the arm increased according to the Laplace’s Law, and the garment pressure likewise decreased when the curvature radius was larger. In addition, the garment pressure increased with the increase of the arm circumference, which may have been caused by the fact that the compression garments made based on Laplace’s law exerted less pressure on the limbs with smaller circumferences, which is also consistent with the previous research results. 6 In the future, when a burn patient needs to wear compression garment, the data of the patient’s body surface can be obtained by 3D scanning, and a model with a similar hardness to that of the burn site can be made by 3D printing. This model can then replace the human body in testing garment pressure and modifying the sizes of the compression garment. The research results of this study can improve the design accuracy of a compression garment and reduce the pain for burn patients.
Footnotes
Acknowledgements
The authors would like to thank the Tianjin Visen Technology Co., LTD for scanning the external contour data of the subject’s right arm.
Declaration of conflicting interests
The author(s) declared no potential conflicts of interest with respect to the research, authorship, and/or publication of this article.
Funding
The author(s) disclosed receipt of the following financial support for the research, authorship, and/or publication of this article: The work was supported by the China Scholarship Council (No. 201809345023).