
Abstract
Behavior of woven fabrics during complex deformations is most influentially affected by their shear behavior. Shear characteristics of woven fabrics can be explained by fabric shear rigidity and shear hysteresis. In this study, the effects of weft density, weft count, and fiber type on shear behavior of woven fabrics in the principal directions of fabric were statistically evaluated. Statistical methods such as multiple linear regression analysis, univariate test, and correlation analysis were also applied. The univariate test results confirmed that the weft density is the most dominant parameter that affects fabric shear properties. Multiple linear regression results point to poor shear behavior in woven fabrics with cotton weft yarns. In addition, correlation between the shear rigidity of the fabrics along principal directions with the Milasius fabric firmness factor and the fabric cover factor as integrated structural parameters was established. High correlation was found to exist among Milasius fabric firmness factor, fabric cover factor, and shear rigidity of fabrics along principal directions.
Keywords
Introduction
Woven fabrics are subjected to a wide range of complex deformations during usage. 1 The trellis-like manner in which the woven fabrics readily deform is the essential mechanical difference between woven fabrics and other sheet materials. 2 In woven fabrics, in-plane shear deformation is induced due to the occurrence of double curvature or more complex geometries. In-plane shear together with bending of woven fabrics crucially determine the fabric drape, which is defined as the ability of the fabric to fit onto a three-dimensional object. 3 The shear behavior of woven fabrics is a mechanical feature that determines the suitability of the fabric as apparel. The drape, handle, and pliability are fabric properties that are affected by fabric shear behavior.4–7 Fabric shear rigidity which is much less than fabric tensile rigidity affects both fabric strength and bending properties of the woven fabrics. 8
The three major experimental methods by which the shear behavior of thin fabrics can be evaluated are as follows.9–11
Simple shear method on which Kawabata Evaluation System for Fabrics (KES-F) is based;
Bias extension of sample cut at 45° relative to warp or weft directions;
Picture frame method in which the fabric is held in a ring frame.
None of the aforementioned methods can be used as a standard test method in the determination of in-plane shear behavior of fabrics. 10 This is due to the fact that all the stated methods suffer from limitation and uncertainties in exerting pure shear stress on the fabric during test.12–17 Hu and Zhang 13 have stated that during the simple shear test, the variation in shear stress along the longer direction is not uniform. Dridi et al. 14 have stated that during the bias extension test the strain distribution in the fabric specimen is highly nonuniform due to the existence of distinct deformation zone propagation. As far as picture frame test is concerned, Sun and Pan 16 have confirmed that two types of forces, that is, shear and tensile, act on the sample. It must be emphasized that for small shear angle the tensile force can be neglected.
In regard to the evaluation of the woven fabric shear behavior, there are many published works. In these works, not only the differences and limitations of various measuring methods have been examined but also the mechanical and geometrical models that simulate shear of the woven fabrics have been developed. The shear behavior of woven fabrics in various directions was investigated by Lo and Hu 18 and was concluded that a strong linear relationship exists between the shear rigidity and shear hysteresis in both principal and various bias directions. The shear behavior of plain woven fabrics was also experimentally and theoretically investigated by Penava et al. by using a simple shear method and elastic theory. It was found that not only shear modulus is almost symmetrical to angle 45° but also the maximum shear modulus occurs exactly at 45° angle. 19 In a study by Naujokaitytė et al., 20 buckling point and changes in surface irregularity during uniaxial extension of fabric were examined using the image analysis method in conjunction with the bias extension test that traces characterizing parameters related to fabric shear behavior. It was observed that the critical shear angle increases negligibly with an increase in the stiffness of fabric due to the ability of stiffer fabric in supporting higher transverse compressive stresses prior to buckles. Leung et al. 21 experimentally investigated the relationships among fabric formability, bias extension, and shear resistance using 31 samples, which were composed of 15 pure wool, 12 wool/polyester blends, 1 wool/rayon blend, and 3 pure linen suiting and trouser cloth with mass per unit area in the range of 125–258 g/m². It was concluded that no strong relationship exists between the fabric formability and shear rigidity as measured by either the bias extension test or by the Kawabata Evaluation System (KES) shear tester. However, significant correlations exist among the different parameters of the bending and shear tests and also between the hysteresis parameters of these two mechanical deformations. The shear behavior and buckling phenomenon of plain woven fabrics were analyzed during the uniaxial tension of a bias cut specimen based on the image analysis technique of Domskienė and Strazdienė. 11 It was established that fabric post-buckling is associated with fabric behavior in the tension and properties of a specimen. El Abed et al. 15 not only compared shear rigidity of 10 samples of woven fabrics using KES, bias extension, and shear frame test methods but also analyzed the shear relaxation of the samples using the linear viscoelastic theory and concluded that the results of the KES and picture frame test methods are very compatible. Taha et al. 10 used samples of plain fabrics woven with Egyptian jute fiber at various weights and investigated samples’ shear behavior in terms of shear forces, shear angles, and shear lock angles, using the bias extension and the picture frame test methods. An important outcome of this work was the adaptability of both test methods for natural fiber examination. Moreover, it was reported that the shear lock angle values are inversely proportional to the trends indicated by the shear force. Generally, fabrics showing low shear resistance have high lock angles, indicating the occurrence of wrinkling at higher deformations. Bilisik22,23 measured the shear behavior of fabric using the pull-out test method. Results showed that the yarn pull-out test was suitable for measuring fabric shear properties. Lomov et al. 24 studied the shear behavior of glass and glass/polypropylene (PP) woven reinforcements using the picture frame test with the optical registration of the shear angle field. Effect of shear deformation and pre-strain on the compression behavior of steel and glass fiber knitted fabrics was analyzed by Barburski et al. 25 The results showed the effect of tension and shear force on the thickness variation in the relaxed fabric. It was reported that shear angle more than 25° can lead to fabric wrinkling. Barburski et al. 26 studied the internal structure of woven fabrics in a sheared state based on X-ray micro-CT (micro-computed tomography) imaging of the internal structure of woven fabrics in a sheared state. Carrera-Gallissà et al. 27 analyzed the correlation between KES-F and the UPC ring methods. The results of this research testified the effectiveness of the UPC ring method as an industrially attractive alternative to KES-F instrument. Haghighat et al. 28 evaluated initial shear modulus of twill woven denim fabrics in terms of their mechanical and geometrical properties. The predicted initial shear moduli were compared with experimentally obtained moduli using FAST instrument. The results showed that the predicted and experimental shear moduli are linearly correlated (R2 = 0.904) with a performance factor (PF/3) value of 15%.
Fabric integrated structural factors are always mathematically expressed based on the comparison with the structural properties of a standard fabric which has the maximum value of the intended parameters such as fabric sett or fabric cover factor. Structural factors characterize cloth structure and analyze their advantages or shortcomings. 29 By using these factors, woven fabrics can be engineered to be suitable for any end-uses. The two integrated structural factors that are frequently used to study the weaving process and the fabric properties are the fabric cover factor suggested by Pierce and the fabric firmness factor. The latter can be estimated by the Newton method (1995), Brierley’s theory (1952), and Milasius firmness factor (2000).29,30 The fabric cover factor is a measure of the fabric surface covered by warp and weft yarns, whereas the firmness factor is more or less related to the ratio of a given sett of a fabric to maximum sett of a standard fabric.
In this article, in order to calculate the firmness factor of the samples, Milasius fabric firmness factor (MFFF) based on equation (1) was used as follows 29

where T1 and T2 are, respectively, warp and weft counts (tex); S1 and S2 are, respectively, warp and weft densities per decimeter; and P is the Milasius weave factor which is 1 for plain weave.
The fabric cover factor was also determined using equation (2) (FCF (%)) 31
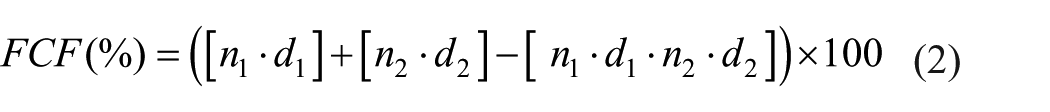
where n1 and n2 are the warp and weft density per cm, and d1 and d2 are the warp and weft yarn diameter (cm), respectively.
It is obvious that the shear rigidity and shear hysteresis of woven fabrics could be mainly dependent on the warp and weft yarns’ frictional behavior at intersection points, yarns’ bending rigidities, and also number of intersections per unit area of the fabric. Review of the published scientific literature indicated a limitation and marginal works devoted to investigation of the effectiveness of structural parameters of woven fabrics on their shear properties. Thus, the aim of this work is to evaluate statistically the effect of structural parameters such as weft density, count of weft yarn, and fiber type on the shear rigidity and shear hysteresis of plain woven fabrics in the principal directions. The relationships between Milasius fabric firmness factor and fabric cover factor with woven fabric shear rigidity and shear hysteresis at 0.5° and 5° shear angles in the principal directions were also investigated.
Experimental
Yarn and fabric manufacturing and testing
Characteristics of six weft yarns composed of cotton, polyester, and viscose fibers with nominal count of 29.5 and 19.68 tex spun on a Zinser319 ring frame at a spindle speed of 12,500 r/min are shown in Table 1. Tensile properties of these yarns were measured according to the ASTM-D2256:2015 32 method using the Zwick tensile tester equipped with 500 N load cell at a constant rate of elongation mode. Yarn frictional coefficient is known to be one of the most important parameters that affect shear characteristics of woven fabrics. Thus, the mean value of five tests of yarns to metal frictional coefficient was measured using the Shirley friction tester. The yarn diameter was calculated based on the equation proposed by Grossberg as shown in equation (3), 33 where d is the yarn diameter (cm), Ty is the yarn count (tex), and ρf is the fiber density per (g/cm3)

Yarn characteristics.
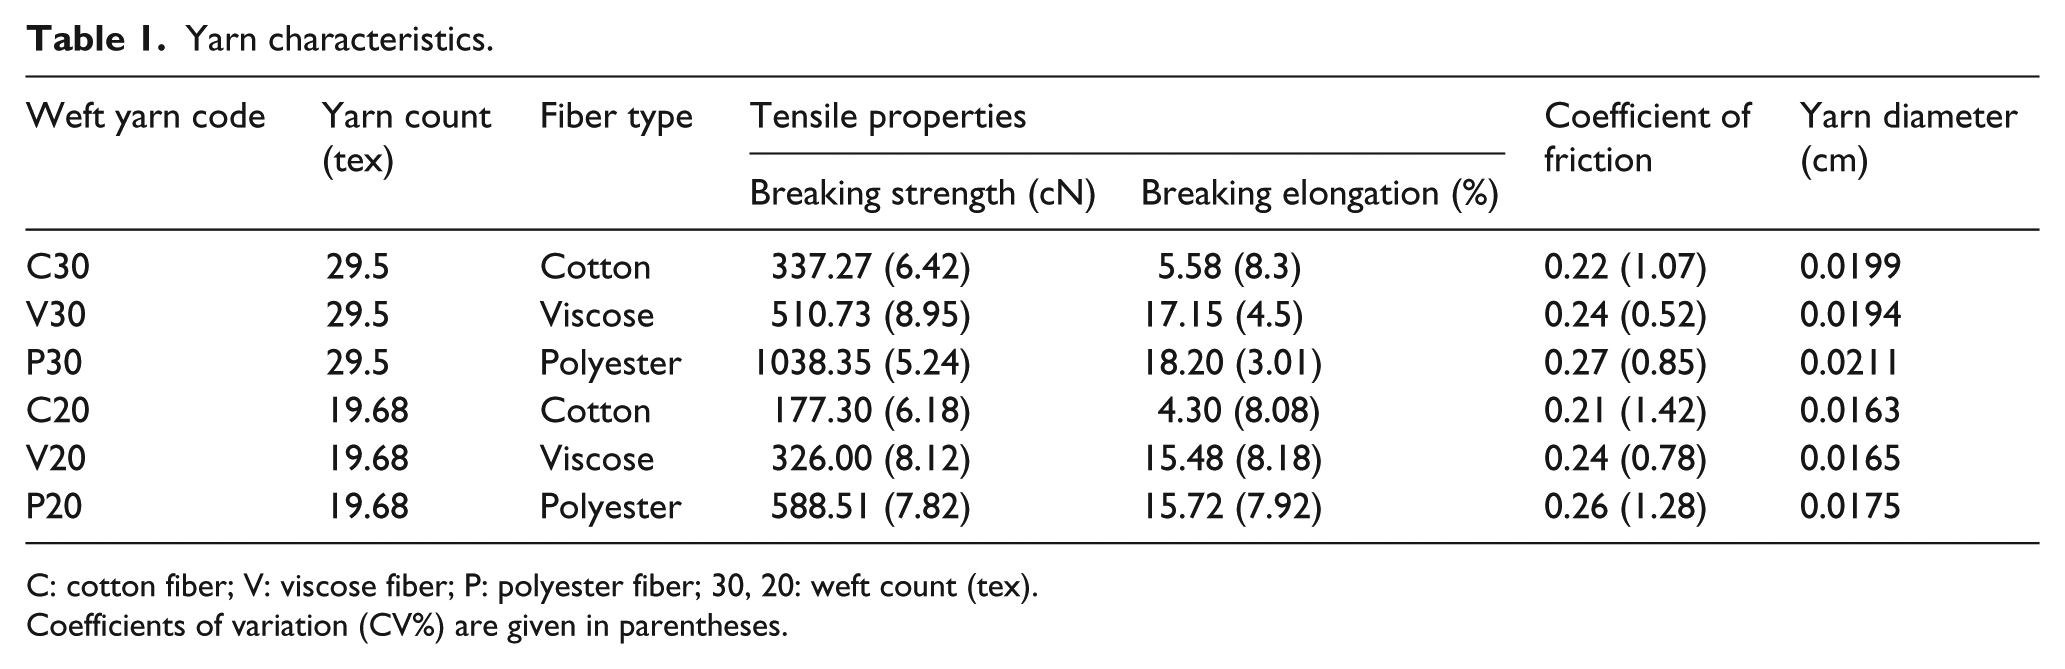
C: cotton fiber; V: viscose fiber; P: polyester fiber; 30, 20: weft count (tex).
Coefficients of variation (CV%) are given in parentheses.
A projectile P7300 weaving machine with a nominal width of 390 cm and a speed of 300 ppm was used to weave 18 plain fabric samples at pick densities of 16, 20, and 24 per cm. 65/35 polyester/viscose vortex spun yarns with a nominal count of 19.68 tex were employed as warp yarn with a warp density of 30 per cm. The diameter of warp yarn was found to be 0.0170 cm. The breaking strength and breaking elongation of the warp yarn were found to be 390.68 cN and 12.96%, respectively. Characteristics of the fabric samples are shown in Table 2. The gray fabric samples were then scoured and heat set. Sample tensile properties were measured according to the ASTM-D5035:2015 34 method using the Zwick tensile tester. Sample thickness was measured according to the ASTM-D1777:2015 35 standard test method. The warp and weft densities of the samples were measured using the image processing technique and MATLAB software by scanning 10 cm × 10 cm samples at 600 dpi using the MATLAB program based on Fourier transform. The scans of three fabrics are shown in Figure 1. Comprehensive information regarding Fourier transform in measurement of warp and weft densities with relevant accuracies can be found in the study by Hoseini et al. 36 and Ruru et al. 37 The Milasius fabric firmness factor and the fabric cover factor were calculated based on equations (1) and (2).
Fabric characteristics.
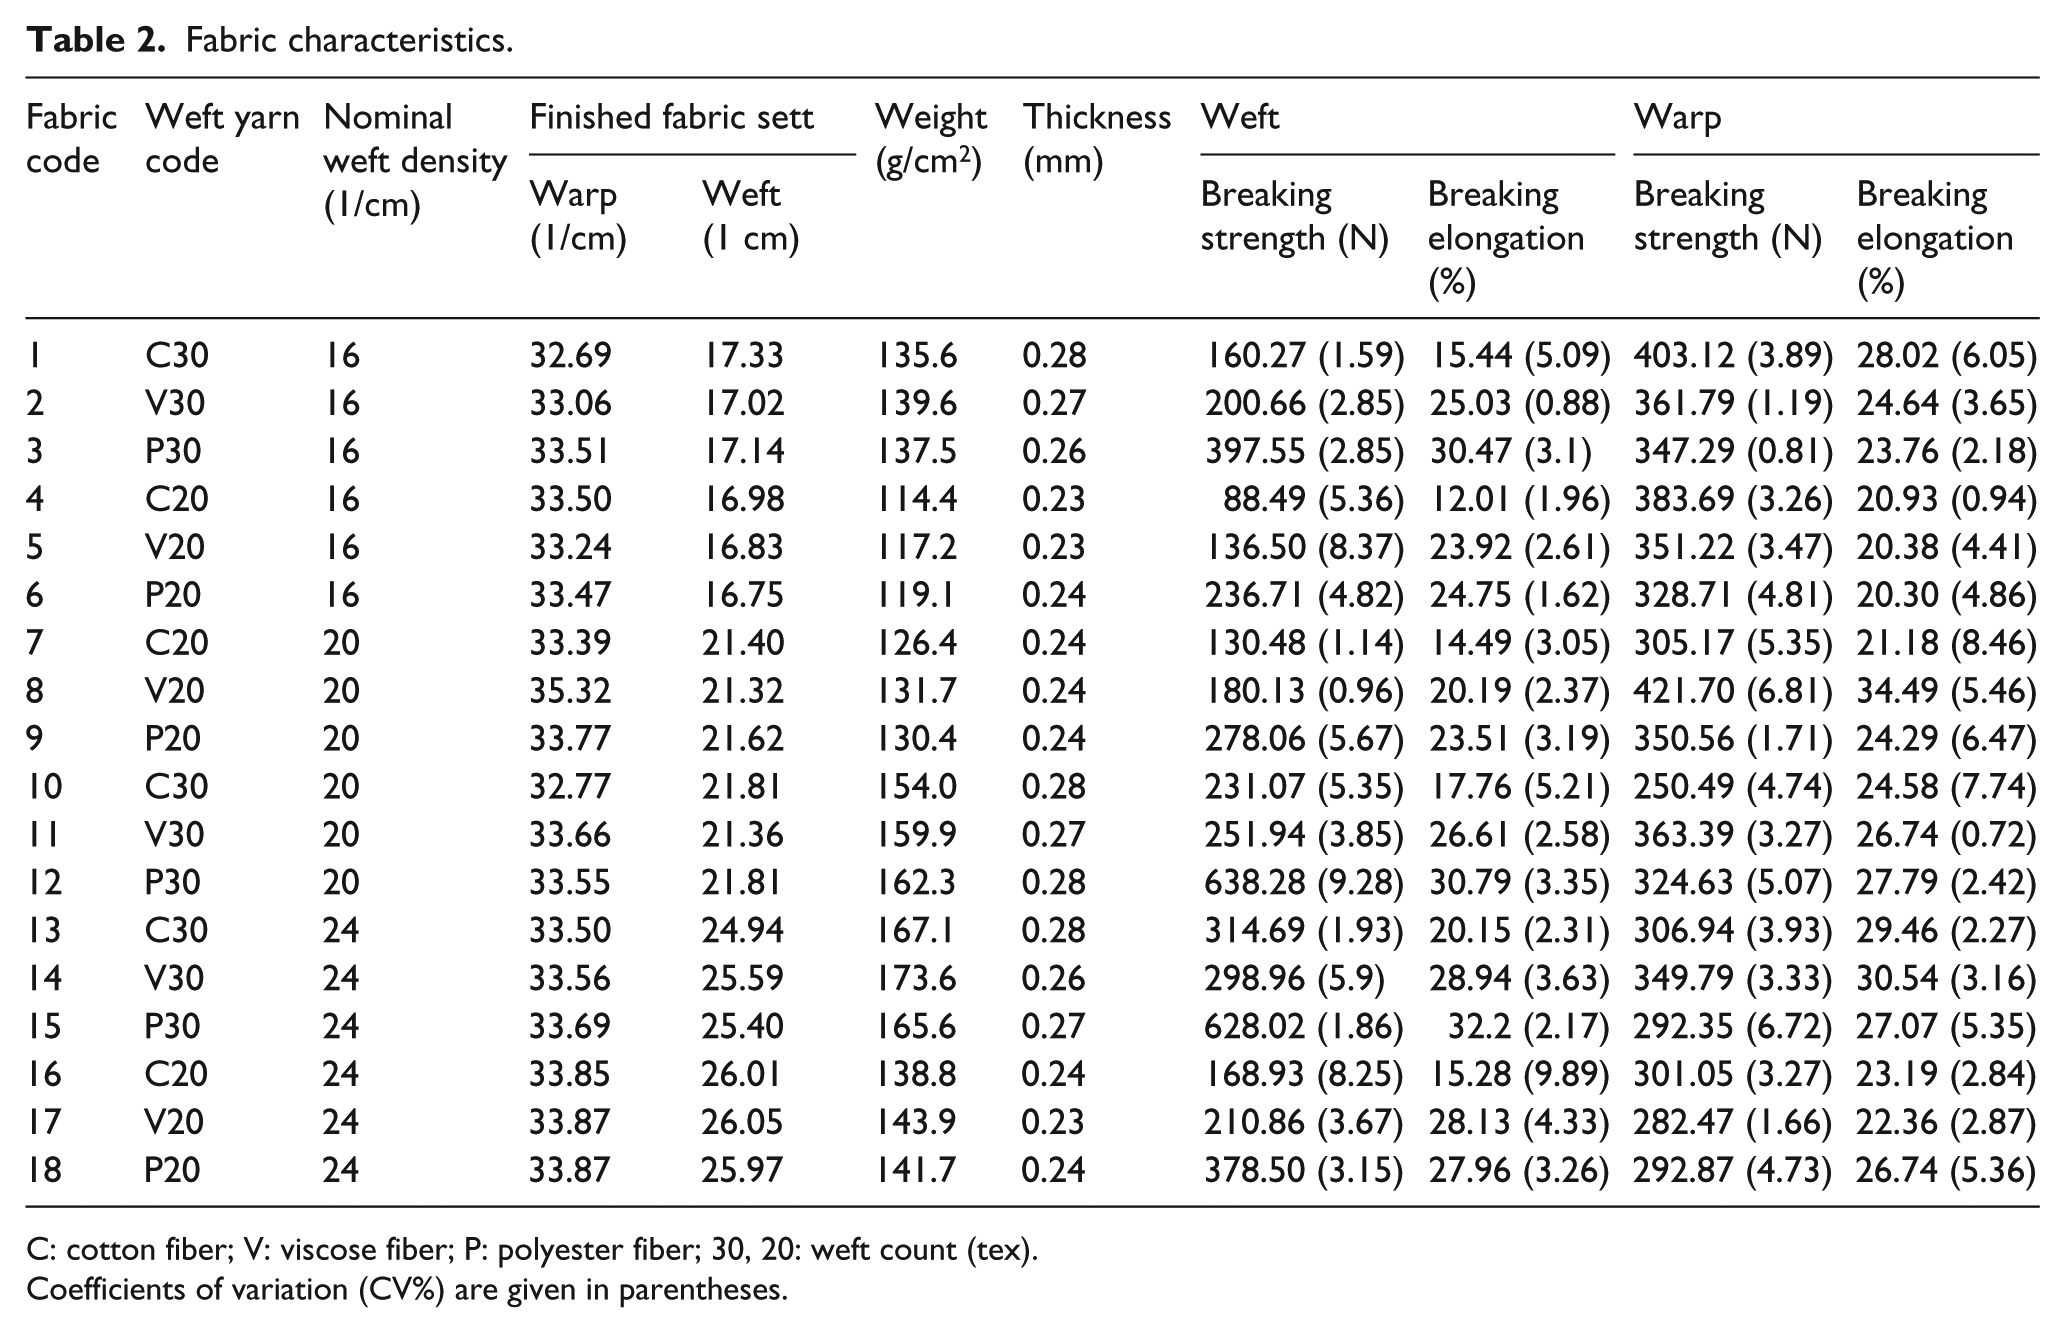
C: cotton fiber; V: viscose fiber; P: polyester fiber; 30, 20: weft count (tex).
Coefficients of variation (CV%) are given in parentheses.

Scans of woven fabrics: (a) sample 1, (b) sample 8, and (c) sample 15.
All samples were conditioned under standard conditions of 65% ± 2% relative humidity and 20°C ± 2°C for 24 h. Shear behavior of the samples along the principal directions was determined using the Kawabata tensile and shear tester (KES-FB1A). Shear rigidity (G), shear hysteresis at 0.5° of shear angle (2HG), and shear hysteresis at 5° of shear angle (2HG5) were measured and maximum shear angle of ±8° was adopted. Figure 2 shows a typical shearing curve provided by the Kawabata apparatus. The slope of the linear regions of the shear hysteresis curve from 0.5° to 5° shear angle was used to represent the measured shear rigidity. The linear region in Figure 2 is from A to B. The widths of the shear hysteresis loops at 0.5° and 5° shear angles, respectively, were used to represent the measured shear hysteresis at 0.5° and 5° shear angles. The results of the measurements are provided in Table 3. Investigation of the results in Table 3 indicates that the samples 15 and 5 exhibited the highest and the lowest rigidity in warp and weft directions, respectively. The warp and the weft shear rigidities ranged from 2.73 to 7.84 gf/cm degree and 1.69 to 5.74 gf/cm degree, respectively.

The typical shearing curve of woven fabric by the Kawabata apparatus (Fs is the shear force and
Shear properties, firmness factor, and cover factor of the samples.

MFFF: Milasius fabric firmness factor; FCF: fabric cover factor.
Coefficients of variation (CV%) are given in parentheses.
Statistical evaluation
By using SPSS 17 statistical software in the following sequence, the effect of structural parameters of the samples on their shear properties was evaluated.
The correlation analysis between the shear rigidity, 2HG0.5, and 2HG5 shear hysteresis in warp and weft directions at 99% confidence level.
The univariate analysis of variance (ANOVA) test with the aim of evaluating the effectiveness of each independent parameter, that is, weft yarn count, weft density, and fiber type of weft yarn on shear parameters at 95% confidence level. The univariate test unlike the regression analysis neither deals with the causes nor with relationships between the dependent and independent variables; it rather provides a general overview of the effect of independent variables on dependent variables.
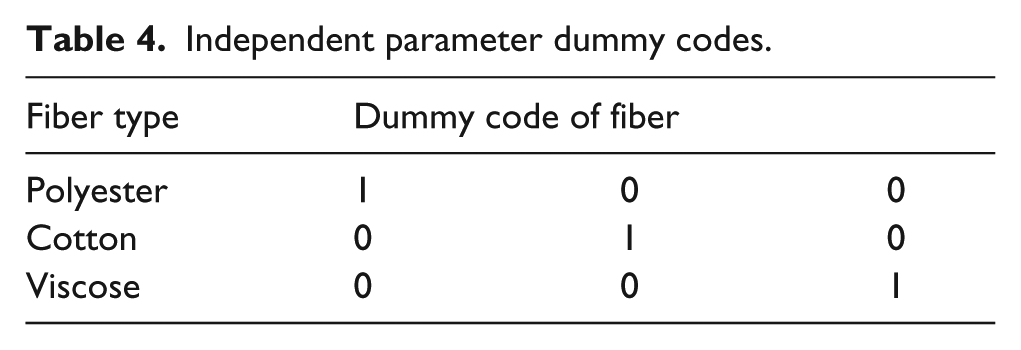
Multiple linear regression analysis generally evaluates the relationship between the dependent and independent variables. The outcomes, that is, dependent variables were assumed to be shear rigidity and shear hysteresis at 0.5° and 5° shear angles along principal directions, and predictor, that is, independent variables were values of weft yarn count, weft density, and weft yarn fiber type. Presentation of discontinuous quantities that are also known as categorical data such as weft yarn fiber type to the regression model requires prior transformation of such quantity to dummy data. Thus, each fiber type as is shown in Table 4 was given a code in SPSS statistical software. 39 In regression analysis, with dummy independent variable, if one variable has the L category, the L-1 categories should be in the model and the remaining one is called reference or base category. This is because any one dummy variable is perfectly collinear with the remaining set of dummies.
Independent parameter dummy codes.
Results and discussion
Correlation coefficient
Tabulated results in Table 5 indicated that the correlation between the shear parameters of fabrics along principal directions is significant at the 0.01 level. The correlation coefficient between the shear rigidity and 2HG5 in warp and weft directions was 0.98 and 0.98, respectively. This implies that the shear rigidity and the shear hysteresis at 5° of shear angle are not independent. In addition, results point to significance of the correlation between the shear rigidity Gwarp and Gweft along the principal directions. The correlation between the shear rigidity along principal directions is as high as 0.98, pointing to the existence of a linear relationship between the two sets of shear rigidities. This vividly points to the fact that changes in parameters such as count of weft yarn, weft density, and fiber type in weft yarn affects not only fabric shear rigidity in the weft direction but also the shear rigidity of the fabric in the warp direction. High correlation between the 2HG5 in the warp and weft directions was also observed. The correlation coefficient of 0.68 between the 2HG in the warp and weft directions was found to be unnoticeable.
KES correlation among shear parameters (G, 2HG0.5, and 2HG5) along the principal directions.
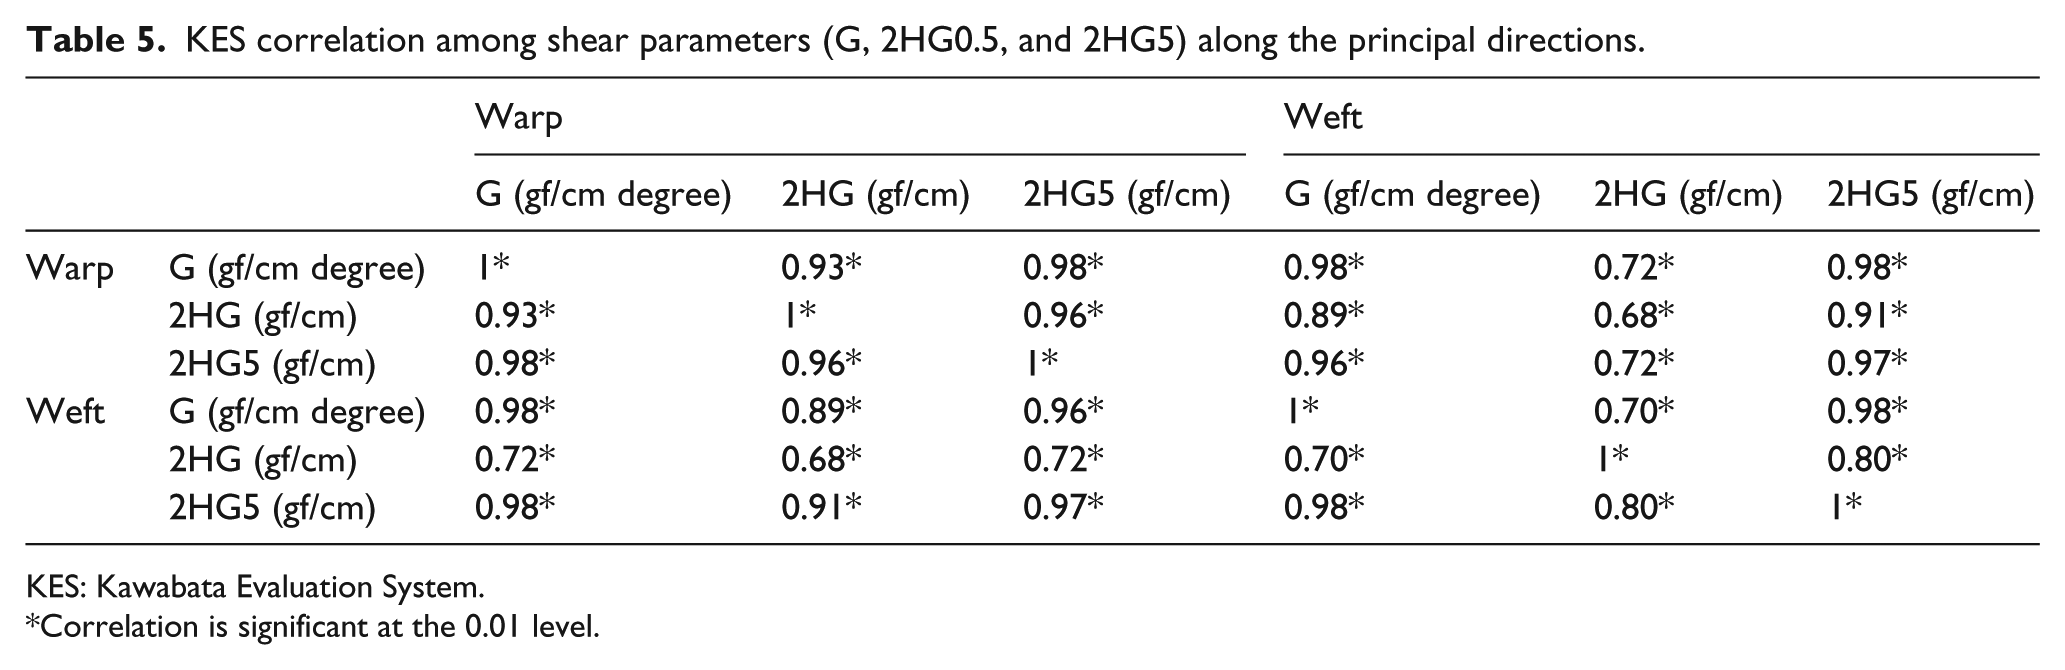
KES: Kawabata Evaluation System.
Correlation is significant at the 0.01 level.
The univariate ANOVA test
The univariate test was performed at 95% confidence level. The effectiveness of independent parameters was evaluated on shear rigidity, shear hysteresis at 0.5° and 5° shear angles along the principal directions. The resulting F-values and significant values are shown in Table 6.
Univariate analysis of variance test at 95% confidence level.

Obtained results point to significant effect of the weft density, weft count, and weft yarn fiber type on the shear rigidity, shear hysteresis at 5° along the principal directions. In addition, along the warp direction, these parameters were statistically significant on shear hysteresis at 0.5° shear angle. Weft density was found to be the only statistically significant parameter on weft shear hysteresis at 0.5° shear angle at 95% confidence level. This is due to the fact that while weft density significant value is less than 0.05, weft count, and weft yarn fiber type have significant value which are more than 0.05. Friction force between warp and weft yarns is the effective parameter controlling shear behavior of woven fabrics. 40 The number of intersections per unit area of the fabrics is determined by fabric weft density, which was found to be the first most influential fabric structural parameter affecting fabric shear behavior. The weft count which affects contact surface area at intersections was found to be the second most influential structural parameter affecting fabric shear behavior. Thus, the three independent parameters, which quite naturally influence the total friction force between warp and weft yarns at intersections, affect the shear behavior of woven fabrics. However, univariate test results vividly confirm that the number of intersections in comparison to surface contact area of the intersections and fiber type is the paramount influential parameter that controls the frictional coefficients between warp and weft yarns at the intersections.
The multiple linear regression
Summarized results of ANOVA, R2, and adjusted R2 of fitted models are shown in Table 7. Models are statistically significant at 95% confidence level due to their significant values being less than 0.05. In addition, models’ adjusted R2 is high and lies in the range of 0.794 to 0.895. Adjusted R2 value of 0.794 for weft shear hysteresis at 0.5° shear angle in the weft direction points to 79.4% compatibility of variations in response variable with predictor variables. Results show that 89.6% of the 2HG5 values in the warp direction are determined by the predictors. Difference of less than 10% between the R2 and adjusted R2 of the regression models assures the suitability of the evaluated models as a successful and stable statistical explanation tool, which is not significantly affected by individual variables. 41
The ANOVA results of multiple regression models.

ANOVA: analysis of variance.
Shear rigidity along the principal directions
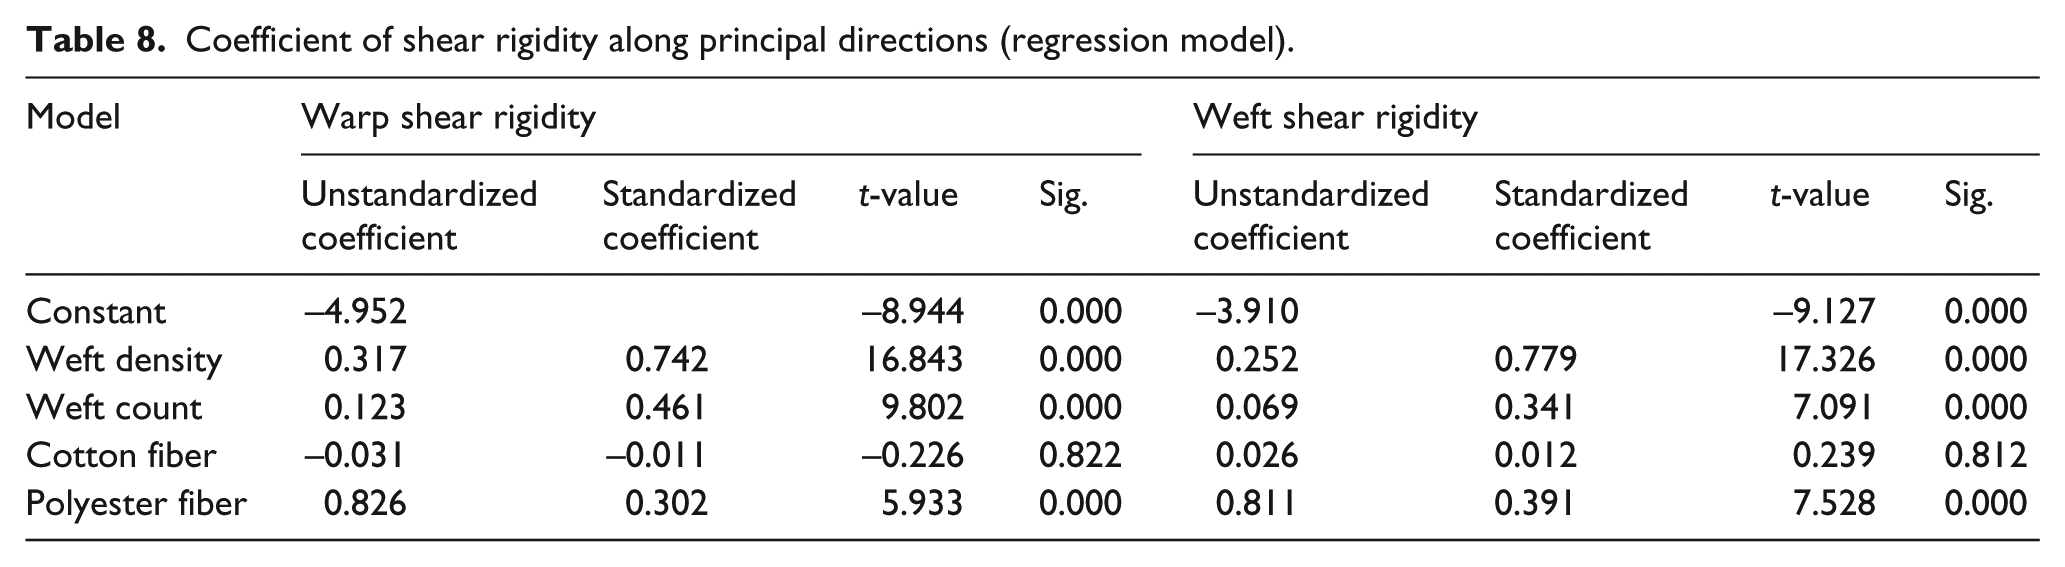
Table 8 shows standardized and unstandardized coefficients of multiple linear regression in analysis of the relationship among response variables such as warp and weft yarns’ shear rigidities and predictors such as weft density, weft yarn count, and fiber type of weft yarn. Presentation of fiber type to the models as a dummy variable necessitates the selection of only two variables and a third variable which is called the reference category. Table 8 shows that increase in the weft density and the weft count leads to increase in the fabric shear rigidities along the principal directions. This is confirmed by Figure 3(a) to (d), in which the interaction between the weft density and the fiber type of weft yarns for 29.5 and 19.68 tex weft count is shown. Increase in fabric shear rigidity due to increase in weft density from 16 to 24 per cm is shown in Figure 3(a) to (d). Comparison of Figure 3(a) to (b) and Figure 3(c) and (d) also confirms the beneficial effect of weft count on fabric shear rigidity slope. Comparison of each pair of two surface plots points to dominant effect of weft density than that of weft count on fabric shear rigidity along the principal directions. The observed increase in intersections per surface unit area and contact surface area at the intersections between warp and weft yarns can occur due to increase in weft density and weft yarn count. This trend is in line with the published work of Xu and Wang 41 in which the effect of contact surface area at intersections on fabric shear rigidity is given as paramount importance in shear rigidity. These two parameters influence the tightness of the woven fabric, which can be the criteria for increase in shear rigidity.
Coefficient of shear rigidity along principal directions (regression model).

Surface plot of fabric warp and weft shear rigidities versus weft density and fiber type of weft yarn: (a) warp direction (weft count: 29.5 tex), (b) warp direction (weft count: 19.68 tex), (c) weft direction (weft count: 29.5 tex), and (d) weft direction (weft count: 19.68 tex).
In order to establish the effect of fiber type on fabric shear behavior, viscose fiber was assumed to be the reference sample and cotton and polyester fibers were compared with viscose fiber. Comparison of fabric woven with 100% cotton yarns with the reference sample revealed that cotton fabric shear rigidity in the warp direction reduces by −0.031 ratio with no statistically significant effect (sig. > 0.05). Comparison also showed that fabric shear rigidity of cotton woven fabric in the weft direction increases in comparison to the reference sample with 0.012 ratio with no statistically significant effect (sig. > 0.05). Comparison of fabric woven with 100% polyester yarns with the reference sample revealed that increase in shear rigidity in warp and weft directions with 0.826 and 0.811 ratio, respectively, at statistical significance of 95% confidence level. Interaction between the cotton and polyester spun yarns can be established using the regression models in which cotton or polyester fibers are replaced with viscose fiber. Results show that the cotton weft yarn in comparison with polyester weft yarn tends to reduce fabric rigidities along the principal directions with statistical significance at 95% confidence level. The ratio of rigidity of the sample to the reference along warp and weft directions was found to be −0.740 and −0.782, respectively, with 0.000 significant value. This is in line with the coefficient friction of yarns as shown in Table 1, where it can be seen that frictional coefficient of polyester yarns is higher than cotton and viscose yarns. Table 1 also shows that the diameter of polyester weft yarns in comparison to cotton and viscose yarns is higher. This in turn indicates an increase in surface contact area at the intersections, which was stated previously. The marginal effect of cotton and viscose weft yarns and the contrasting effect of polyester weft yarns on fabric shear rigidity in both weft and warp directions is vividly shown in Figure 3.
Shear hysteresis at 0.5° shear angle along principal directions
Table 7 shows R2 and adjusted R2 of regression model values of 0.869 and 0.857, respectively, for the established shear hysteresis at 0.5° shear angle in the warp direction. The F-value of 75.54 with 0.000 significant value indicates that the model is statistically significant at 95% confidence level. As shown in Table 6, fabric weft density and fiber type of weft yarn have the most and the least effect on shear hysteresis at 0.5° in the warp direction, respectively. The investigations of Xu and Wang 42 and Skelton 43 showed that fabric shear hysteresis is dominantly affected by the friction between yarns at intersections. Frictional properties affect relative sliding of weft and warp yarns at intersections. Table 9 shows that increase in fabric weft density and weft yarn count leads to increase in 2HG in the warp direction. While cotton weft yarn in comparison with viscose fiber reduces 2HG by ratio of −1.063, which is statistically significant at 95% confidence level, the increase in 2HG for polyester weft yarn in the warp direction is in the ratio of 0.276 compared with viscose weft yarn. The difference between fabrics woven with polyester and viscose weft yarns was not statistically significant at 95% confidence level. The use of cotton spun yarns in comparison with polyester spun yarns reduces shear hysteresis at 0.5° by ratio of −1.463 at 95% confidence level.
Coefficient of shear hysteresis at 0.5° shear angle along principal directions (regression model).

Figure 4(a) and (b) shows the surface plot of 2HG in the warp direction. It is illustrated that in general 2HG increases due to increase in fabric weft density. Figure 4(a) and (b) vividly shows the increase in 2HG in the warp direction due to increase in weft count from 19.68 to 29.5 tex. This trend can be due to the increase in number of intersections and also surface contact of warp and weft yarns. These parameters increase the tightness of woven fabrics, which can be a reason to increase the shear hysteresis at 0.5° shear angle. The marginal and inconsistence effect of weft yarn fiber type on 2HG in the warp direction is shown in Figure 4(a) and (b).

Surface plot of warp and weft shear hysteresis at 0.5° shear angle versus weft density and fiber type of weft yarn: (a) warp direction (weft count: 29.5 tex), (b) warp direction (weft count: 19.68 tex), (c) weft direction (weft count: 29.5 tex), and (d) weft direction (weft count: 19.68 tex).
Table 7 shows that the regression model that predicts 2HG in the weft direction is statistically significant at 95% confidence level with R2 and adjusted R2 values of 0.811 and 0.794, respectively. Table 9 shows that the only statistically effective parameter is weft density, which increases 2HG by ratio of 0.366. Surface plot of weft shear hysteresis at 0.5° is shown in Figure 4(c) and (d). Increase in 2HG due to increase in fabric weft density is readily shown in Figure 4(c) and (d). Finally, while the effect of weft yarn count is inclusive, the effect of weft yarn fiber type is not observable in the plots. The surface plots presented in Figure 4(c) and (d) are inconsistent, related to fiber type of weft yarn. The inconsistency points to the fact that changes either positive or negative occur in shear hysteresis irrespective of the weft yarn composition. This rather complicated and strenuous trend can be due to inevitable structural differences in the samples that physically locate the point beyond which the slope of shear stress–strain curve changes in a locus. The 0.5° shear angle for the samples is always in the vicinity of this locus, which in fact is also the locus where shear force–shear angle hysteresis transforms from the partial to full yarn slippage region. 44
Shear hysteresis at 5° along principal directions
As is shown in Table 7, values of adjusted R2 for the relation between fabric structural parameters and 2HG5 along the principal directions have values of 0.895 and 0.877, respectively. The regression model coefficients confirm that increase in fabric weft density and weft yarn count, as the two most effective parameters, intensifies shear hysteresis along the principal directions at 5° shear angle. This can be due to the fact that increase in fabric weft density may cause geometrical restraints in the surface per unit area of fabric and more tightness of fabric, which is known to be an effective parameter affecting shear hysteresis. 42 The use of polyester weft yarn in comparison to cotton and viscose spun yarns tends to increase 2HG5 along the principal directions, which statistically is significant at 95% confidence level. The increase in 2HG5 due to the use of polyester weft yarn in comparison to viscose weft yarn is in the ratio of 1.747 and 1.625 along the warp and weft directions, respectively. Such performance by the polyester weft yarn is due to higher frictional coefficient and larger diameter of polyester weft yarns as shown in Table 1. Cotton weft yarn in comparison to viscose weft yarn causes the reduction in 2HG5 in the warp direction with 1.122 ratio. Table 10 shows that the use of cotton and viscose weft yarns results in no significant difference in the value of 2HG5 in the weft direction. Finally, the reduction in 2HG5 along warp and weft directions when using cotton weft yarn in comparison to polyester weft yarn is in the ratio of 3.115 and 1.791, respectively. Surface plots of 2HG5 along principal directions are illustrated in Figure 5(a) to (d). The dominant and positive effects of fabric weft density on 2HG5 are vividly shown in Figure 5(a) to (d), where the intensification of the effect due to the use of coarser weft yarn, that is, 29.5 tex in comparison to 19.68 tex weft yarn is emphasized. Figure 5(a) to (d) shows the reduction caused in 2HG5 due to the use of cotton and viscose weft yarns in comparison to polyester weft yarn which is in line with positive sign of polyester weft yarn in regression models compared with cotton and viscose weft yarns.
Coefficient of shear hysteresis at 5° along principal directions (regression model).


Surface plot of warp and weft shear hysteresis at 5° shear angle versus weft density and fiber type of weft yarn: (a) warp direction (weft count: 29.5 tex), (b) warp direction (weft count: 19.68 tex), (c) weft direction (weft count: 29.5 tex), and (d) weft direction (weft count: 19.68 tex).
Integrated structure factors
Correlation between Milasius fabric firmness factor and fabric shear rigidities along the principal directions with R2 values of 0.823 and 0.830 is shown in Figure 6(a) and (b). The corresponding regression equations are as follows (equations (4) and (5))


Milasius fabric firmness factor versus fabric rigidity: (a) shear rigidity in the warp direction and (b) shear rigidity in the weft direction.
The two regression models are significant at 95% confidence level with F-values of 74.429 and 78.107, respectively. Results are indicative of the existence of a close relationship between fabric shear rigidities in the principal directions and Milasius fabric firmness factor. Increase in the fabric firmness factor leads to increase in fabric shear rigidities. The high correlation between the shear rigidities and fabric firmness factor points to the ability of the equations in evaluation of woven fabrics shear behavior. Considering the high correlation between shear rigidities and shear hysteresis values as shown in Table 5, the correlation coefficient between Milasius fabric firmness factor and shear hysteresis values is also expected to be high. This expectation was realized by the fact that the minimum correlation coefficient was equal to 0.808, which belongs to R2 of the linear regression model between weft shear hysteresis at 0.5° shear angle and Milasius fabric firmness factor.
Correlation between fabric cover factor and fabric shear rigidities along principal directions with R2 values of 0.872 and 0.869 is shown in Figure 7(a) and (b). The corresponding regression equations are equations (6) and (7)


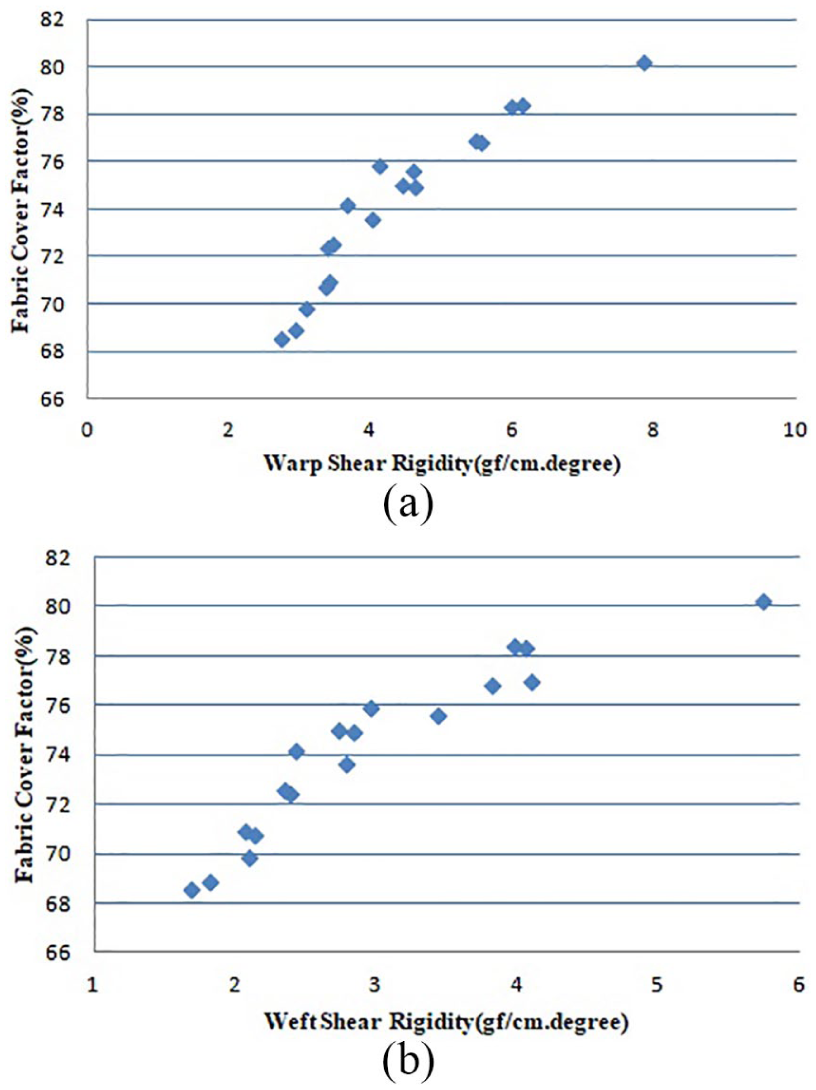
Fabric cover factor versus fabric rigidity: (a) shear rigidity in the warp direction and (b) shear rigidity in the weft direction.
The two regression models are significant at 95% confidence level. This implies that the fabric cover factor can also be used as a successful tool in defining shear behavior of woven fabric. As far as Milasius firmness factor is concerned, the high R2 value was found to exist between fabric cover factor values and shear hysteresis values at 0.5° and 5° shear angles. The lowest R2 value of 0.713 was associated with the relation between the 2HG in the weft direction and the fabric cover factor. This trend is confirmed by Table 5, which confirms the existence of lowest value of correlation between G and 2HG in the weft direction. The highest correlation value of 0.916 was obtained between FCF (%) and 2HG in the warp direction.
Conclusion
Shear rigidity, shear hysteresis at 0.5° shear angle, and shear hysteresis at 5° shear angle of 18 plain woven fabrics along the principal directions were statistically analyzed using multiple linear regressions. It was found that shear behavior of the fabrics along the principal directions is dependent upon the structural parameters of woven fabrics in the weft direction. Dependency of fabric shear behavior on fabric weft density in most of the experimental samples was found to be the most important results among the findings of this work. Results confirmed that increase in fabric weft density and weft yarn count leads to increase in fabric shear rigidity along the principal directions. It was also found that samples woven with polyester spun weft yarns have the highest value of shear rigidity and shear hysteresis along the principal directions. Milasius fabric firmness factor correlation with both fabric shear rigidities along the principal directions was found to be 0.823 and 0.830, respectively. The correlation between the fabrics cover factor and fabric warp and weft shear rigidities was also found to be 0.872 and 0.859, respectively. Results confirmed the existence of high correlation coefficient between shear hysteresis values and the two integrated structural factors. This was found to be in line with correlation between the shear rigidities and shear hysteresis values in the principal directions of the samples. The lowest correlation between the shear hysteresis at 0.5° shear angle with fabric cover factor and Milasius fabric firmness factor was found to be 0.713 and 0.0808, respectively. It was concluded that the observed high correlation between the fabric shear rigidity and fabric integrated structural factors not only confirms the suitability of the structural parameters for objective description of woven fabric shear behavior but also encourages their use in investigation of functional properties of woven fabric. The next task aimed for by the authors of this work is to investigate the effect of yarn spinning systems on woven fabric shear behavior and also development of geometrical and mechanical models involving woven fabrics shear parameters.
Footnotes
Declaration of conflicting interests
The author(s) declared no potential conflicts of interest with respect to the research, authorship, and/or publication of this article.
Funding
The author(s) received no financial support for the research, authorship, and/or publication of this article.