
Abstract
In order to find a simple and reliable method for the calculation of the diffusion coefficient, the correlation equation of concentration and distance in the form of complementary error function was derived from solving an ordinary differential equation of the diffusion equation. A disperse dye in paste was treated at 170°C–190°C for 3–4 h for the sublimation diffusion into polyethylene terephthalate using a film roll method. Quadratic regression analysis on the profile of dye concentration–distance was used to determine the surface concentration. The diffusion coefficient of each layer was calculated by obtaining the variable value of the complementary error function from the ratio of the mean dye concentration of each layer to the surface concentration. From linear regression analysis on the Arrhenius plot of the logarithm of the diffusion coefficient versus the reciprocal of absolute temperature, the correlation coefficient for the diffusion of 3 h was 0.9978 and that of 4 h was 0.9991. Thus, it was expected that the diffusion coefficients determined by the equation of complementary error function adopted in this experiment were reliable. The activation energy of diffusion for 3 h was 30.5 kcal mol−1 and that for 4 h was 27.4 kcal mol−1.
Introduction
In the chemical wet process of the textile industry, high energy price and water inadequacy are the main cost factors. Improving energy efficiency and developing methods for water conservation must be the primary concerns for the dyeing and printing process of textiles. Commercial disperse dyes are usually classified according to their ease of transfer by sublimation for the processes of vapour-phase dyeing, 1 conventional printing2,3 and sublimation transfer printing.4,5 This is related to the their fastness to heat in hot processing. It is imperative that as much of the vaporised dye as possible should be absorbed by the polyester fibres.
The diffusion coefficient and the activation energy of disperse dyes are essential for the design of the sublimation processes. But, the methods to determine the diffusion coefficient reported in previous works are complicated and somewhat inaccurate. Sekido and Matsui
6
applied a film roll method to study the kinetic behaviour of vat dyes in cellulose substrate. When the values of
The main objective of this study is to find a simple and reliable method for the calculation of the diffusion coefficient for the sublimation diffusion of disperse dye to PET using a film roll method. The equation of the complementary error function to determine the diffusion coefficient was derived from the diffusion equation by solving an ordinary differential equation (ODE). A quadratic regression analysis on the dye concentration–distance profile was used to determine the surface concentration. When a disperse dye in paste was treated at 170°C–190°C for 3–4 h, the diffusion coefficient was calculated with the ratio of the mean concentration of each layer to the surface concentration. Also, the activation energy of diffusion was calculated from the Arrhenius plot.
Material and method
Materials
C. I. Disperse Violet 26 (Sumicaron Bordeaux SE-BL) was used without purification. Biaxially oriented PET film (40 μm in thickness) was supplied by SKC. Sodium alginate (Duk San Pure Chemicals Inc.) was the extra pure grade and was used without purification.
Preparation of film roll
Figure 1 shows the schematic image of film roll method. The PET film of 40 μm in thickness was wrapped tightly around a glass rod of 1 cm in diameter. Both sides of film roll were wrapped by aluminium tape of which thickness is 180 μm. Sodium alginate paste was prepared with 300g of dye and 700g of 5% sodium alginate stock thickening. Sodium alginate paste containing disperse dye was coated on the film roll between both barriers of aluminium tape and dried at 100°C for 10 min in dryer. The top of roll was fixed firmly by a thin aluminium tape and cotton yarn with glass rod for dividing layers.10,11

Image of film roll coated by paste containing dye.
Sublimation
The film roll coated with paste containing disperse dye was treated in laboratory curing chamber at 170°C–190°C for 3–4 h for the sublimation of disperse dye. The heat treatment was performed by curing at the constant set temperature for the set time. When the heat treatment was finished, the paste coated was immediately stripped from the surface of film roll without any cooling operation. And then, the surface of film roll was washed with water until paste and unfixed dye were completely removed. The film roll washed was unrolled and cut into the section pieces representing the successive layers.
Determination of dye concentration
The section piece of each film layer, of which the dimension was
Results and discussion
Differential equation of diffusion
The diffusion of dye is the process by which dye is transported from one part of a system to another as a result of random molecular motions. Consider a collection of dye particles performing a random walk in one dimension with length

The general solutions of equation (1) can be obtained for a variety of initial and boundary conditions provided the diffusion coefficient is constant. Such a solution usually has one of two standard forms. Either it is comprised of a series of error functions or it is in the form of a trigonometrical series. 15 In this study, a series of error functions was used to solve equation (1).
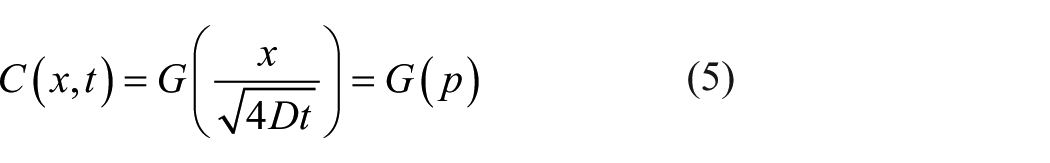
To solve the partial differential equation of equation (1), let any solution of the diffusion equation be


Let
Equation (6) is obtained by differentiating

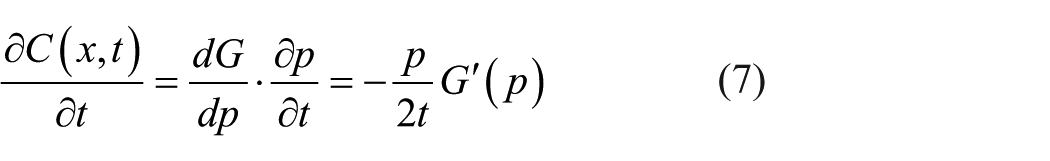
The chain rule yields equation (7) by differentiating equation (5) with respect to
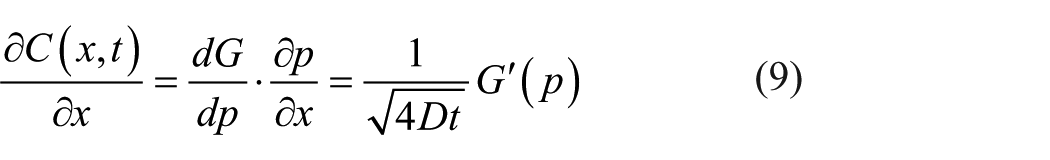
Similarly, equations (8) and (9) are obtained by differentiating

Thus, the right side of equation (1) can be reduced to ODE of

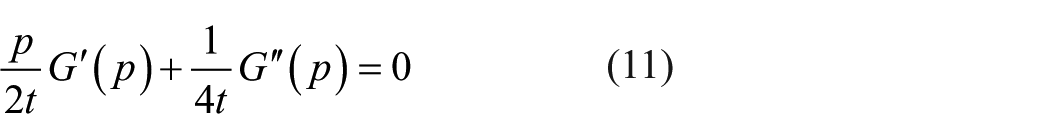
By combining equations (7) and (10) with equation (1) of the diffusion equation, equation (11) is obtained for all
By algebra, this is equivalent to the second-order variable-coefficient ODE equation (12)

Equation (12) becomes equation (13) by applying the differentiation of logarithm

Integrating both sides of equation (13) with respect to
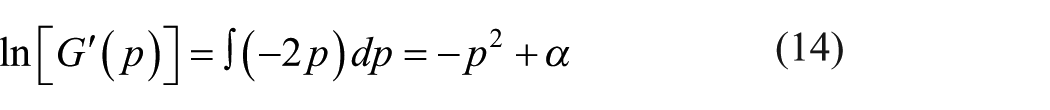
By exponentiating both sides of equation (14), equation (15) is obtained, where

Equation (16) is obtained by integrating equation (15)

Thus, the solution of equation (12) has the form equation (17), where

Boundary conditions
From the boundary condition equation (3), that is,

From the boundary condition equation (4), that is,

Determining the value

Therefore, by combining a Gaussian integral of equation (20) with equation (19), equation (22) is obtained from equation (21)


Thus, the solution of equation (17) is given by equation (23)

Gaussian kernel and initial condition
The function

However, the Gaussian kernel

By the property of translation invariance for the diffusion equation and its solutions, if


A solution of the diffusion equation can be also obtained by taking the convolution of the Gaussian kernel

Thus, the total solution of equation (1) is the sum of equations (23) and (28). But from the initial condition and equation (23), taking the limit

If one face

Complementary error function
The normalised Gaussian function is equation (31) 19

Substituting

The complementary error function

Equation (30) can be represented by equation (34) and be converted to the error function as equation (35)


Finally,

The diffusion coefficients for the sublimation diffusion of disperse dye were calculated by the values of
Surface concentration
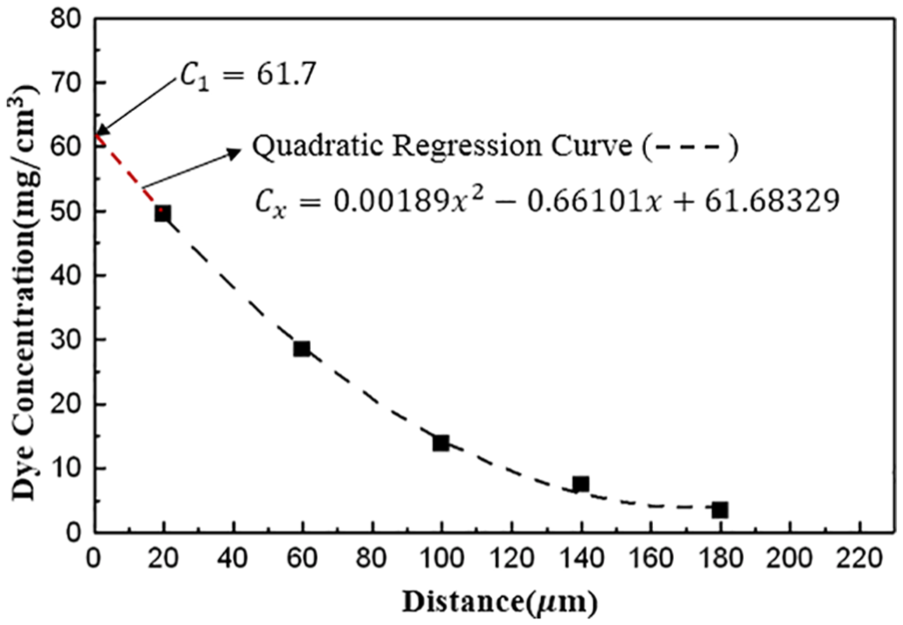
When the disperse dye in paste was treated at 170°C–190°C for 3–4 h, the profile can be obtained from plotting the mean dye concentration of the ith layer

Figure 2 shows the mean dye concentration–distance

Dye concentration–distance profile and its quadratic regression curve for the sublimation diffusion of disperse dye to PET film by treating at 190°C for 3 h
Figure 3 shows the mean dye concentration–distance
Dye concentration–distance profile and its quadratic regression curve for the sublimation diffusion of disperse dye to PET film by treating at 180°C for 3 h
Figure 4 shows the mean dye concentration–distance

Dye concentration–distance profile and its quadratic regression curve for the sublimation diffusion of disperse dye into PET film by treating at 170°C for 3 h
Quadratic regression analysis is the fit equation for a set of data shaped like a parabola. 20 From above results for the sublimation diffusion obtained from treating at 170°C–190°C for 3 h, it was found that the quadratic regression curves fitted well to the data of the dye concentration–distance profiles and so it was expected that the quadratic regression analysis would be a simple and reasonable method for the determination of the surface concentration.
Figure 5 shows the mean dye concentration–distance

Dye concentration–distance profiles and their quadratic regression curve for the diffusion of disperse dye into PET film by treating at 170°C, 180°C and 190°C for 4 h.
Diffusion coefficient
The variable
Figure 6 shows the plot of

Plot of
The values of
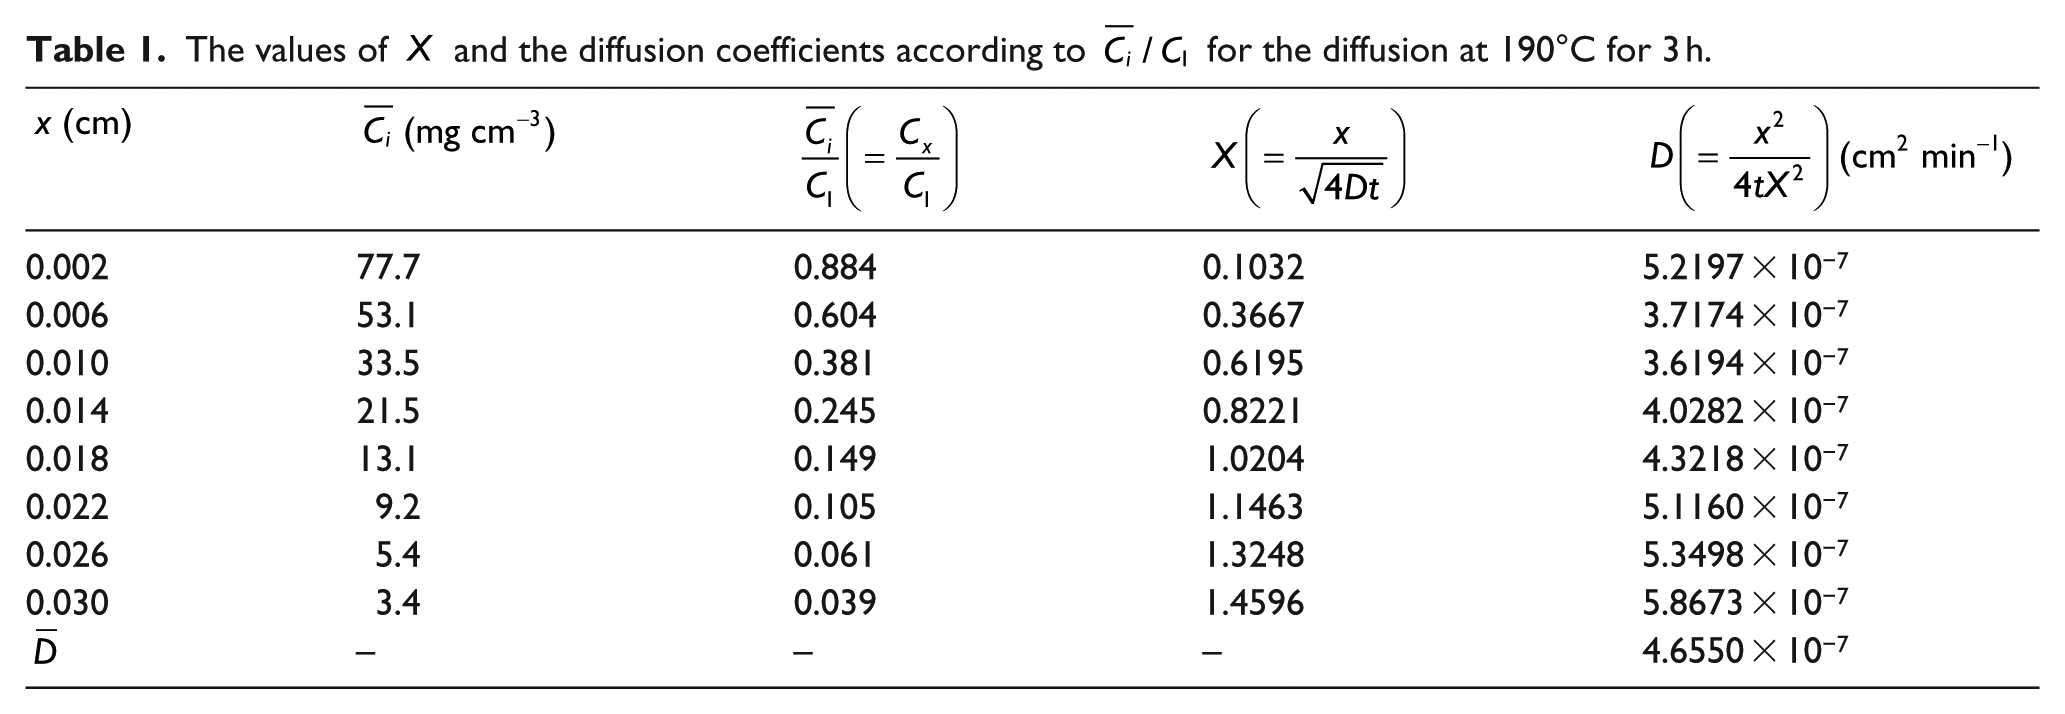
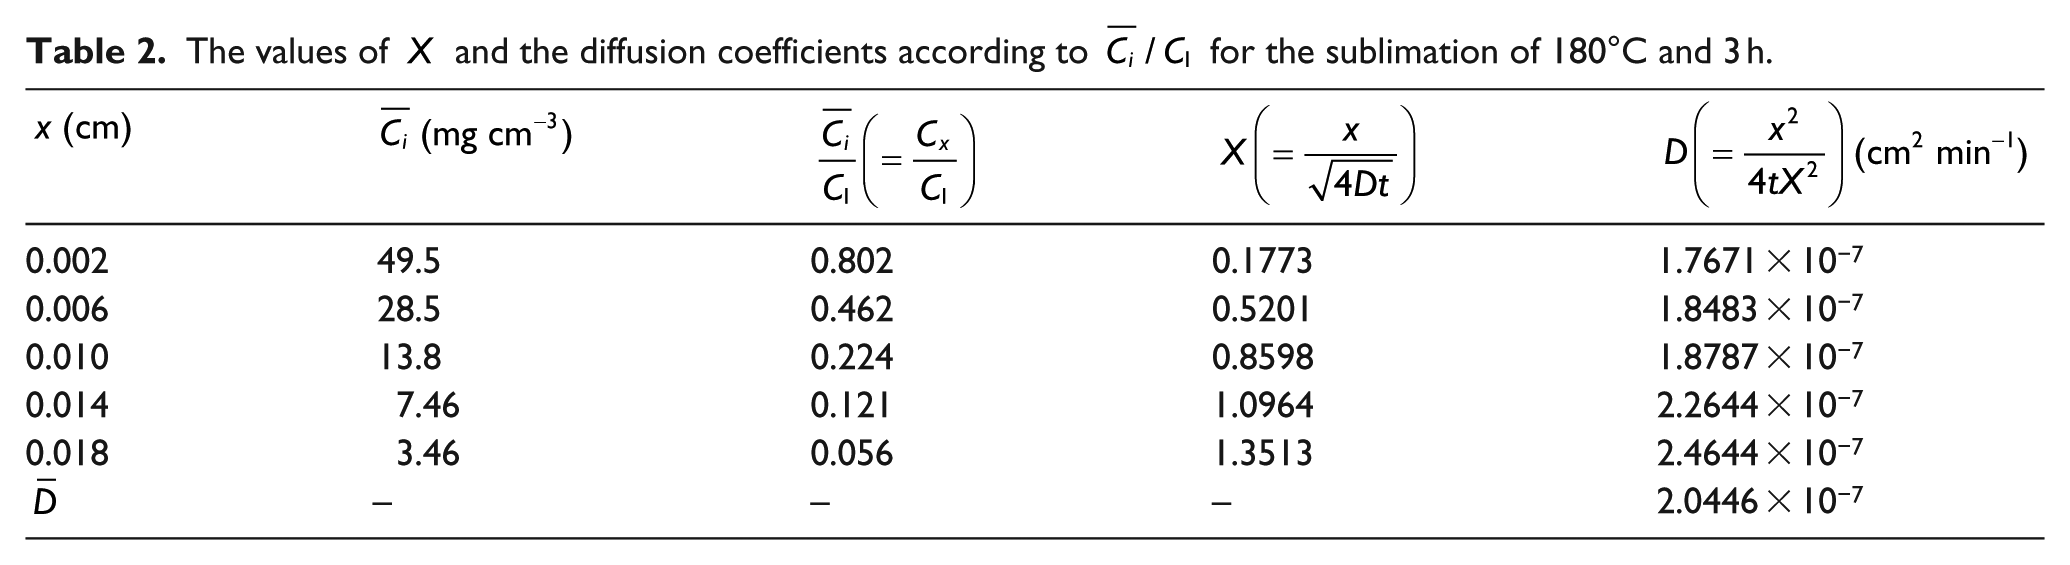
Figure 7 shows the plot of

Plot of
In the case of 180°C, the values of
The values of
In the case of 170°C, the values of
The values of
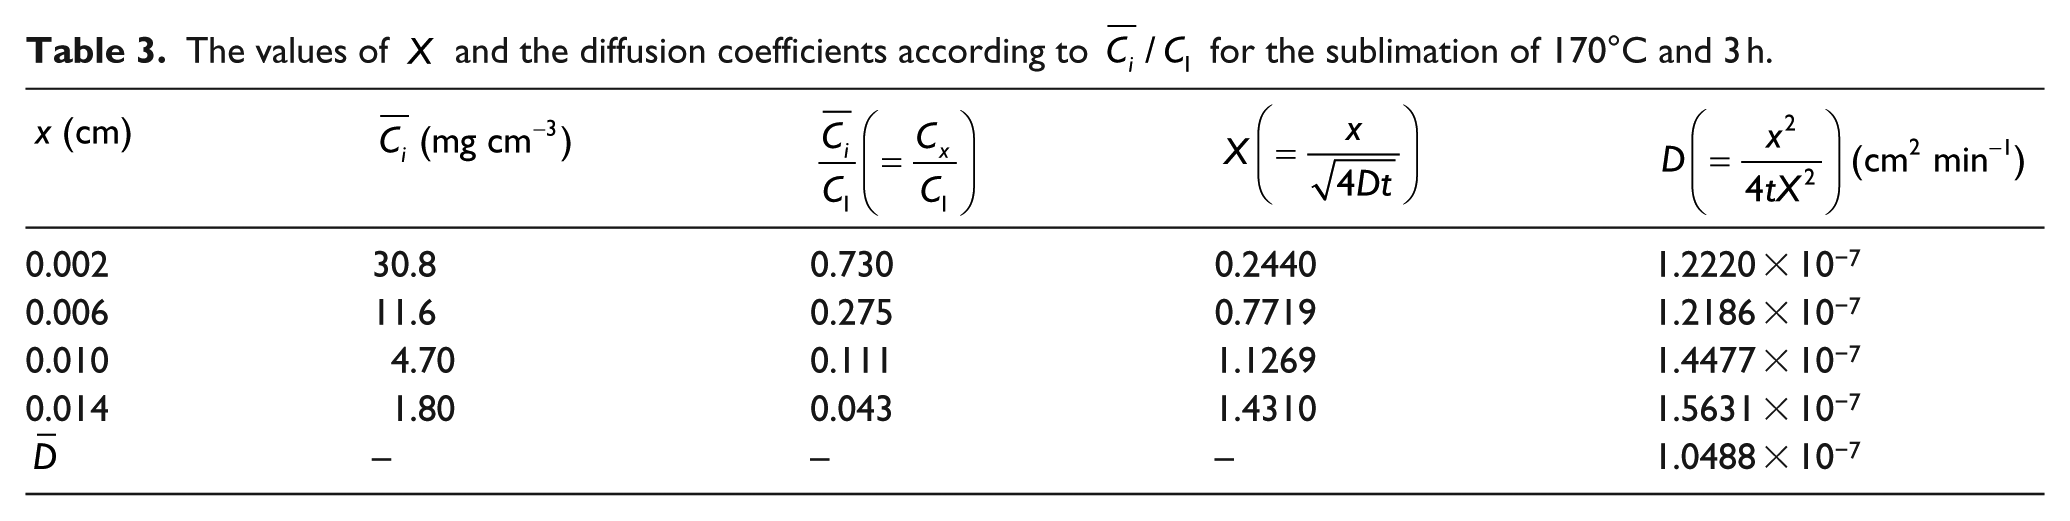
Figure 8 shows the distribution of the inter-layer diffusion coefficients at each layer and the mean diffusion coefficients for the diffusion at 170°C, 180°C and 190°C for 3 h. The standard deviation
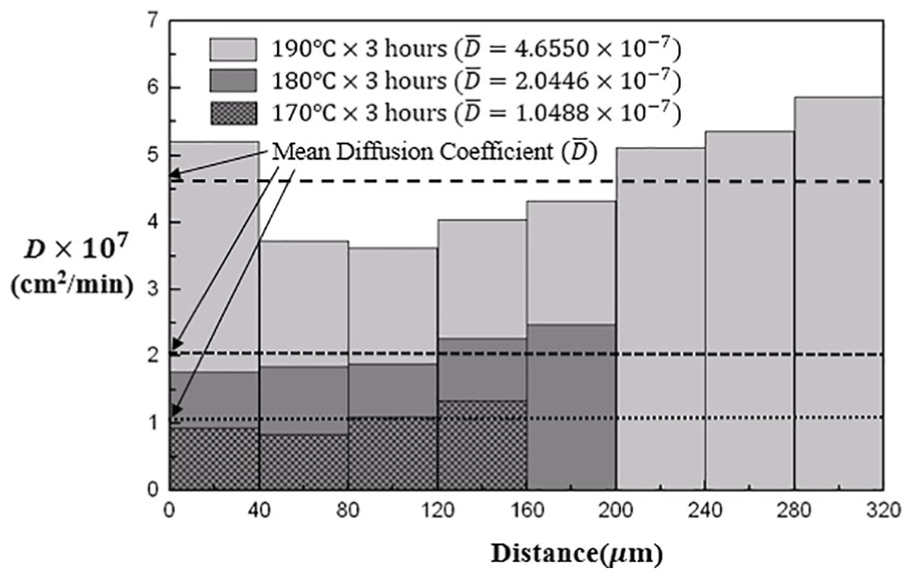
The distribution of the inter-layer diffusion coefficients at each layer and the mean diffusion coefficients for the diffusion at 170°C, 180°C and 190°C for 3 h.
Figure 9 shows the plot of
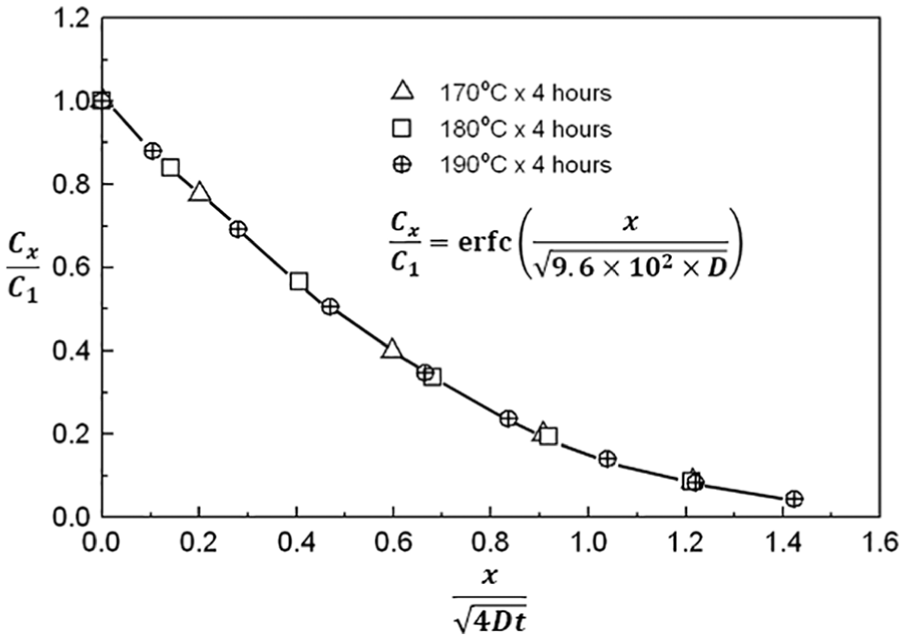
Plot of
Figure 10 shows the distribution of the inter-layer diffusion coefficients at each layer and the mean diffusion coefficients for the diffusion at 170°C, 180°C and 190°C for 4 h. The standard deviation

The distribution of the inter-layer diffusion coefficients at each layer and the mean diffusion coefficients for the diffusion at 170°C, 180°C and 190°C for 4 h.
Activation energy
Table 4 presents the common logarithm of the mean diffusion coefficient according to temperature. The activation energy of diffusion
Logarithm of the mean diffusion coefficient.

The correlation between the common logarithm of the diffusion coefficient
Figure 11 shows Arrhenius plots and their linear regression lines for the diffusion of 3 and 4 h. The correlation coefficient of the linear regression line is a measure of the linear correlation between two variables. As shown in the Arrhenius plots for the diffusion of 3 h and 4 h, all data points of

Arrhenius plots and their linear regression lines for the diffusion at 170°C, 180°C and 190°C for 3 and 4 h.
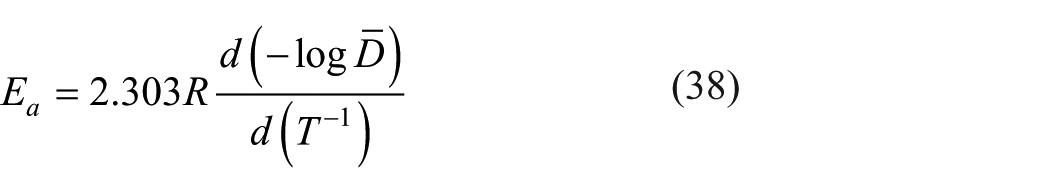
The activation energy of diffusion which indicates the sensitivity of the diffusion rate to temperature was calculated by equation (38) with the slope of linear regression line. The activation energy for 3 h was 30.5 kcal mol−1 as shown in equation (39) and that for 4 h was 27.4 kcal mol−1 as shown in equation (40)


Conclusion
The equation of complementary error function was derived from solving an ODE of the diffusion equation to find a simple and reliable method for the calculation of the diffusion coefficient. A disperse dye in paste was treated at 170°C, 180°C and 190°C for 3 and 4 h for the sublimation diffusion into PET using a film roll method. Quadratic regression analysis on the profile of concentration–distance was used to determine the surface concentration. The diffusion coefficient was calculated by the values of
Footnotes
Declaration of conflicting interests
The author(s) declared no potential conflicts of interest with respect to the research, authorship and/or publication of this article.
Funding
The author(s) received no financial support for the research, authorship and/or publication of this article.