
Abstract
To study the effect of various axial compression ratios on the seismic behavior of reinforced concrete (RC) columns strengthened with textile-reinforced concrete, in this study, an RC column model is established using the finite element analysis software, ABAQUS. This model’s seismic performance under earthquakes is investigated, and the numerical analysis results of the two test pieces are compared with the test results to verify the correctness of the model. The results show that the initial stage of RC loading is under the three-way restraint of the axial force and textile-reinforced concrete material. The yield load and peak load of the textile-reinforced concrete–strengthened RC column increase with the increase in the axial compression ratio. However, the increase in the axial pressure during the loading process accelerates the crack development. The displacement ductility coefficient and the energy dissipation capacity of the specimen are reduced as the axial compression ratio increases. The numerical calculation results of the textile-reinforced concrete–strengthened RC column are in good agreement with the experimental results, indicating that the numerical model based on ABAQUS is reasonable.
Introduction
In recent years, earthquake disasters have frequently occurred around the globe. Many building structures are subject to brittle failure due to insufficient ductility and strength of the column members, which leads to the collapse of the building structure. Collapses cause heavy casualties and economic property losses. Therefore, it is highly important to use effective reinforcement measures to enhance the lateral restraint capacity of concrete column members and improve the seismic performance of the structure.1,2 At present, the traditional concrete column reinforcement methods mainly include the enlarged section method and the outer steel reinforcement method. Both these methods have disadvantages such as considerable influence on the rigidity of the original structure and a complicated construction process.2–4 Therefore, many scholars have recommended fiber-reinforced polymer (FRP) materials.
Currently, FRP reinforcement technology is relatively mature. A lot of experimental studies and related finite element analysis have been conducted. Exploring the influence of FRP reinforcement on the overall performance of concrete members,3–5 Hou et al. 3 established a numerical model of glass fiber reinforced polymer (GFRP) RC columns. The results show that the numerical predictions are in good agreement with the experimental results. Karabinis et al. 4 established a numerical three-dimensional model of axial compression FRP constraints and concluded that FRP constraints can help delay the premature buckling failure of components. Yu et al. 5 established an improved damage plasticity model by introducing damage parameters and improved the numerical prediction of compressed concrete columns. However, owing to the high cost of FRP reinforcement and the bonding material being considerably affected by the environment, 6 scholars have introduced a fiber-reinforced cement-based composite material based on concrete, cement mortar, and paste, a composite material formed using a discontinuous chopped fiber or a continuous long fiber as reinforcing material. Examples include textile-reinforced concrete (TRC) material, 7 textile-reinforced mortar (TRM) material, 8 basalt fiber-reinforced cement mortar (BRM) material, 9 and fiber-reinforced cement mortar (FRCM) materials. 10 The reinforcing effect not only has the advantages of good crack resistance and high bearing capacity but also hardly changes the cross-sectional dimension of the original component after reinforcement, 11 which is one of the alternative methods for seismic strengthening of concrete columns in the future.
At present, scholars from various countries have conducted preliminary experiments and theoretical studies on TRC-strengthened RC columns (bias and seismic analysis). Liu and colleagues12,13 used ABAQUS to simulate the effects of different factors on the mechanical properties of TRC-strengthened RC columns. The results show that there is good agreement between the test and the numerical results, and that TRC can significantly increase the bending ability of the eccentric column. Abadel et al. 8 used ANSYS to simulate the seismic behavior of TRM-reinforced beam–column joints. The results show that the proposed nonlinear finite element model can accurately predict the seismic performance of RC beam–column joints. In the TRC-strengthened RC column, Yin et al. 14 conducted a low-cycle reciprocating loading test on nine TRC-strengthened RC square columns. The results show that TRC can effectively restrain concrete in the core area of the RC column, reduce the damage height of the plastic hinge area of the test piece, and improve the failure mode of the RC column. In addition, Bournas et al. 15 conducted a low-cycle reciprocating loading test using a TRM-strengthened foot-size RC column. The results show that TRM reinforcement is a highly effective method to enhance the cyclic deformation ability and energy dissipation capacity of the column, and its effect is almost equivalent to that of FRP. In addition, Bournas and colleagues16,17 also carried out low-cycle reciprocating loading tests on RC columns with different longitudinal reinforcement buckling and lap lengths. The results show that TRM reinforcement can increase the cyclic deformation and energy dissipation capacity of the RC column with insufficient local strength by delaying the longitudinal reinforcement buckling and preventing bond damage.
So far, preliminary research on the seismic performance of TRC-strengthened RC columns has been carried out. However, the existing research mainly focuses on concrete columns with low axial compression ratio, and there is still no in-depth study of the seismic behavior of TRC-strengthened RC columns with high axial compression ratio. Therefore, it is impossible to meet the reinforcement needs of TRC materials for the bottom pillars of high-rise buildings. This study will, therefore, focus on TRC-strengthened RC columns with different axial compression ratios using the general finite element analysis software ABAQUS, in order to provide a preliminary research basis for increasing the axial compression ratio limit of RC columns.
Numerical model
TRC-strengthened RC column test
Specimen information
This article selects the specimen of Liu et al. 13 as the simulation research object. The column section size is 300 × 300 mm2, the column height is 940 mm, and the overall height of the test piece is 1740 mm. The test piece longitudinal reinforcement diameter is 14 mm, the stirrup diameter is 8 mm, and the pitch is 100 mm. The specific geometric dimensions and reinforcement of the test piece are shown in Figure 1, and the basic parameters of the test piece are listed in Table 1.

Specimen size and reinforcement detailing.
Basic parameters of specimens.

Strengthening method
First, the surface of the specimen was roughened, and the reinforcement area height was 600 mm at the root of the columns. The specimens were moistened with water before strengthening, and then they were coated with fine-grained concrete to a thickness of 2~3 mm. Then the textile was tiled on a template, and a layer of mortar was brushed over the textile, which was wrapped around the column reinforcement area. The wet fiber bundles were kept parallel to the direction of the force, and then the fine-grained concrete was smeared on the surface of the textiles to complete a layer of reinforcement; two layers of reinforcement could be completed by repeating the above steps.
Material properties
Concrete and steel bar
In this study, the damage plasticity model in ABAQUS is used to simulate the irreversible damage that occurs during concrete crushing. 18 The uniaxial compression–stress–strain relationship of concrete is the concrete model proposed by Hognestad et al. 19 in 1951, and it is also recommended in Abadel et al. 8 The uniaxial tensile stress–strain relationship of concrete is based on the concrete model proposed by Jiang 20 of Tsinghua University, based on the test results. The constitutive relationship of the steel bar is selected from the threefold line model. The relevant parameters of yield stress and ultimate tensile strength of steel bars in the numerical model are given in Table 2. 21
Mechanical properties of steel bar.

TRC material
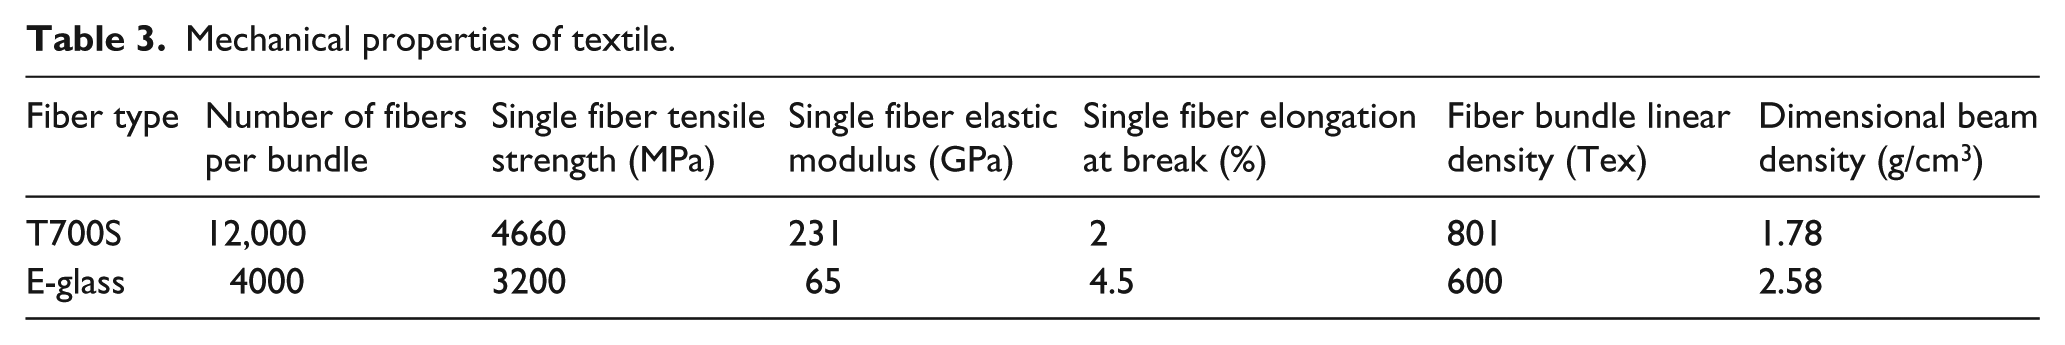
In this study, the method of Liu et al. 13 is used to divide the TRC material into textile and fine concrete to simulate the performance of the material. The relevant parameters of the textile required in the numerical model used in this article are given in Table 3. 21 The warp fiber bundle and the weft fiber bundle of the textile are assumed to be ideal linear elastic materials, that is, when the fiber bundle reaches the ultimate strength, it is determined to be broken. The constitutive relationship of concrete is assumed to be a concrete material.
Mechanical properties of textile.
Units and meshing of materials in the ABAQUS model
According to the force and deformation characteristics of the model, better convergence is achieved during analysis. Concrete with an eight-node reduced integral solid element (C3D8R) is used. Reinforcement uses a two-node truss unit (T3D2). Both the warp fiber bundle and the weft fiber bundle of the fiber woven mesh are assumed to be ideal linear elastic materials using a two-node truss unit (T3D2). Model unit meshing is performed by structured adaptive meshing. The corresponding element mesh is automatically generated by ABAQUS, the physical finite element model of the model and the mesh division.
Contact and interaction
In the TRC-strengthened RC column model, the contact relationship between the loading end plate and the core concrete is based on the “TIE” constraint; that is, sharing nodes and working together to ensure effective delivery of loads. In this study, it is assumed that steel and concrete, as well as textile and fine concrete, are completely bonded, and no relative slip occurs, that is, the “inlay” constraint is used.
Loading and boundary conditions
The bottom of the column of the model adopts a fixed constraint, which constrains all degrees of freedom of all nodes at the bottom of the column pier. In addition, the allowable displacement of the side of the column and the horizontal load is set to 0, to avoid displacement of the column during loading. The axial pressure at the top of the column and the horizontal reciprocating load are applied through a reference point coupled to the top loading plate. The model is recorded in displacement mode, and the loading mode of this model adopts the displacement control mode; the loading system is shown in Figure 2 and the loading apparatus is shown in Figure 3. Loading control is carried out by increasing the yield displacement step-by-step. Loading is carried out twice at each stage. When the horizontal reaction force drops to about 85% of the ultimate load, loading is completed.
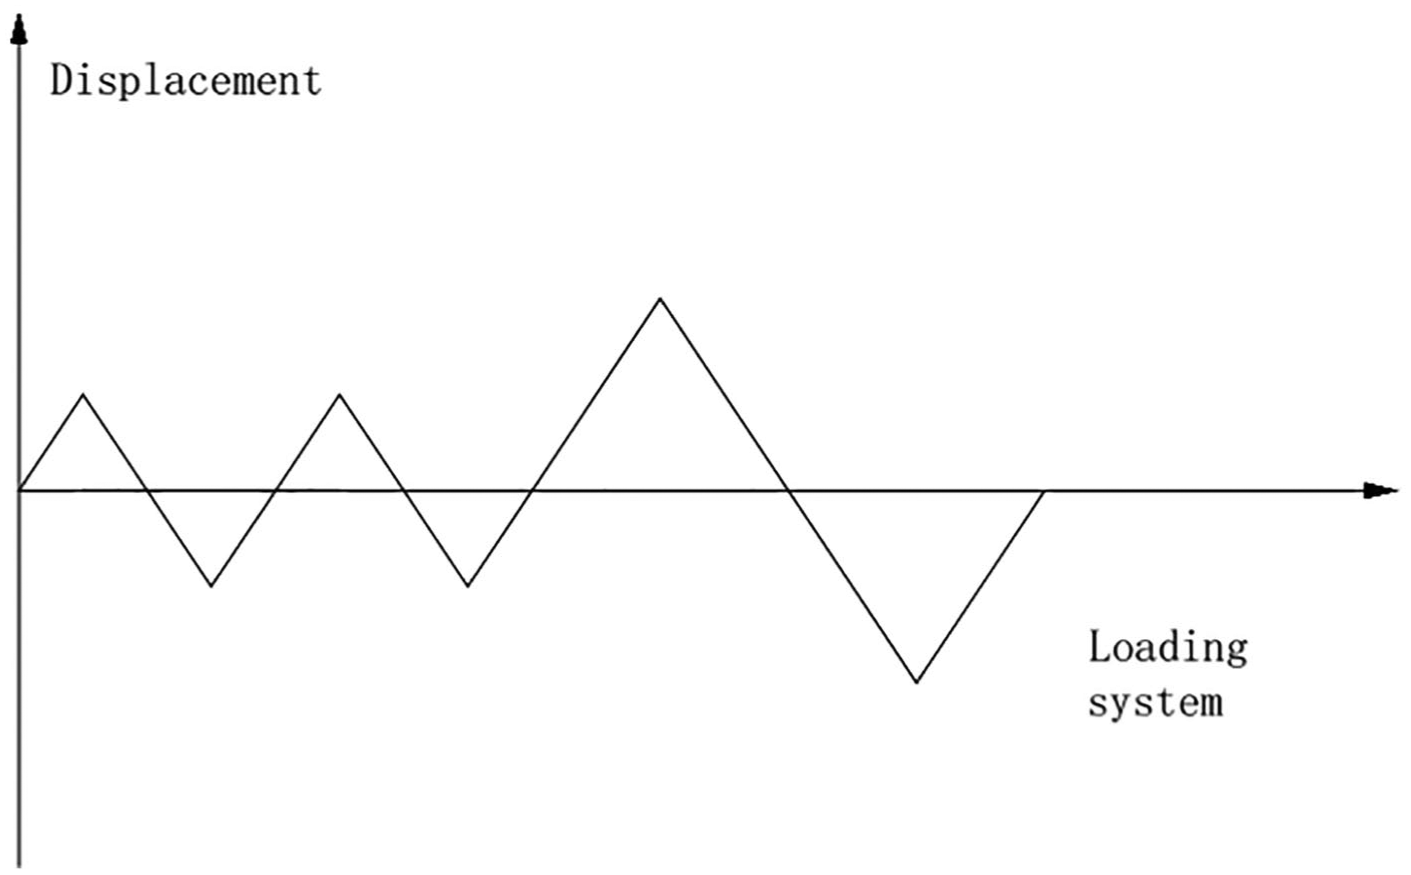
Loading system.

Loading apparatus: (a) actual test loading apparatus and (b) simulated test loading apparatus.
Model verification
Comparison of calculation results of different theoretical models
From Figure 4, it can be seen that the results calculated by Hognestad et al. 19 and Jiang 20 in their constitutive models can effectively simulate the tension cracking, compression cracking, and stiffness degradation of TRC-strengthened RC columns under low-cyclic reciprocating loads, compared with those calculated by the Code for design of concrete structures (GB50010-2010) 22 and Guo et al.’s 23 constitutive model; hence the theoretical model selected in this article is more reasonable.
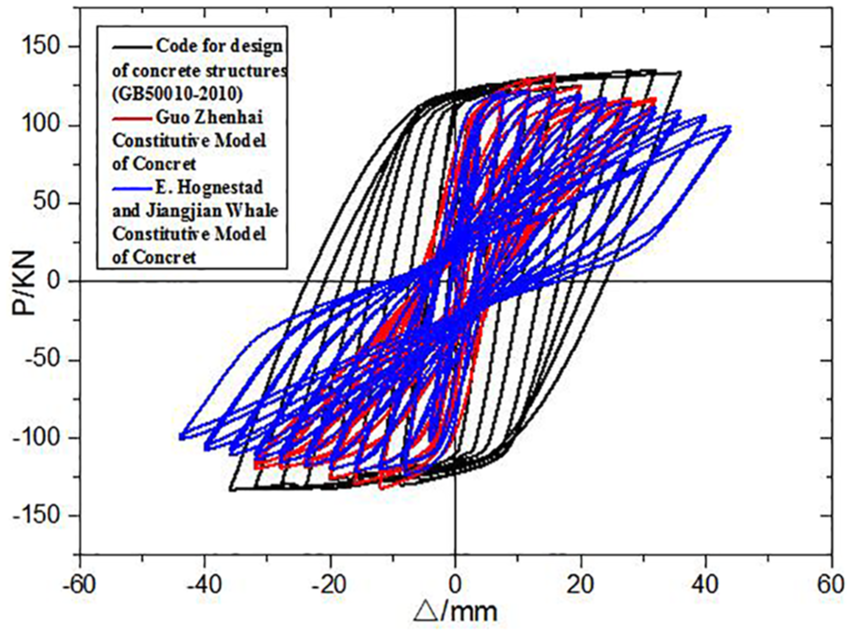
Comparison of calculation results of different theoretical models.
Comparison between numerical and experimental results
This article selects the specimen of Yin et al. 14 as the simulation research object; finite element analysis was carried out, and the numerical calculation results and experimental results were compared to verify the feasibility of using ABAQUS for the physical modeling and finite element analysis of TRC-strengthened RC columns. It can be seen from the hysteresis curve of each test piece in Figure 5 and in Table 4 that the load–displacement hysteresis curve obtained by finite element analysis is more consistent with the overall trend of the test curve. However, there is a certain gap between the calculated load–displacement hysteresis curve and the actual load–displacement hysteresis curve of TRC-constrained concrete. This is because the numerical model established in this article does not produce experimental errors during the loading process. For example, there is no negative slip in the model during the loading process. However, in the actual test in the negative loading process, due to reasons of test equipment and inaccuracy of physical alignment before the beginning of the test, negative slip occurs. Moreover, the damage degree of material in the numerical model under low cyclic reciprocating load is smaller than that in the actual test. Figure 6 shows the skeleton curve of each test piece, as is also shown in Table 4. The skeletal curve obtained by finite element analysis is in good agreement with the overall trend of the test skeleton curve. However, the limit value of the skeleton curve obtained by finite element analysis is higher than that of the test skeleton curve, and the displacement reaching the limit value is also smaller than the experimental value. This is mainly because the concrete constitutive relation in finite element analysis is based on uniaxial stress and strain and neglects the bond slip of steel and concrete. A low-cycle reciprocating loading test is conducted. During the test, the stiffness and strength of the concrete are reduced to varying degrees under reciprocating loads, and the steel and concrete also produce a small bond slip. Combined with the actual situation of the test, it is reasonable to increase the limit value of the skeleton curve obtained by finite element analysis.

Hysteresis curves of concrete columns.
Comparison of calculation results and test results data.


Concrete column skeleton curve comparison chart.
Numerical calculation results and analysis
This section presents an analysis of the influence of axial compression ratio on the seismic performance of RC columns. Generally, under the action of seismic load, the larger the axial compression ratio of the test piece is, the more likely the bending shear damage or even the shear failure is. Therefore, it is highly important to study the influence of axial compression ratio on the test piece.
Stress–strain cloud analysis
In this study, the strain cloud diagram of zonal (enhancement direction) carbon fiber under different axial compression ratios under the same displacement load conditions is analyzed. From the strain cloud diagram of the carbon fiber bundle in Figure 7, the strain of carbon fibers of specimens with large axial compression ratio (e.g. specimens C3 and C4) is larger and the distribution range is wider, but the carbon fiber strain does not exceed the maximum tensile strain (0.0085) during the loading process, which indicates that for specimens with relatively large axial compression ratio, the carbon fiber can fully exert the restraining effect during the load application process, and the utilization rate of the carbon fiber is higher. In addition, as shown in Table 5, the bearing capacity of the strengthened specimens with relatively large axial compression ratio is enhanced more obviously, which indicates that the use of TRC to reinforce the large axial compression ratio specimens can better meet the economic principle in the project.

Carbon fiber bundle strain cloud.
Result of each test piece.

Hysteresis curve analysis
In this study, based on the skeleton curve, the graphing method 24 is used to obtain the yield load Fy and the yield displacement Δy. The peak load is the maximum value on the skeleton curve, and the corresponding displacement of the peak load on the skeleton curve is the peak displacement, where the ultimate load takes 85% of the peak load. The numerical calculation results are listed in Table 5. It can be seen that the yield load and peak load of the TRC-strengthened RC column increase with the increase in the axial compression ratio. This is because the presence of axial force delays the occurrence of concrete cracks, limits the development of cracks, and reduces the stress in the tension zone, thereby increasing the bearing capacity of the member; however, the displacement ductility coefficient and energy dissipation capacity of the RC column are reduced as the axial compression ratio increases. The reason for this is that the specimen subjected to horizontal load easily yields to the large pressure in the compression zone. Longitudinal cracks are generated, and the bearing capacity decreases rapidly.
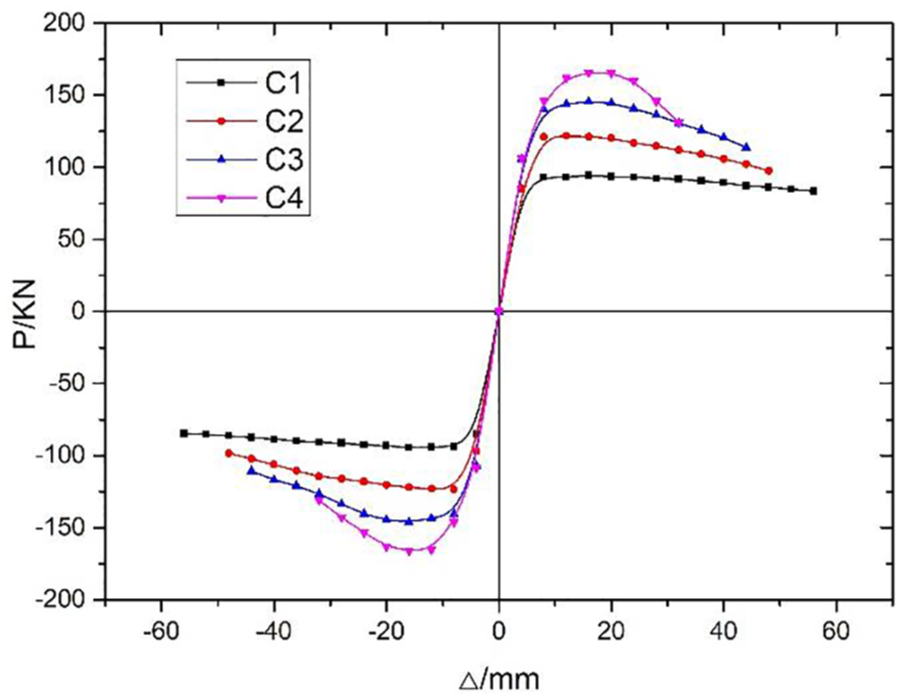
The hysteresis curve of each test piece is shown in Figure 8 and in Table 5. For specimens C1 and C2 with small axial pressure, the bearing capacity decreases slowly after reaching the maximum value and a smooth section appears. The number of hysteresis loops is large, and the specimen column has strong deformation ability. Test pieces C3 and C4 with relatively large axial pressure, especially test piece C4, have a lower bearing capacity after the bearing capacity reaches the maximum value. The ultimate displacement is reduced, and the deformation of the specimen column is weakened. This shows that for RC columns, the smaller the axial compression ratio is, the better the ductility and seismic performance.

Concrete column hysteresis curve comparison chart.
Skeleton curve and stiffness degradation analysis
The skeleton curve of each test piece is shown in Figure 9. According to Table 5, the yield load of test pieces C2, C3, and C4 is, respectively, 27.91%, 50.00%, and 69.77% higher than that of test piece C1. The peak load increased by 28.72%, 54.26% and 75.53%, respectively, compared with test piece C1. This finding shows that as the axial compression ratio increases, the yield load and peak load of the specimen also increase. This result is because the presence of axial force delays the occurrence of concrete cracks, limits the development of cracks, reduces the stress in the tension zone, and improves the bearing capacity of the specimen. However, as the axial compression ratio increases, the ultimate displacement of the test piece decreases, which shows that the deformation ability is weakened; that is, the larger the axial compression ratio is, the worse the seismic resistance of the test piece.
Concrete column skeleton curve comparison chart.
To study the stiffness degradation, in this study, the tangential stiffness of the specimen under cyclic loading is calculated using the recommendations of Deng et al. 25 The stiffness degradation curve is plotted as shown in Figure 10. In this figure, η is the ratio of the stiffness of the hysteresis loop to the yield stiffness, and β is the ratio of the peak displacement to the yield displacement. As seen in Figure 8, the stiffness degradation rate of each test piece is largely the same before the yield load. This is because the specimen is still elastically deformed before the yield point. After the yield load point has passed, the stiffness degradation rate of the specimen gradually increases with the increase in the axial compression ratio, and the total length of the degradation curve is gradually reduced. This is because the large axial force causes the height of the concrete compression zone to decrease and the rate of stiffness degradation to increase.

Stiffness degradation curve comparison chart.
Energy dissipation capacity analysis
The accumulated energy dissipation capacity curve in Figure 11 and Table 5 shows that the total energy dissipation capacity of test pieces C2, C3, and C4 is reduced by 40.84%, 59.16%, and 67.18%, respectively, compared with test piece C1. It can be seen that the energy dissipation capacity of the test piece is enhanced with decrease in the axial compression ratio. The energy dissipation capacity rate of each test piece is largely the same before the yield point, but the energy dissipation capacity rate of the member gradually decreases with the increase in the axial compression ratio within a certain range after the yield point. This result is because under the large axial pressure of the specimen subjected to horizontal load, the steel in the compression zone is easy to yield, longitudinal cracks are generated, the bearing capacity decreases rapidly, and the energy dissipation capacity of the component is weakened.

Energy dissipation capacity curve comparison chart.
Conclusion
This study uses the finite element analysis software ABAQUS. The finite element analysis model of TRC-strengthened RC column is established by modeling, selecting constitutive relations, determining unit type, interface processing and meshing, and verifying the correctness of the analytical model.
For specimens with a large axial compression ratio, carbon fiber can fully play the role of restraining in the process of loading, and the utilization ratio of the carbon fiber is higher. The bearing capacity of the specimens with large axial compression ratio increases more obviously, but with the increase in the axial compression ratio, the displacement ductility coefficient of the strengthened columns will show a significant downward trend.
For the TRC-strengthened RC column, the stiffness degradation rate of each test piece is largely the same before the yield load. After the yield load point has passed, the stiffness degradation rate of the specimen gradually increases with the increase in the axial compression ratio, and the total length of the degradation curve is gradually reduced.
The energy dissipation capacity of the TRC-strengthened RC column is enhanced as the axial compression ratio is reduced. The energy dissipation capacity rate of each test piece is largely the same before the yield point. However, after the yield load point has passed, the energy dissipation capacity rate of the member increases with the increase in the axial compression ratio, which is similar to the law of bearing capacity of the member.
Footnotes
Acknowledgements
The experimental work described in this paper was conducted at the Jiangsu Key Laboratory of Environmental Impact and Structural Safety in Civil Engineering in the China University of Mining and Technology. Help during testing from the staff and students at the laboratory is greatly acknowledged.
Declaration of conflicting interests
The author(s) declared no potential conflicts of interest with respect to the research, authorship, and/or publication of this article.
Funding
The author(s) disclosed receipt of the following financial support for the research, authorship, and/or publication of this article: The authors received financial support from the Fundamental Research Funds for the Central Universities (2017XKZD09).