
Abstract
In the clothing industry, the understanding of the quality is a major issue to well meet the customer needs. The dilemma that faces manufacturers is to find the balance between good quality and “overquality,” what the quality criteria are, and how to target requirements specifications. The aim of this study was to propose a multi-attribute ranking method of products. Ranking is based on an overall quality score. The quality score, here called consumer-based quality, is computed via the combination of textile testing and consumer perception to deterioration. Such a perception has been surveyed, and damage that can lead to end of life has been investigated. Collected data have been translated into a consumer sensitivity using multi-criteria decision making and fuzzy techniques. The fuzzy analytic hierarchy process has been used. Five damage categories have been weighted. A selection of appropriate tests according to standards has been completed to test the product resistance to the damage. The tests results have been computed with the consumer sensitivity to obtain the consumer-based quality score. Finally, the ranking method is applied on T-shirts, and a single score ranking is made possible and objectively depict perceived quality.
Keywords
Introduction
In the clothing industry, the understanding of the quality is a major issue to well meet the customer needs. The dilemma that faces manufacturers is to find the balance between good quality and “overquality,” what the quality criteria are, and how to target requirements specifications. The goal is thus to find the optimal quality product which perfectly fulfill the consumer expectations and perceptions. Because textile durability is commonly studied on specific performances, like in the case of protective clothing, 1 it is often considered to be synonymous with quality. Textile durability translates “the ability of textile to endure and to maintain its essential and distinctive characteristics of strength, dimension, and appearance.” 2 A product could be defined as durable if it is physically and emotionally durable.3–5 Textile testing does not directly translate the durability of fabric or clothes. It is based on standardized tests which deal with specific quality issue, sometimes related to aging, but not to the interactions between the multiple real life stresses. De Saxcé et al. 6 studied bedsheet and translated performances into a durability indicator. However, this indicator is only based on two standardized tests: abrasion resistance and color fastness. As a limit, De Saxcé et al. concluded that the indicator accuracy could be improved including additional tests. There is a lack in scoring the durability and quality of textiles products with multiple attribute.
Some research proposed to evaluate and rank quality of fibers or material following multiple criteria. Ranking models are based on multi-criteria decision making (MCDM). Others research use MCDM to optimize process parameters with the aim to produce a desired quality. Majumdar et al. 7 investigated the navel selection problem of rotor spinning technology. Ten navels were compared relatively to quality parameters of the produced yarns. Two MCDM techniques were used with specifics aims: analytic hierarchy process (AHP) to evaluate the relative importance of the quality parameters and technique for order preference by similarity to ideal solutions (TOPSIS) for the final ranking of the navel. It finally results in a flexible method to help in the optimization of machine part. Hossain et al. 8 focused on the dyeing process and developed a predictive model of color strength. He built a fuzzy knowledge-based model to predict the color strength of cotton knitted fabrics regarding dyeing parameters. As a result, the developed tool helps in selecting and adjusting the process parameters to achieve desired color strength. In its study, Su and Kuo 9 also investigated process parameters with a focus on melt spinning of PET/TiO2. The aim was to find optimal parameters regarding desired mechanical properties of ultraviolet (UV)-cut polyester fiber. The use of fuzzy techniques allowed improving the process efficiency and finding the optimal parameters using the least number of experiments. Jeguirim et al. 10 provided a tool to assist the product design. It focuses on the relationship between tactile sensory attributes and instrumental measurements. Jeguirim et al. study involved a trained panel to evaluate the sensory attributes. In such a case, fuzzy models enable a better integration of perception and linguistic value. As a result, the developed model may help industrialists to meet the needs of consumer. Regarding the material ranking, Shokr et al. 11 investigated material selection for high-tech industries. Selection was made regarding performances of material following qualitative and quantitative criteria. Facing qualitative data, a new MCDM model has been proposed. Majumdar, 12 Majumdar and Ghosh, 13 and Chakraborty and Bandhopadyay. 14 both studied the fibers quality with the aim to select the best raw materials (cotton fibers) for spinning industry. Majumdar underlined that the selection was unstructured and proposed the use of advanced decision science techniques. He specifically focused on fuzzy techniques as the selection problem is full of imprecision. The goal was to select the best cotton fibers to maximize the yarn tenacity. As a result, he developed a model based on Fuzzy AHP (FAHP) which is able to translate the perception of decision maker, quantitatively. Choudhuri 15 and Ghosh and Das 16 both proposed an AHP-based model for raw jute grading. In both cases, jute fibers were analyzed following six criteria (strength, defect, root content, color, fineness, and density). These criteria are compared through AHP or multiplicative AHP (MAHP) in case of Choudhuri and are integrated in an MCDM method. Choudhuri improved the Bureau of Indian Standards (BIS) method allowing to compare fibers with very little differences. The models facilitate to objectively grade the fibers and help in the selection of fibers relatively to the desired application. Further down in the supply chain, Mitra et al. 17 focused on handloom cotton fabrics with the aim to rank and select the best fabric relatively to a specific end-use which was summer clothing. Twenty-five fabrics were judged regarding three criteria (air permeability, thermal resistance, and drape). The three criteria weights were independently established through AHP and MAHP. Two singles scores and two ranking were finally proposed with a high correlation coefficient. The method finally helped in the selection of an appropriate fabric for summer clothing. The method could be applied to various situations.
As a conclusion, previous studies highlight that there are existing methods to evaluate the quality of product regarding multiple criteria. Criteria come from process parameters when a specific quality is expected or come from tested performances when the aim is to grade. In both cases, the use of MCDM is particularly useful to help to objectify the quality. To the best of our knowledge, there is no existing model to evaluate the quality of product as a function of the consumer. There are existing surveys in the clothing sector, and the consumer behavior is partially known. WRAP association studied the reasons for clothing disposal. The third reason in the disposal decision is technical, 18 but it is not fully detailed. The knowledge of these technical reasons would help to evaluate the quality of end product. This would also enable to fulfill the need of additional performance tests in the durability indicator, underlined by De Saxcé et al. 6
In this study, a methodology is proposed to address the lack in scoring the quality of textile products from their technical performances and the deterioration perception. Deterioration perception, called here consumer sensitivity, is evaluated from survey data and an MCDM method. An FAHP tool is proposed in this study and enables the subjectivity of respondents to be taken into account. As illustrated in Figure 1, the factors of product replacement or disposal are highlighted and integrated into the calculation of a consumer-based quality score.

Principle of the consumer-based quality scoring system.
The remainder of this article is structured as follows. Section “Consumer sensitivity to textile deterioration” describes the survey used to explore the disposal behavior and the computation method of the consumer sensitivity. Section “Consumer-based quality scoring method” details the consumer-based quality score, from its calculation method to the implementation on the T-shirt case. The final section is the conclusion.
Consumer sensitivity to textile deterioration
Survey presentation
Clothes are very personal and there are a huge number of ways to use and to dispose them of. It is very hard to determine a single way to use our clothes, and why are clothes disposed of.
To better understand the consumer sensitivity of textiles deterioration, a survey has been conducted on the use and disposal of textile products. Seven clothes categories have been investigated: T-shirts, sweaters/cardigans, shirts, trousers, undergarments/socks, coats/jackets, and bed-sheets. However, for an easier understanding, only T-shirt case is considered in the following.
The survey includes 851 answers of French people in the 15-plus age group. The distribution is as presented in Table 1.
Sample characteristics.

The survey is composed of three sections:
Respondent information (location, gender, age, and socio-professional category);
Laundry habits (sort laundry, day of use before washing, type of washing, dryer, and ironing);
Disposal habits (repair and disposal habits and damage that lead to a disposal).
The evaluation of consumer sensitivity relative to the different damage is based on the results of the third section. An example of a typical question of this survey is illustrated in Figure 2.
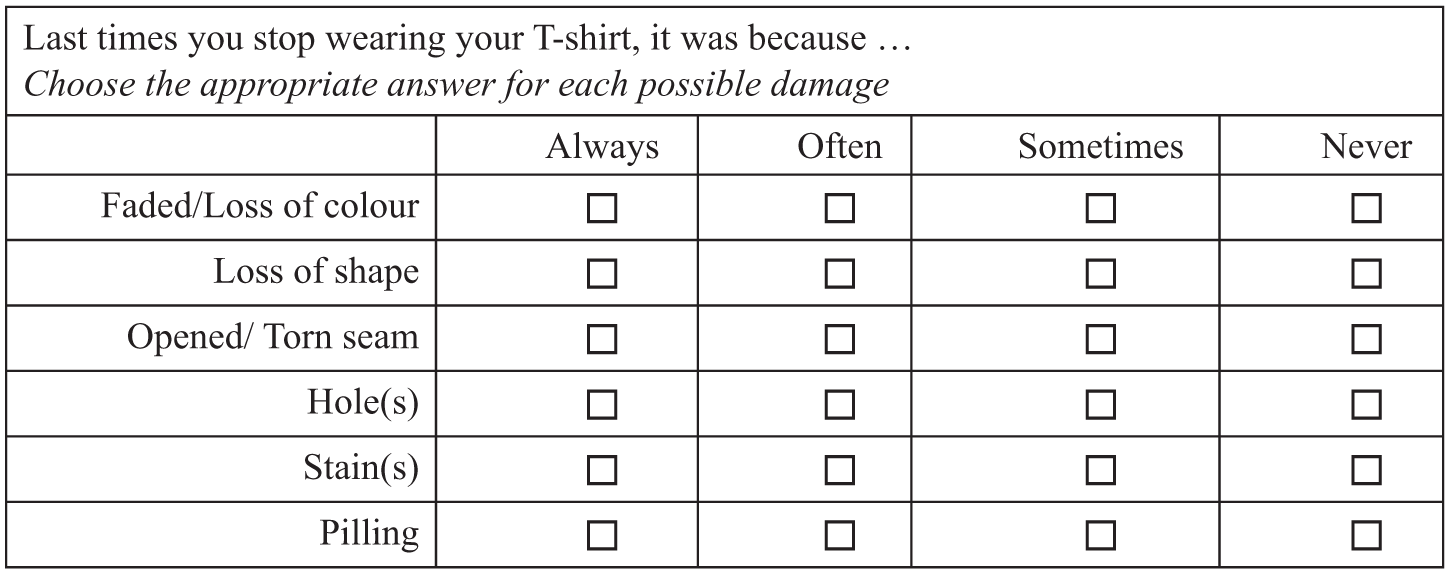
Disposal habits—damage that lead to a disposal.
In order to ensure a better understanding and an easier response, disposal frequency is expressed via four grades on a scale from Always to Never. Figure 3 shows the distribution of the answers related to the end of life causes. To evaluate the consumer sensitivity, these answers should be translated into crisps values, but the main difficulties in the interpretation of these responses are the following:
Criteria are not of equal importance;
Criteria are expressed in a linguistic scale;
Meanings of each criterion are very personal.
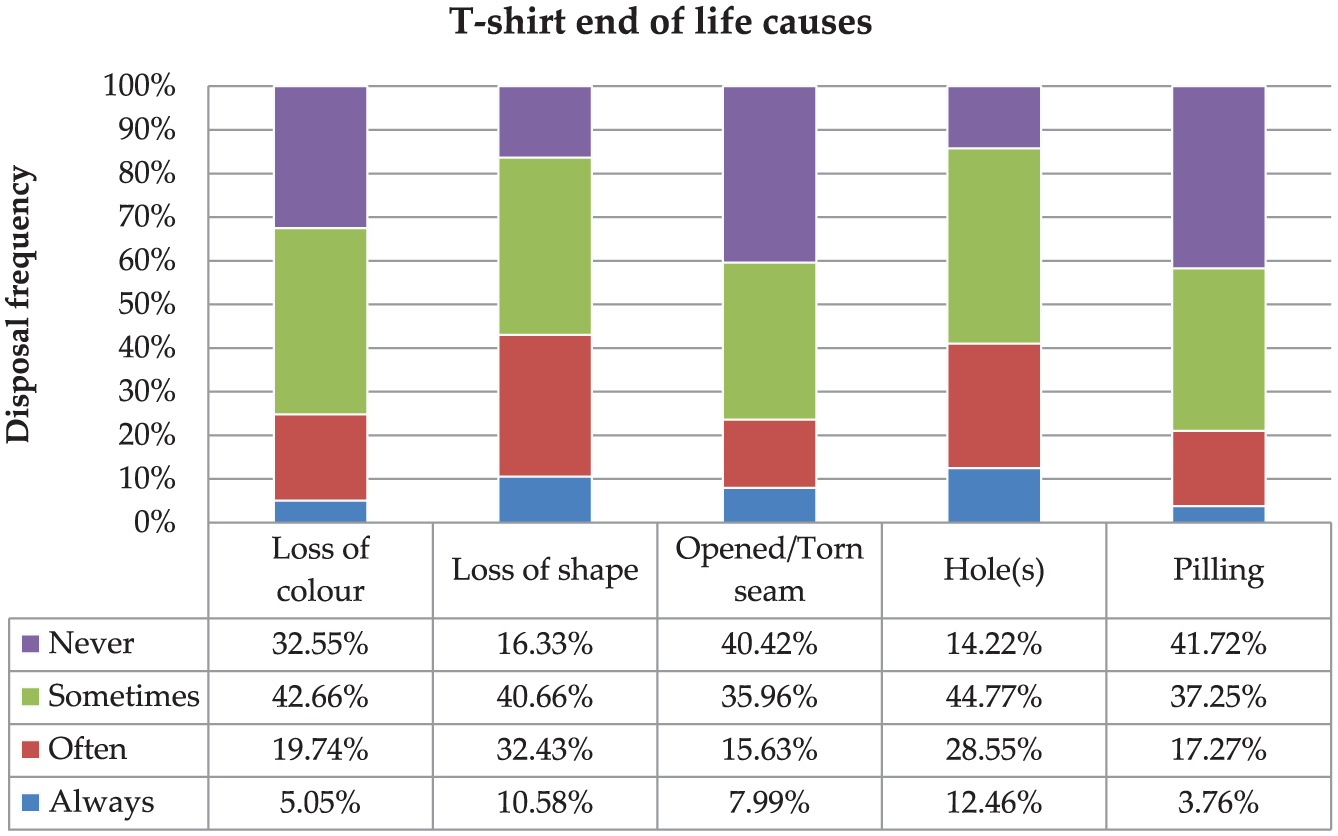
Answers distribution of the question: “Last times you stop wearing your T-shirt, it was because.”
As a result, we developed an MCDM model to extract the valuable information from this survey.
MCDM model
MCDM refers to making decisions in problems where multiple criteria have to be considered. 19 There are many methods available for solving MCDM problems according to the types of variables or the objective. The two main categories of MCDM problems are the following:20–23
Multiple attribute decision making (MADM) corresponding to an evaluation with a discrete decision space and a predetermined set of alternatives;
Multiple objective decision making (MODM) related to continuous decision space.
The problem faced in this article corresponds to the MADM problem.
The first step in an MCDM process is the definition of the attributes (goal and criteria) and the alternatives: 24 the alternatives represent the different choices available to the decision maker; the criteria represent the different dimensions from which the alternatives are evaluated, criteria can be conflicting criteria. 22
AHP
The AHP developed by Saaty 25 is one of the most widely used MADM technique due to its simplicity and flexibility. AHP can deal with quantitative and qualitative data and relies on hierarchical problem decomposition. It is an appropriate tool to help in the translation of behavior data coming from an untrained panel.
The principle is based on problem modeling (goal, criteria, and alternatives), and weights evaluation,26,27 and can be split down into seven steps: 28
State the problem;
Broaden the objectives of the problem;
Identify the criteria that influence behavior;
Structure the problem in a hierarchy of different levels constituting goal, criteria, sub-criteria, and alternatives;
Compare each element in the corresponding level and calibrate them on the numerical scale;
Perform calculations to find the maximum eigenvalue, consistency index (CI), consistency ratio (CR), and normalized values for each criteria/alternative;
If the maximum eigenvalue, CI, and CR are satisfactory then the decision is taken based on the normalized values, or else the procedure is repeated till these values lie in a desired range.
The crucial step in this process is the pairwise comparison of the criteria, especially when this comparison relies on human evaluation. The scale used for the comparison can be numerical, verbal, or graphical. The verbal scale has the advantage to be more intuitive and easier to understand, but the words can be ambiguous, imprecise, and have different meanings according to the user. To overcome this problem resulting from the human interpretation, fuzzy techniques emerge as one of the most suitable solution. 29 To improve further the reliability, it is recommended to perform the pairwise comparison of the criteria with several experts. Three experts are involved and a compromise is found. The analysis of a survey clearly requires a specific attention on the issue of human interpretation. Consequently, we developed a Fuzzy AHP method to deal with analysis of our survey results.
Fuzzy set theory, triangular fuzzy numbers
The fuzzy set theory (FST), introduced by Zadeh, 29 provides interesting tools to deal with uncertainties coming from vague data related, for instance, to human subjectivity or the vagueness of verbal language. A fuzzy set is a class of objects with a continuum of grades of membership. Such a set is characterized by a membership function, which assigns to each object a grade of membership between zero and one. Triangular membership function which is one of the most commonly used in FST 30 is used for the definition of fuzzy number in this study.
A membership function

where l ≤ m ≤ u, and

Triangular fuzzy number.
For


FAHP algorithm
To combine the AHP and the FST, the Chang’s extent approach which is one of the most common and a quite easy method has been successfully implemented in many studies.30,33–35 Thus, our proposed model is based on this method. For more details on the Chang’s extent approach, readers are invited to refer to Chang 32 and Kahraman. 36
The Chang’s extend approach is based on the definition of a fuzzy conversion scale to quantify the differences between the criteria. The usual scale of AHP is a crisp nine-point scale. However, in FAHP study the conversion table uses a scale with six-grades.33,37–41 It converts six linguistic values into six TFNs. Since TFNs allow values’ overlapping, we do not need such refinement. Six grades are more distinct and help experts’ decisions. The scale is presented in Table 2. 36
Triangular fuzzy conversion scale.

Group judgments
In this study, a group of three experts is composed for this task. Each expert has to give his own evaluation through a pairwise comparison matrix using the linguistic scale in Table 1. The three evaluations are translated into three fuzzy pairwise comparison matrices and next combined into a single fuzzy pairwise comparison matrix using a geometric mean. This approach is recognized as an appropriate method to combine the judgments42,43 when experts are considered equal. The geometric mean is then the mathematical equivalent of consensus.44,45
For


Implementation on the T-shirt case
Using the survey introduced previously, the problem is to translate the answers distribution in Figure 3 into a crisp sensitivity. The goal is to determine the end of life cause of a T-shirt. Five damage categories were proposed and are to be ranked relatively to their importance in the disposal decision. These are the alternatives “A.” Alternatives ranking will help in the selection of the main end of life cause. In order to build the FAHP model, the following alternatives and criteria are considered:
A1 = Loss of color;
A2 = Loss of shape;
A3 = Opened/Torn seam;
A4 = Hole(s);
A5 = Pilling.
These alternatives are judged with respect to one criteria “C” and four subcriteria “SC”:
C = Disposal frequency;
SC1 = Always;
SC2 = Often;
SC3 = Sometimes;
SC4 = Never.
Subcriteria translating a frequency are all interdependent. Figure 5 shows the interdependence of subcriteria and the hierarchy of the problem faced.

Problem hierarchy.
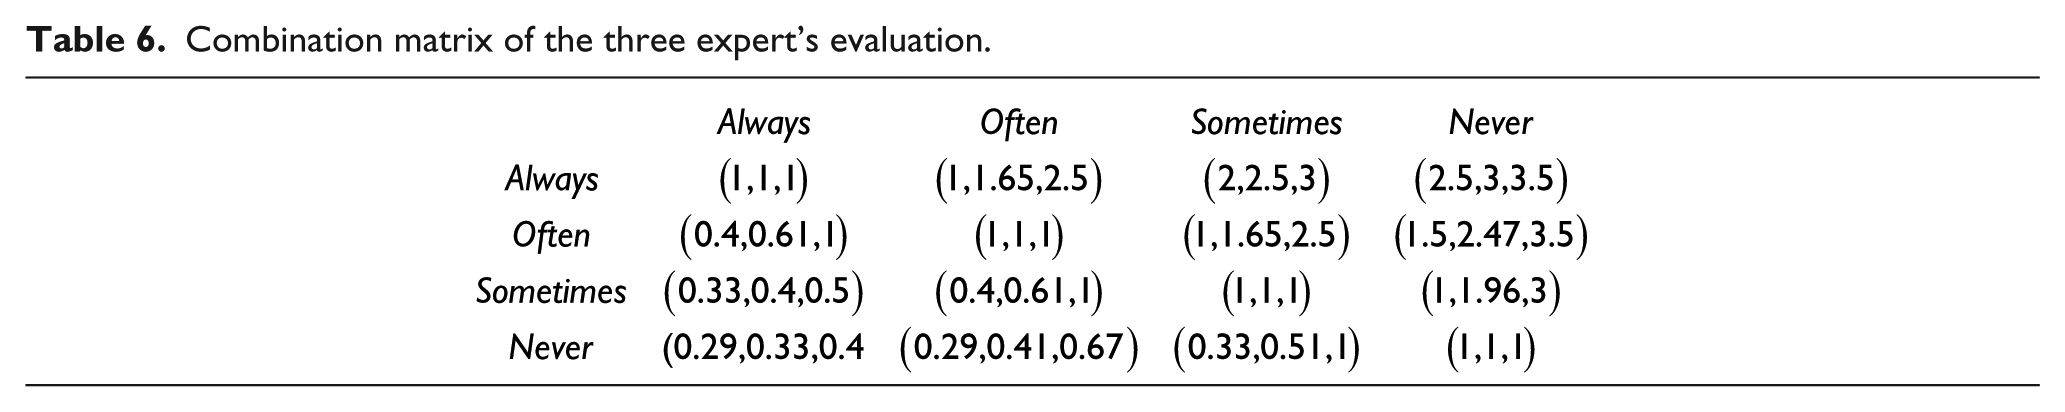
As a first step, the linguistic scale, in Table 2, is used to help experts to compare the four subcriteria, considering the goal. The three linguistic comparison matrices in Tables 3 to 5 are built and translated into fuzzy comparison matrices using the TFNs, in Table 2. Equations (6) to (8) made the experts consensus in Table 6.
SC expert1 linguistic comparison.

SC: subcriteria.
SC expert2 linguistic comparison.

SC: subcriteria.
SC expert3 linguistic comparison.
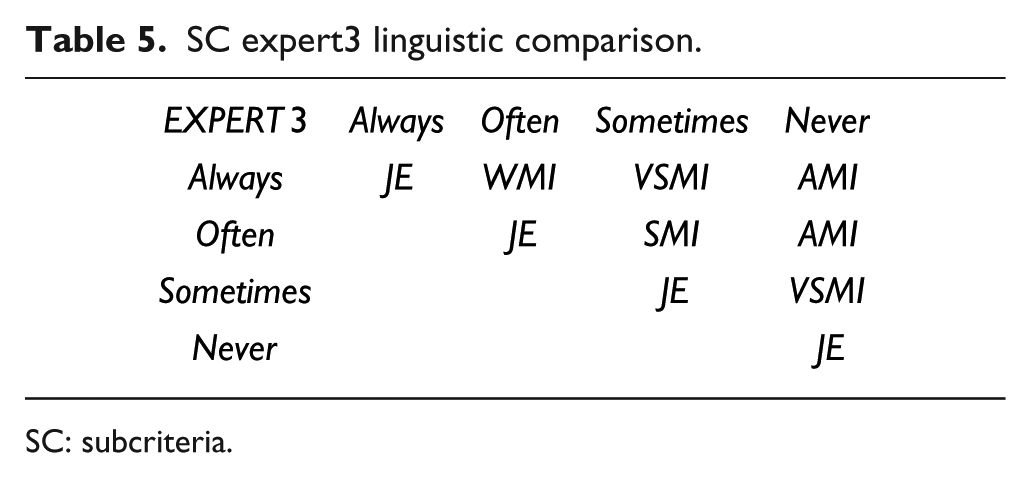
SC: subcriteria.
Combination matrix of the three expert’s evaluation.
Maximum eigenvalue, CI, CR, and normalized values have been calculated following the Chang’s extent approach.32,36
Each subcriteria have been weighted from
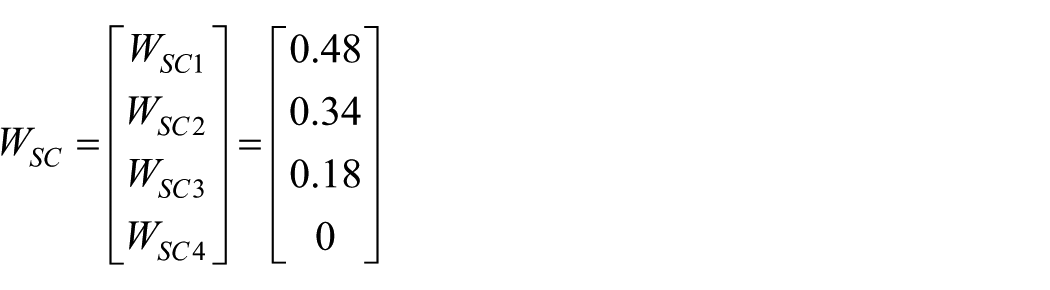
The next step was to build evaluation matrices of alternatives with respect to each subcriteria. All the alternatives have thus been evaluated by the three experts using the raw results illustrated in Figure 3, and the linguistic scale in Table 2. Finally, the following matrix

Ranking of alternatives is given by the weighted sum of alternatives evaluations and subcriteria weights 32

It has been calculated that the two main alternatives in the disposal decision are the A2 and A4. This means that loss of shape and holes are the critical reasons why people throw away their T-shirts. More especially, this model enables the consumer sensitivity to deterioration to be quantified through the relative importance of each damage in the disposal decision in Table 7.
Consumer sensitivity.

In the following, a methodology is proposed to calculate a consumer-based quality score, combining these relative importance and standardized performances tests.
Consumer-based quality scoring method
Principle
The proposed model aims to score a consumer-based quality, combining existing textile tests and the consumer sensitivity previously calculated. Such a quality score has the advantage to take into account the consumer and translates the overall quality of a product as it is perceived by the average consumer. This single and comprehensive score is also an easier way to compare product qualities.
In the following, the description of the proposed model is specific to the T-shirt. Each type of damage is associated with a set of tests. Table 8 shows the tests selected considering the use phase, textile expertise, literature review,46–48 and companies’ standards.
List of selected standardized tests.

In the computation process of the quality score, illustrated in Figure 6, the results of each test are first normalized using the Min-Max method. Features are normalized in the range [0, 1] using the following equation 49

Where

Computation process of the quality score.
Implementation
With our proposed model, we evaluate the quality score of five T-shirts coming from the market. All the tests presented in Table 8 have been performed on each T-shirt, following the standards. Results are summarized in Table 9. Regarding these results, there is no clear trend to state the best or the optimal T-shirt: TS2 has low score regarding the loss of color and seam resistance, and good result for pilling. TS5 is exactly the inverse, and TS3 has satisfying performances for the shape deformation but failed to seam resistance and holes resistance.
T-shirts tests results.

CF: colour fastness.
Note: Bold values distinguish Minrr and Maxrr rows from T-shirts tests results.
The 10 tests have specific results, some are like a benefit functions (more is better) and others are like cost functions (less is better). Consequently, results have been preprocessed with the aim to target the less the better. Calculation method such as preprocessed data are specified in Table 10. Table 11 sets out the normalized results obtained using equation (9), which is necessary to calculate the final score.
Preprocessed results.

TS: T-shirt.
Note: Bold values distinguish Minpr and Maxpr rows from Tshirts’ one.
Normalized results.

Table 12 sets out the average score obtained by each T-shirt and the consumer-based quality score.
Consumer-based quality score.

All these five T-shirts have been tested regarding specific damage. Knowing the consumer sensitivity to these damage, it has been possible to rate T-shirts to conclude which is the optimal. The T-Shirt TS1 obviously appears as the best quality (lower quality score) of the 5 T-Shirts used for comparison. Thus, the proposed method is a direct way which can handle such quality grades.
Conclusion
The first contribution of this study is to determine and quantify the technical damage which can lead to the disposal of textile products. The damage have been surveyed and translated in a consumer sensitivity criteria using MCDM method combined with fuzzy techniques. Finally, in the T-shirt case, five damage have been identified: loss of color, loss of shape, opened/torn seam, hole(s), and pilling. All have been weighted regarding its importance in the disposal decision. Loss of shape and hole(s) appear as the two main reasons with 26% and 27%, respectively. Opened seam, loss of color and pilling are, respectively, rated 18%, 15%, and 14%.
This sensitivity criterion is an interesting information for manufacturers, as it highlights where efforts are required and could be improved with a particular interest in the damage intensity: color degradation, holes size and position, and pills size.
The second contribution is a proposed method to calculate a quality score as a function of the consumer sensitivity. Such a quality score is called consumer-based quality. It has the advantage to merge several items and allows an easy ranking of products. This score here includes a total of 10 performance tests to respond to the damage. More tests could be included very easily.
Footnotes
Acknowledgements
The authors would like to thank Vanessa Pasquet and Sandrine Pesnel for providing the surveyed data.
Declaration of conflicting interests
The author(s) declared no potential conflicts of interest with respect to the research, authorship, and/or publication of this article.
Funding
The author(s) disclosed receipt of the following financial support for the research, authorship, and/or publication of this article: This research was supported by the Hauts de France Region, and by ECO TLC.