
Abstract
The elevated temperature resistance and even fire resistance of carbon fiber-reinforced polymer composites were critical concerns in many applications. These properties of a carbon fiber-reinforced polymer depend not only on the degradation of the polymer matrix but also on that of the carbon fibers under elevated temperatures. In this study, influences of elevated temperatures (by 700°C for 30 min) in air on the mechanical properties and microstructures of a carbon fiber were investigated experimentally. It was found that the tensile strength and modulus as well as the diameters of the carbon fibers were reduced remarkably when the treatment temperatures exceeded 500°C. At the same time, the content of the structurally ordered carbonaceous components on the surface of carbon fibers and the graphite microcrystal size were reduced, while the graphite interlayer spacing (d002) was enhanced. The deteriorated tensile modulus was attributed to the reduced graphite microcrystal size and the reduced thickness of the skin layer of the carbon fiber, while the degraded tensile strength was mainly attributed to the weakened cross-linking between the graphite planes.
Introduction
Carbon fiber–reinforced polymer (CFRP) composites are widely used in modern industries, such as aerospace, automobiles, and the rehabilitation of civil structures. In many applications, the fire resistance of the CFRPs is a critical concern.1,2 The poor fire resistance of the CFRP mainly comes from the low temperature and flame resistances of the polymer matrices. In addition, in some extreme conditions, the degradation of carbon fibers at elevated temperatures, for example, oxidation, also contributed to the deterioration of CFRPs. 3 The high-temperature resistant resin systems and flame retardant4–7 were developed to improve the temperature and fire resistance of CFRPs, for example using the high Tg epoxy resin system (around 225°C). 8 So far, much less works were performed on the elevated temperature resistance of the carbon fibers. For unidirectional fiber-reinforced polymers (FRPs), the fibers contribute to most of the external forces even in fire. 9
By now, a large number of research were performed on the mechanical properties of carbon fibers at extreme high temperatures (e.g. >1500°C), which were encountered in heat-resistant carbon–carbon composites.10,11 However, few investigations were reported on the evolution of the mechanical and structural properties of carbon fibers at the temperatures for most of the fires (typically 400°C–1100°C).12,13
Oxidation of carbon fiber at elevated temperatures in air leads to mass loss and decrease in tensile properties. 14 Feih and Mouritz 3 found that the mass loss of carbon fibers was significant at the temperature range of 500°C–950°C in air. The fiber diameter was also reduced uniformly due to the surface oxidation. When the exposure temperatures increased from the room temperature to 350°C–400°C, the smooth surface of the control fibers changed to shallow grooves along the fiber axis. As the temperatures increased from 400°C to 700°C, the tensile modulus of the carbon fiber decreased by about 20%, while the tensile strength was reduced by nearly 40%. According to the relationship between Young’s modulus and the mass loss, the skin–core model for the carbon fiber was adopted, and the outer layer thickness Touter was estimated to be around 0.65 μm. The strength degradation at elevated temperatures was described as a function of the exposure temperatures alone, which was similar to the strength reduction model for the composite materials.9,15
With respect to the oxidation behavior of the carbon fibers, Yin et al. 16 conducted an experiment in a muffle in air from 550°C to 860°C. A linear relationship between the carbon fiber diameter and the exposure time was obtained. According to the Arrhenius equation, the activation energy for burn off of the carbon fiber was 140 ± 5 kJ/mol, and the oxidation reaction mechanism changed around 600°C. Based on thermogravimetric analysis (TGA) results, some white-colored residue found after full oxidation had affected the reaction rate once the oxidation reached the central part of the fiber, which suggested that the crystal structure or compositions of the fiber cores were found to be different from the rest of the fibers.
It was well known that the oxidation process of the precursor fibers is a key process for the production of carbon fibers. During oxidation, the polyacrylonitrile (PAN)-based carbon fibers experience a series of complex physical and chemical procedures,7,17 such as formation of an intermolecular network connected by oxygen and cyclized structures and polymerization of nitrile side groups to naphthyridine ring. Meanwhile, the well-known skin–core structure of a carbon fiber is realized during this process. More compact and ordered ladder structures are formed in the skin region by intramolecular cyclization and intermolecular cross-linking with the sufficient oxidation. The resulting compact surface structures hinder the oxygen spreading to the core region, leading to a poor cyclization in the core layer. Liu et al. 18 quantitatively analyzed the skin–core difference from PAN precursors to carbon fibers by the nanoscale dynamic mechanical imaging technique and found that the primary skin–core structure in the fibers forms at 265°C. The skin layer and core layer regions of carbon fibers exhibit a clear difference in the mechanical properties, for example about 18% difference in the modulus.
When CFRP composite suffers from an actual fire, the carbon fibers on the surfaces of the CFRP, close to the fire, are considered to be exposed to an oxygen-rich environment. 3 The heat generated from a fire will transfer to the CFRP surface far away the fire in the way of radiation or convection, 19 and so the inner carbon fibers will experience different levels of heat exposure (exposure temperatures). The duration of the actual fire also determines the fire-resistant time of the carbon fibers (exposure time). To model the actual exposure to a fire for carbon fibers, the study of the elevated temperature properties of carbon fiber is essential. Furthermore, to understand the effect of oxidation on the structural and mechanical properties of carbon fiber is imperative.
This study focused on the effect of elevated temperatures on the mechanical and structural properties of the carbon fibers in air. The mass loss, surface morphology, inner crystallite structure, and mechanical properties of carbon fibers were to be tested. By relating the macroscopic mechanical performance and microscopic structural properties, the degradation mechanism of the carbon fibers was revealed.
Experimental
Materials
The PAN-based carbon fibers were bought from the Plastics Group (TC36S, Taiwan, China) with the tensile strength, modulus, and break strain of 4.7 GPa, 240 GPa, and 1.90%, respectively.
Elevated temperature treatment
Carbon fibers about 10 cm long were exposed to 400°C–700°C for 30 min in a muffle furnace under the oxygen-rich environment. By contrast, the control fibers were exposed to the air at room temperature.
Tensile tests
The tensile test of single carbon fiber was conducted using a JQ03A single fiber tensile tester (Zhongchen Digital Technic Apparatus Co., Ltd., Shanghai, China) equipped with a load cell of 1 N. The testing was performed according to ASTM D 3379-75. For each kind of carbon fibers, about 50 specimens were repeated. During test, single carbon fibers were carefully taken out from the yarn and attached to a gauge paper case with 20 mm distance.20,21 The crosshead displacement rate was set as 0.00125 mm/min. All tests were conducted under the laboratory environment at room temperature. It should be noted that the diameters of a single fiber before and after heating were measured with a scanning electron microscope (SEM) for 10 samples. According to the area equivalent principle, the average diameters of the fibers were obtained on the basis of the circular areas to calculate the tensile modulus and tensile strength.
Weibull’s model was adopted for calculation of the statistical distribution of the failure strengths 22

where P(σ) is the cumulative failure probability, a function of applied stress σ, m is the shape parameter (also, Weibull modulus), reflecting the distribution of flaws existing in a carbon fiber, σ0 is the Weibull scale parameter, L is the fiber length for test, and L0 is a reference length. When L = L0, Weibull parameters can be extracted from the empirical strength distribution using the following conventional Weibull linear regression estimator

The probability of failure P(σ) at the ith ranked specimen from a total of N specimens is obtained from the mean rank method as

Surface morphology
The surface morphology of the carbon fibers before and after heat treatment was analyzed by SEM (SEM, Quanta-200F, FEI, Hillsboro, OR, USA) and atomic force microscope (AFM; Bruker Corporation, Germany).
Raman spectroscopy
The Raman spectra of carbon fiber surface were measured for a monofilament mounted on microscope slides and positioned on the translational experimental stage using a Renishaw via-Reflex Confocal Raman spectroscope of England. The fiber was aligned with its axis parallel to the polarization direction of the incident beam. A linear polarized diode-pumped crystal laser has a nominal wavelength of 633 nm. The laser power on the specimen was about 1 mW in order to get rid of irreversible thermal damage. The laser spot on the sample was about 1 μm. The spectral resolution power was 4 cm−1. The laser exposure time was 10 s. It should be noted that the penetrating depth of the laser beam was estimated to be about 50 nm, which accounts for less than 1% of the fiber diameter. Raman spectra of the fiber cross-section were obtained by grinding and polishing in the plane normal to the fiber axis, which was embedded in a thermosetting matrix. The Lorentzian function was used for fitting the Raman curve adopting a nonlinear least-squares routine.
Wide-angle X-ray diffraction
The wide-angle X-ray diffraction (WAXD) was performed using a synchrotron X-ray beam wavelength of 0.0674 nm at a beam line BL15U1 (Synchrotron Radiation Facility, Shanghai, China). WAXD patterns were acquired with a flat camera using Cu Kα radiation at 200 mA and 40 kV. The X-ray beam of 5 μm width was incident to the single fiber. The 002-reflection was used to obtain the crystallite interlayer spacing (d002 = λ/2sinθ, with 2θ being the scattering angle and λ being X-ray beam wavelength) according to the method described by the Bragg and Scherrer equations. The degree of orientation of graphite crystallites was calculated by estimating the half-width (H) of the 002 reflection profile as: Z = (180° − H)/180° × 100%.23,24
Small angle X-ray scattering
The small angle X-ray scattering (SAXS) of carbon fibers was determined using the D/max rB (Rigaku, Japan). The sample is prepared by grinding the carbon fibers into full powder. The measurement used Cu target with a voltage of 40 kV and a current of 40 mA. The scanning field is within 0.01°–1.5° with the step of 0.01°. The counting time is set as 10 s.
Results and discussion
Tensile properties
Figure 1 presents the influences of exposure temperatures on the tensile strength and modulus of single carbon fibers. As shown in Figure 1, below 500°C, the tensile strength varied slightly with the temperatures. However, as the exposure temperature exceeds 500°C, both the tensile strength and modulus started to decrease obviously. By 700°C, the carbon fibers were completely oxidized into white-colored residues. Both the strength and modulus cannot be measured at all. Similar dependence of the tensile properties on the exposure temperatures was reported. 16

Effects of elevated temperature treatment on the tensile properties of single carbon fibers.
Figure 2 shows the effect of the elevated temperature treatment on the average diameters of the carbon fibers. The average diameters before and after heat treatment were tested by the fiber transverse section based on the area equivalence principle. As shown in Figure 2, the fiber diameters were dramatically reduced as the exposure temperatures exceeded 500°C. The trend is similar to the variation in the tensile properties with the exposure temperatures (Figure 1). Note, the tensile properties of the carbon fiber shown in Figure 1 were calibrated with the measured carbon fiber diameters. It should be noted that oxidation etched the carbon fiber from skin to core, and the degradation of the calibrated tensile properties is attributed to the thinning and even removal of carbon fiber skin layer, which will be discussed subsequently.
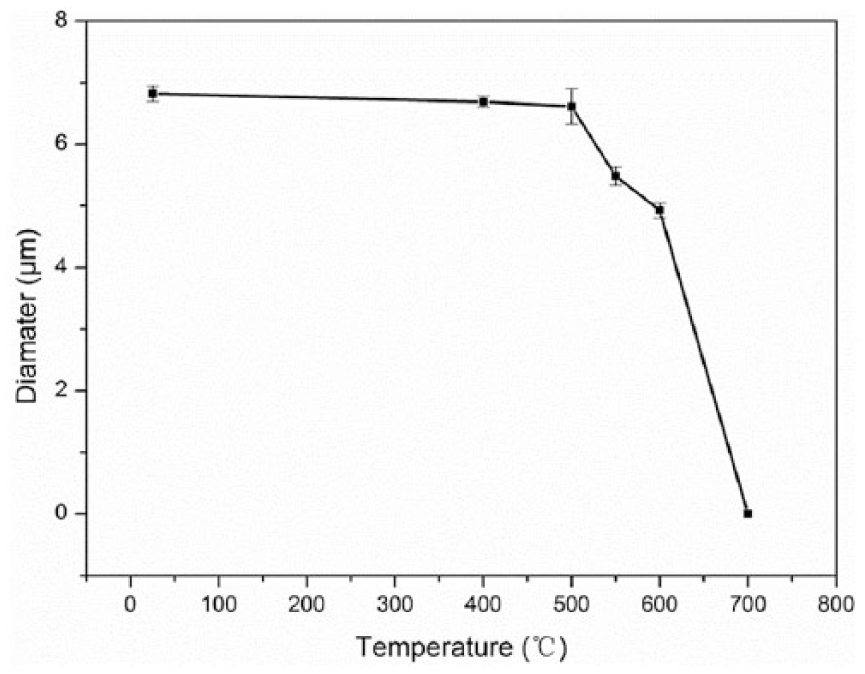
Variation in the average diameters of the carbon fiber as a function of exposure temperatures, measured with SEM observation.
Surface topography
Due to the sizing treatment, the surface topography of the control carbon fibers is smooth (Figure 3(a)). Upon elevated temperature treatment at lower temperatures, for example by 400°C, the surface became rougher, and the grooves are clearly presented (Figure 3(b)). This contributed to the decomposition of sizing agents. 20 Further increase in the elevated temperatures (i.e. 600°C) brings in remarkable changes in the topography of the carbon fibers (Figure 3(c)). Due to oxidation of carbon elements, the surfaces become much rougher, and some defects (e.g. cracks) were formed as shown in Figure 3(c). In addition, for the 600°C-treated ones, the groove features of carbon fibers are completely removed. It should be noted that only some white-colored residues were left for the 700°C-treated carbon fibers, which means the fibers were totally oxidized into carbon dioxide.
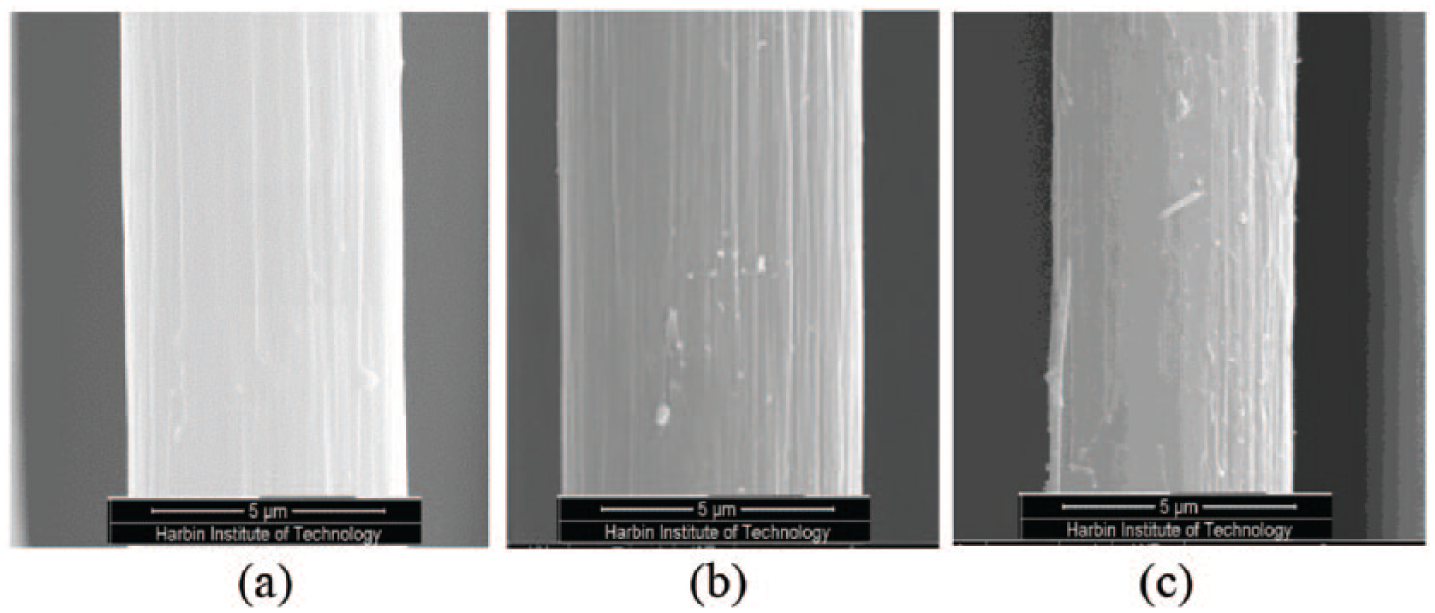
SEM pictures of carbon fibers: (a) original, (b) aged at 400°C for 30 min, and (c) aged at 600°C for 30 min.
Variation in the carbon fiber structures
Skin–core structures
As indicated in the study by Lourie and Wagner, 25 Raman spectra of a carbon fiber have two characteristic bands of “D-band” and “G-band,” located at 1350 cm−1 and 1580 cm−1, respectively. The “G-band” is related to the vibration of the graphite structure (C–C bond), and the “D-band” represents the vibration of low orientation and crystalline defect structures. The intensity ratio of the “D-band” to the “G-band” (ID/IG, known as R-value) indicates the relative ratio of structurally ordered graphite crystallites in carbonaceous materials. 26 Besides, a shoulder band at the wavenumber of 1500 cm−1 is known as the “A-band,” and IA/IG is believed to be related to the ratio of amorphous carbonaceous structures on the surfaces of carbon fibers. 27 A typical Raman spectrum of the present carbon fiber is given in Figure 4.
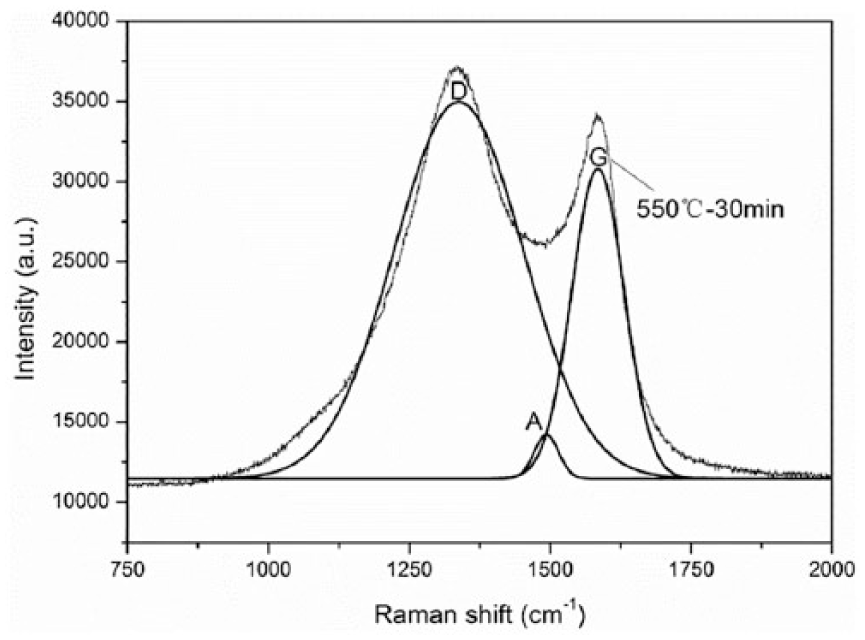
First-order Raman spectrum of a carbon fiber (treated at 550°C for 30 min).
Table 1 presents the wavenumbers of “D,” “G,” and “A” bands, and the calculated surface R-values (ID/IG, denoting Rs), IA/IG, and Rsc (defined below). As mentioned earlier, Rs is related to the relative amount of ordered graphite crystalline on the carbon fiber surface. As shown in Table 1, Rs increases with the treatment temperatures from 400°C to 550°C. This indicates that ordering of the graphite crystalline was reduced due to elevated temperature treatment. That is, the elevated temperature treatment brought in more crystalline defects on the carbon fiber surface.
Wavenumbers of “D,” ”G,” and “A” bands and the calculated surface “ID/IG,” “IA/IG,” and “Rsc” by deconvolution of Raman spectra of carbon fibers.

It is worth noting that the Rs for the control sample, ~3.417, is higher than the expected value. Such high value is attributed to the sizing agent on the fiber surface rather than the graphite structures of the carbon fibers. 23 As the temperature increased by 600°C, a drop of Rs is found from 2.992 to 1.921. This may be because that the structure treated at 600°C lied in the core layer of carbon fiber and the “re-oxidation” transformed the structures of the carbon fibers from disordered structures to ordered structures by contacting with the oxygen.
Table 1 also presents the variation in IA/IG ratio as a function of the treatment temperatures. As shown in Table 1, IA/IG ratios decrease with the treatment temperatures. Note, IA/IG ratio reflects the relative amount of the amorphous carbon on the surface of carbon fibers, the higher the ratio, the higher the content of the amorphous carbon. As shown in Table 1, with increase in the treatment temperatures, the amorphous carbon content of carbon fibers reduces. The possible reason is that the amorphous carbon oxidized at elevated temperatures (>400°C).
Carbon fiber is considered to be composed of the skin–core structures. 28 In the skin layer, the graphite structures are more ordered, while more disordered structures are formed in the core section. The skin–core factor Rsc = Rs/Rc (Rs is the ID/IG of the skin layer, and Rc is the ID/IG of the core section, not included in Table 1) of the carbon fiber reflects the difference in the graphite structures between the skin and core sections of a carbon fiber. The lower the Rsc, the more ordered graphite structure of the skin section is compared to that of the core section. As shown in Table 1, elevated temperature treatment from 400°C to 550°C brought in the increase in Rsc, indicating the increased disordering and defects in the skin layer. Besides, the treatment at 600°C increased the discrepancy of the skin and core sections as indicated by the reduced Rsc. This is because the “re-oxidation” at 600°C tends to occur in the “skin layer.” Thus, more ordered structures formed in the “skin layer” subsequently.
Microcrystalline structure
Microcrystal structures, including the graphite interlayer spacing (d002), the graphite microcrystalline width parameter (La), and microcrystalline thickness parameter (Lc), of carbon fibers due to elevated temperature treatment are characterized by WAXD and presented in Table 2.
Microcrystalline structure parameters of carbon fibers detected by WAXD.

WAXD: wide-angle X-ray diffraction.
The d002 of the carbon fibers treated at elevated temperatures, as a function of the square of the carbon fiber diameter, are presented in Figure 5.
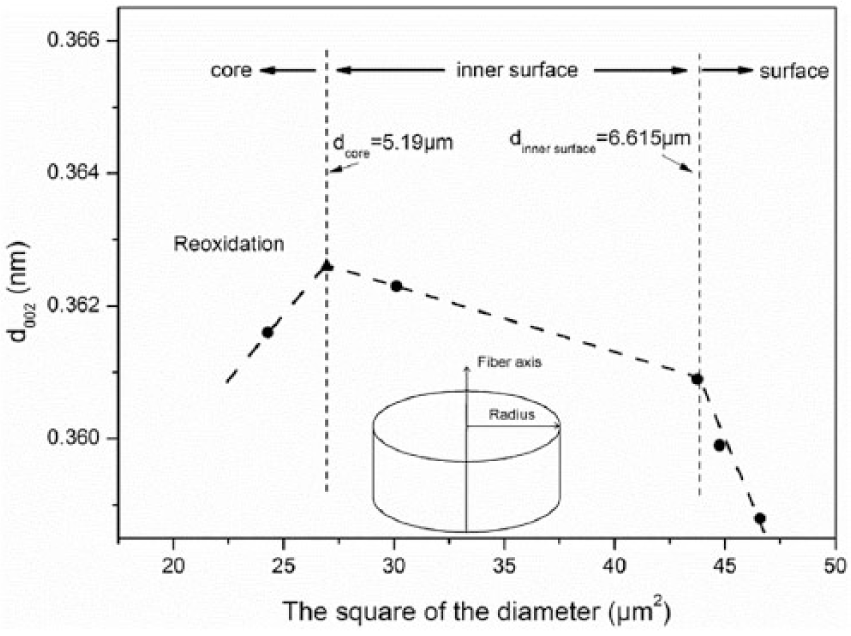
Graphite interlayer spacing d002 radial distribution of carbon fibers aged at elevated temperatures.
The variation in d002 shown in Figure 5 presents three stages according to the square of the carbon fiber diameters or the treatment temperatures. Based on the variation in d002, the structure of a carbon fiber can be divided into three layers: surface layer (treated by 25 to 400°C), inner surface layer (treated by 550°C), and core layer (treated by 600°C). The classification is based on the outer layer thickness Touter (~0.82 μm), derived in the next model work.
In the first stage, the slope of d002 as the function of the square carbon fiber diameter is relatively steep. The related structure belongs to the surface layer of the carbon fibers. In the second stage, the related structure is known as the inner surface layer, and d002 increased with the treatment temperatures. It is worth noting that d002 of the boundary layer was estimated based on Figure 5. The increase in d002 is found in the first two stages. The carbon fibers have the turbostratic graphite structures between the carbon planes generated by the condensation aromatization, and the turbostratic graphite structure will rearrange in a certain disordered way at elevated temperatures. This led to the increase in d002. Similar results were reported in the study by Sauder et al. 29 In the third stage (600°C for 30 min), d002 in turn decreases owing to the obvious “re-oxidation” (d600°C-30 min = 4.927 μm≈dcore = 5.19 μm, dcore is the diameter of the core layer and is derived in the next model work). The three stages revealed visually the effect of elevated temperatures on the d002 radial distribution.
Table 2 also shows the graphite microcrystalline width parameter La and thickness parameter Lc decreased seriously with the treatment temperatures, especially for the sample treated at 550°C. Furthermore, the graphite microcrystalline size (La × Lc) will also decrease with the treatment temperatures.
Rs obtained from the Raman spectra reflects the ordering of crystallite structures of the skin of the carbon fiber, and La acquired from WAXD represents the graphite crystallite plane width along the fiber axis direction. The increase in the graphite crystallite width (La) may lead to more ordered crystallite structure (1/R increases). As shown in Tables 1 and 2, 1/R and La are correlated well.
From WAXD, the preferred orientation angle (φ) and orientation degree (Z) of the graphite crystallite structures of the carbon fibers were obtained. Both of them remained almost constant with the treatment temperatures (Z = ~80%, φ≈18°). Besides, the preferred orientation angle φ will be used to calculate the shear property (shear modulus GXY and shear stress τXY) between the graphite planes (see section “Correlation between the structures and the tensile properties”).
Microporous
The internal microporous parameters of the carbon fibers determined by SAXS are shown in Table 3 (including the sample of the control, treated by 500°C and by 550°C). As shown in Table 3, increase in the treatment temperatures causes the increase in the rotation radius Rg until the maximum value (3.159 nm) was reached for the carbon fibers treated at 550°C for 30 min. At the same time, the fractal dimension (D) also presents the similar trend.
The microporous structure parameters of carbon fibers.

The calculated inside micropore size (R0 = 5Rg2/3) of the carbon fibers is given in Table 3. As shown in Table 3, R0 increases with the treatment temperatures.
On the contrary, the enlarging D increases the micropore surface roughness, 30 which may bring in serious stress concentration when the fiber was subjected to stretch and detrimental to the strength. The sizable and more nanoscale micropores inside the carbon fiber are one of the main factors affecting the tensile strength. 31 According to the Griffith microcrack theory, the degradation of the tensile strength of carbon fibers was remarkable due to the elevated temperature treatment, taking the samples treated by 500°C and 550°C for example (Figure 1).
Correlation between the structures and the tensile properties
Tensile modulus
Figure 6 shows the correlation of the Rs with the tensile modulus of carbon fibers, which were treated at elevated temperatures for half hour (not including the control). As shown in Figure 6, the tensile modulus decreased with the increase in the Rs, except for the samples treated at 600°C. For the former case, the reason for the decrease in the modulus is that elevated temperatures (400°C–550°C) turn the ordered graphite crystallite structures into disordered structures and more crystalline defects appear. For the latter case, the decrease in Rs resulted from the “re-oxidation,” as mentioned earlier. The generated ordered structures from the “re-oxidation” may be oxidized again when the oxygen is excessive, leading to the decrease in tensile modulus.

The correlation between Rs (ID/IG) and the tensile modulus of carbon fibers aged at elevated temperatures (400°C, 500°C, 550°C, and 600°C) for 30 min.
The correlation of the tensile modulus with the graphite crystallite size La × Lc is shown in Figure 7. As shown in Figure 7, the tensile modulus increased with the crystalline size almost linearly.
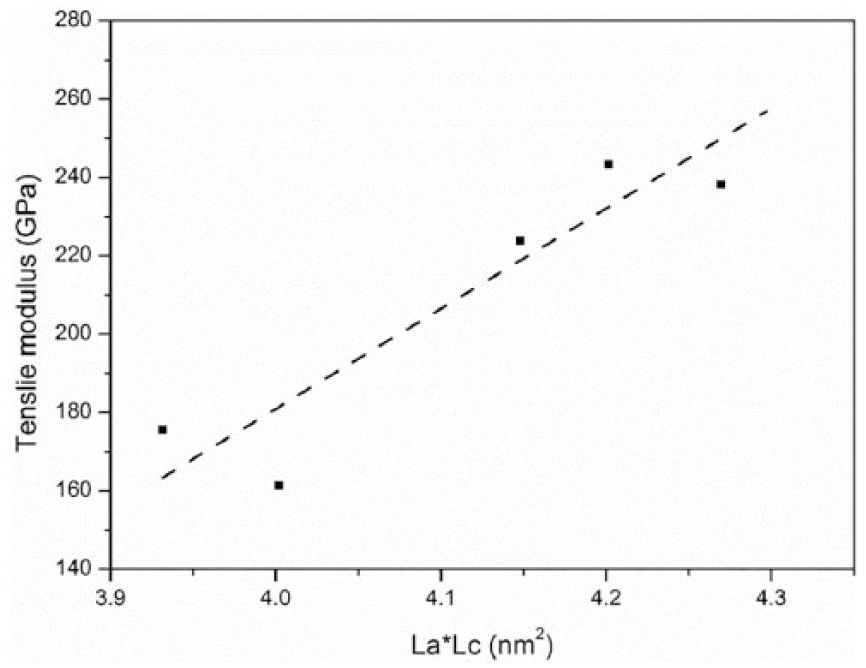
The correlation between the graphite crystallite size (La × Lc) and the tensile modulus of carbon fibers treated at elevated temperatures (25°C, 400°C, 500°C, 550°C, and 600°C) for 30 min.
In conclusion, the degradation of tensile modulus is attributed to the reduced ordering (Rs) and size (La × Lc) of the graphite crystallite at elevated temperatures (~600°C). The graphite crystalline structure and the secondary structural elements of a carbon fiber are not completely parallel to the tensile stress. Figure 8 shows the real stress state normal and parallel to the graphitic planes at angle Ø with respect to the loading direction. Because of the existence of the orientation angle Ø, the tensile properties of a carbon fiber depend on the shear properties (shear modulus GXY and shear stress τXY) between graphite planes.

Schematic diagram including the graphitic planes at angle φ with respect to the loading direction and the stress state normal and parallel to the graphitic planes.
Sauder and Lamon 32 proposed a model correlating the tensile modulus with the orientation angle according to the theory of elasticity for anisotropic solids as follows
Northolt et al. 33 neglected <sin 4 Ø> for well-oriented carbon fibers and proposed another model as follows

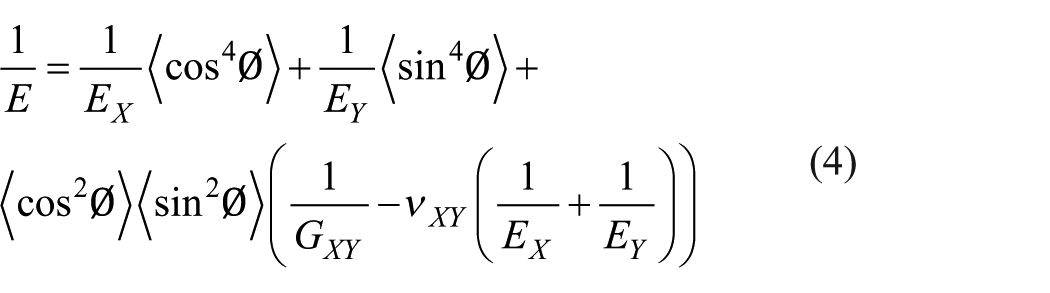
where E is the tensile modulus of a carbon fiber, which was obtained by the tensile test, EX is the Young’s modulus in the direction normal to the c-axis and is reported as 1020 GPa, EY is the Young’s modulus parallel to the axis and is more realistic for 20 GPa, νXY is the Poisson’ ratio and is assigned as 0.25, and GXY is the shear modulus between the graphite planes oriented normal to the c-axis and is calculated by equation (5). The <cos2Ø>, <cos 4 Ø>, <sin 2 Ø>, and <sin 4 Ø> are the second and fourth moments of the orientation distribution of graphitic planes, defined as

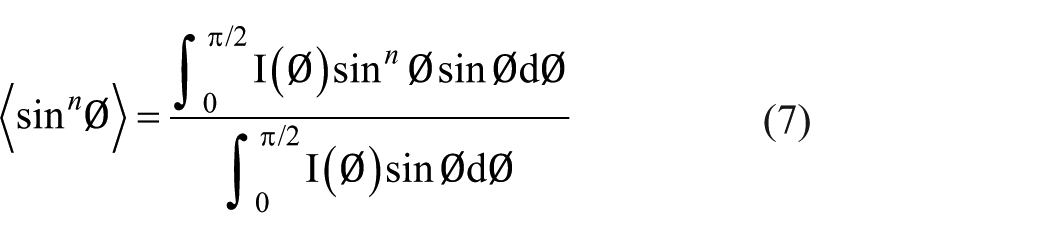
where I(φ) is the distribution of intensity of scattering, which can be determined by WAXD and φ is the preferred orientation angle.
GXY by equation (5) between the graphite planes for the carbon fibers subjected to various elevated temperature treatments are displayed in Table 4. As shown in Table 4, GXY decreases with the increase in the treatment temperatures. At the same time, the linear relationship between GXY and E (Figure 9) indicates that the tensile modulus of a carbon fiber relies on the shear modulus between graphite planes. It is worth noting that GXY will be related to the shear stress τXY between graphite planes (see section “Tensile strength”).
Shear modulus GXY between graphite planes calculated by equation (5).


The relationship of the tensile modulus and the shear modulus between graphite planes of carbon fibers treated at elevated temperatures for 30 min.
When the carbon fibers are exposed to elevated temperatures (>400°C), the C–C bonds are expected to rupture, and the fractured carbon atoms combine with the oxygen atoms into the other functional groups containing oxygen. Finally, the functional groups are fully oxidized to carbon dioxide. The consumption of C–C skeleton leads to a drop in the graphite crystallite size. Furthermore, the tensile modulus E (Figure 7) and the shear modulus (GXY) decrease (Figure 9).
Tensile strength
As known, carbon fibers are composed of both microcrystals and amorphous carbons. The microcracks and micropores are distributed in the crystallites. When a carbon fiber is subjected to external force, the microcracks will propagate inside the carbon fiber. The cracks may be blocked by crystalline and zigzags by bypassing the crystalline in the amorphous zone (intergranular expanding). On the contrary, the cracks may expand along the interface between the crystallites and amorphous carbon (grain boundary expanding). The cross-linking between the graphite planes is the main factor to consume energy and inhibit the microcrack propagation in intergranular space and grain boundary. 34 Furthermore, the cross-linking between graphite planes depends largely on the Van der Waals force and the amorphous carbons. The former is the main intermolecular force between the graphite planes. The latter is to make the boundary atomic microcrystalline and interstitial atomic microcrystalline inside the carbon fibers to form cross-linking.
Figure 10 shows the correlation of the skin–core factor (Rsc) and amorphous carbon content (IA/IG) with the tensile strength. Similarly, Rsc increased with the elevated temperatures until 550°C. The structurally ordered carbonaceous components on the surface of carbon fibers are reduced. Although the whole structure of carbon fiber became relatively homogeneous, the load capacity became worse. On the contrary, the content of amorphous carbonaceous structure decreased until 550°C. This means the cross-linking between graphite planes was weakened. Thus, the tensile strength decreased. Likewise, the abnormal increase in tensile strength related to Rsc and IA/IG at 600°C was attributed to the “re-oxidation” effect, as mentioned earlier.

The correlation of (a) Rsc and (b) IA/IG with the tensile strength of carbon fibers aged at elevated temperatures (400°C, 500°C, 550°C, and 600°C) for 30 min.
The effect of d002 on the tensile strength was manifested by the intermediate variable Van der Waals force between the graphite planes. The increase in d002 at elevated temperatures is expected to bring in a decrease in the Van der Waals force. As the main force between the graphite planes, the reduction weakened the cross-linking between the graphite planes. Due to this, the tensile strength declined with d002 steadily, as shown in Figure 11.
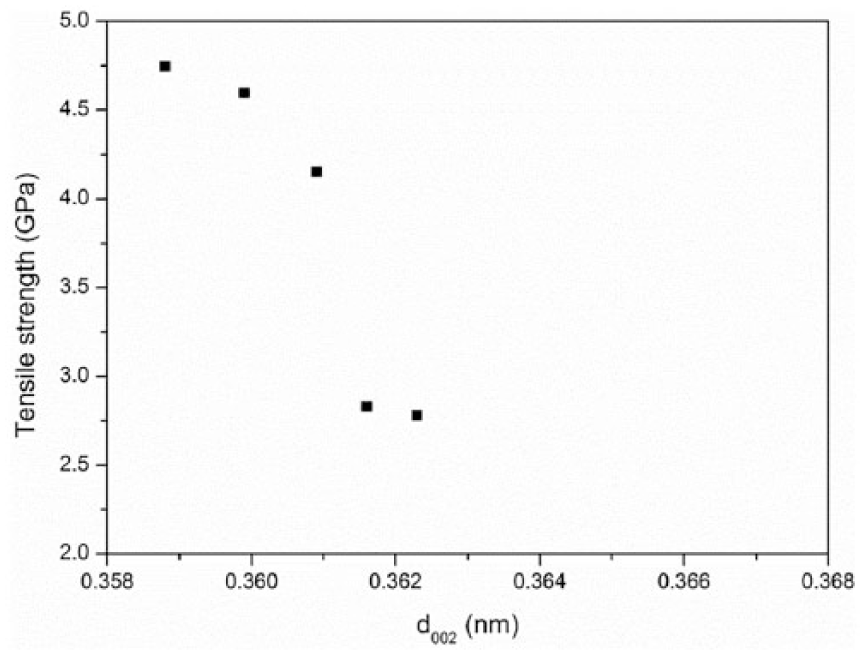
The relationship between the interlayer spacing d002 and the tensile strength of carbon fibers aged at elevated temperatures (25°C, 400°C, 500°C, 550°C, and 600°C) for 30 min.
According to the equations of the elasticity theory for anisotropic solids, the relationship between shear stress τXY and tensile strength σ is presented in equation (8) 32

τXY calculated with equation (8) are displayed in Table 5.
Shear stress τXY between graphite planes calculated by equation (8).

The relationship of shear stress τXY and the shear modulus GXY is shown in Figure 12. As shown in Figure 12, τXY was proportional to GXY. This is because the treated temperature T (~600°C) in this study is relatively lower when compared to the temperatures in the production process (T > 1500°C) of the carbon fibers. The shear strain γ = τXY/GXY between the graphite planes is almost constant. So, the tensile properties (E and σ) of a carbon fiber treated at elevated temperatures are related to the shear properties (GXY and τXY) between graphite planes (Figures 9 and 11 and equation (8)).
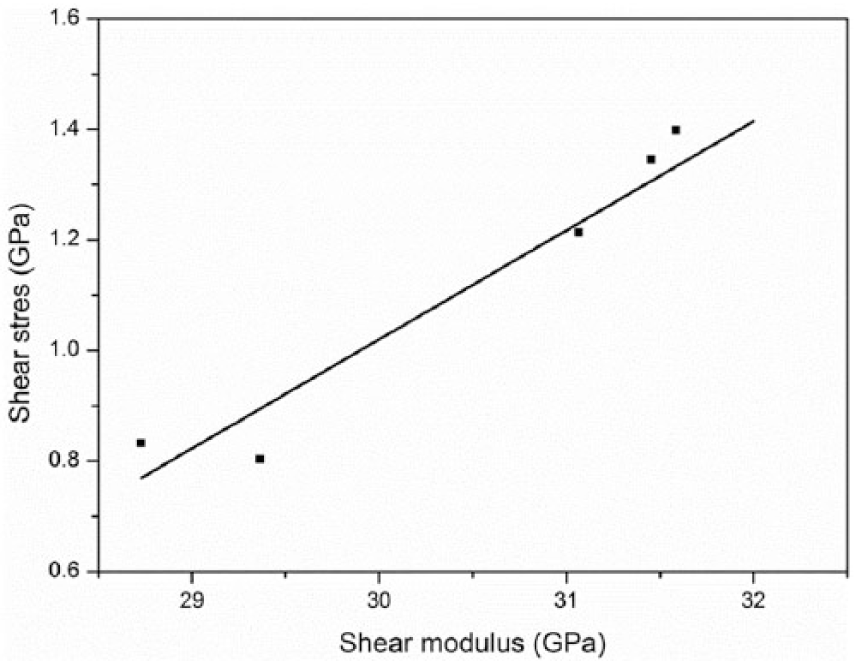
The shear modulus versus the shear stress between the graphite planes.
With the increase in the exposure temperatures, the graphite interlayer spacing (d002) increases, leading to the Van der Waals force decreases. On the contrary, the relative content (IA/IG) of amorphous carbonaceous structure between the graphite planes decreases, which increases the internal pore size (R0) and intensifies the pore surface roughness (D). The increase in d002 and the decrease in amorphous carbonaceous structure (IA/IG) greatly weaken the cross-linking between the graphite planes. With the weakened energy dissipation, the microcracks expand in intergranular space and grain boundary easily. According to the Griffith microcrack theory, when the cracks extend to the critical size, the carbon fibers fractured owing to the insufficient shear capacity (τXY) between the graphite planes. Ultimately, the tensile strength (σ) decreases.
Conclusion
In this study, the effects of the elevated temperature exposure on the mechanical properties and structures of carbon fibers in air were investigated. The following conclusions can be drawn based on the experimental and analysis results. The tensile strength and modulus of the carbon fibers reduced remarkably when the treatment temperature exceeds 500°C. Oxidation at elevated temperatures gradually etched the carbon layer from skin to core of a carbon fiber. The skin–core structure of a carbon fiber by the uniform surface oxidation was reflected by Raman spectra. Treated at 600°C, the disordered core structure was “re-oxidized” and became ordered. At elevated temperatures, the micropore size and surface roughness inside the carbon fiber increased largely. The graphite interlayer spacing d002 of carbon fibers enlarged and the microcrystalline size decreased seriously. The tensile properties of carbon fibers were related to the structural evolution at elevated temperatures. The degradation of the tensile modulus is ascribed to the reduced graphite crystalline size in oxygen-rich environment. However, the insufficient shear properties between the graphite planes brought in fast extension of microcracks in intergranular space and grain boundary easily, leading to the decrease in the tensile strength.
Footnotes
Acknowledgements
The authors would like to thank the State Key Lab for Chemical Fibers Modification and Polymer Materials (Donghua University, Shanghai, China) for assistance in testing.
Declaration of conflicting interests
The author(s) declared no potential conflicts of interest with respect to the research, authorship, and/or publication of this article.
Funding
The author(s) disclosed receipt of the following financial support for the research, authorship, and/or publication of this article: This work was financially supported by the National Key Research and Development Program of China (grant no. 2017YFC0703007) and the NSFC (grant no. 51478145).