
Abstract
As raindrops impact on the canopy, the impact force and canopy vibration will be produced. And the impacting will seriously affect the deceleration characteristics of the parachute system. However, it is very difficult to obtain the impact force and vibration characteristics by the existing experimental methods. In order to solve the above problem, a two-way fluid structure interaction numerical method was used to investigate the process of single droplet impacting on canopy fabric. The Volume of Fluid (VOF) model was used in fluid calculation and the fabric was described by a thin porous domain. The finite element method was used to calculate the fabric dynamic response. The exchange of coupling information was achieved by a weak method. Based on the above method, a typical raindrop (2.12 mm) impacting on 66 type polyamide grid silk was studied in this article. The numerical results agreed well with the experimental results, which verified the feasibility and accuracy of the method used in this article. More importantly, the impact force and vibration characteristics were obtained. Finally, the effects of impact velocity, water permeability, and fabric pretension on impacting process were analyzed. The method and conclusions could provide a reference for aeronautical lifesaving, printing, and dyeing.
Introduction
The phenomena of droplet impacting on fabric widely exist in the fields of aeronautical lifesaving, aerospace recovery, printing, and dyeing. Especially, in adverse weather, the raindrop impacting on canopy will change the system’s dynamic load and even change the aerodynamic shape of canopy. The parachutes’ deceleration effect will be greatly affected. The success rate of parachute dropping was greatly reduced in the emergency such as airdropping relief supplies and pilot ejection escape. However, the above problem has never been considered since the beginning of parachute design. Therefore, it is of great scientific and engineering significance to study the impact of droplet on canopy fabric.
The processes of droplet impacting on non-porous media can be divided into spreading stage, recoiling stage, and oscillating stage. Many scholars have carried out quite a lot of studies. Šikalo et al., 1 Wang et al., 2 Bi et al., 3 and Antonini et al. 4 investigated the effects of droplet velocity, viscosity, surface wettability, and roughness on spreading characteristics. Chen and Wang 5 investigated the processes of droplet impact on cylinder or sphere. Moita and Moreira’s 6 and Bertola’s 7 works considered the effect of heat transfer on impacting behavior, while Blake et al. 8 and Li et al. 9 focused the supercooled droplet’s impacting.
When the impact objects are porous media, the recoiling stage and oscillating stage disappeared in most situations because of porous media’s absorption effect. Therefore, the studies of droplet impacting on porous media were focused on the penetration processes. Meanwhile, most studies are based on numerical research because of the limitations of experimental methods. Alleborn and Raszillier 10 investigated the relationship between absorbing and spreading by solving the evolution equations based on lubrication approximation. Reis used the Marker and Cell (MAC) method to track the position of the liquid region and free surface.11,12 Anderson 13 used one-dimensional imbibition and deformation model to investigate the porous substrate’s deformation problem. Alam et al., 14 Kim and Lee, 15 and Choi et al. 16 used the Volume of Fluid (VOF) model or Level Set Volume of Fluid (LS-VOF) model to investigate the spreading and absorbing behavior of droplets on porous substrates.
Although canopy fabric belongs to the category of porous media, their impacting processes are different from the traditional porous media’s in fact. 17 In addition, the thin canopy fabric will vibrate after impact, which is a typical fluid–structure interaction problem. The above numerical investigations hardly consider this interaction. And the impact force and vibration characteristics could not obtain by the existing experimental method.18,19 Therefore, the two-way fluid–structure interaction method was proposed in this article to simulate the impacting processes under various conditions. Abundant information of flow field and structure field were obtained. More importantly, the results of impact force and vibration characteristics which were difficult to obtain by experiments were obtained.
Mathematical model
Governing equations
The finite volume method based on VOF model was applied in the part of fluid calculation. In this article, air was the primary phase and water was secondary phase. The continuity equation was as follows

where
The volume fraction of air could be obtained by equation (2). Here, the geometric reconstruction algorithm 20 was used to deal with the interface between air and water

where the subscript
The momentum equation is as follows
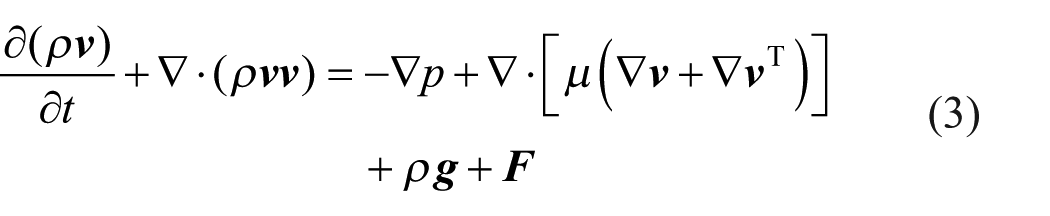
where


In addition, the Reynolds number was small in this article and the thermodynamic problem was not involved. Therefore, the turbulence equation and energy equation were unnecessary. The whole fluid field was calculated based on the PISO (Pressure Implicit Split Operator) algorithm which was wieldy used in computational fluid dynamics (CFD).
The fabric’s response was calculated by a general transient dynamics algorithm. The governing equation is as follows

where
Methodology of fluid–structure interaction
The coupling information exchange was based on two-way coupling method. The dynamic and kinematic conditions were satisfied at the coupling interface

where
In order to satisfy the above conditions, a separate coupling method was used. 22 In each time step, the flow field was calculated first and the coupling force was calculated at interaction surface. Then the coupling force was taken as the mechanical boundary conditions to participate in the structural field calculation. Finally, the displacement results were used for mesh updating in flow field calculation. If the coupling calculation converged, the next time’s calculation would be performed; otherwise, the current time step would be calculated (Figure 1).
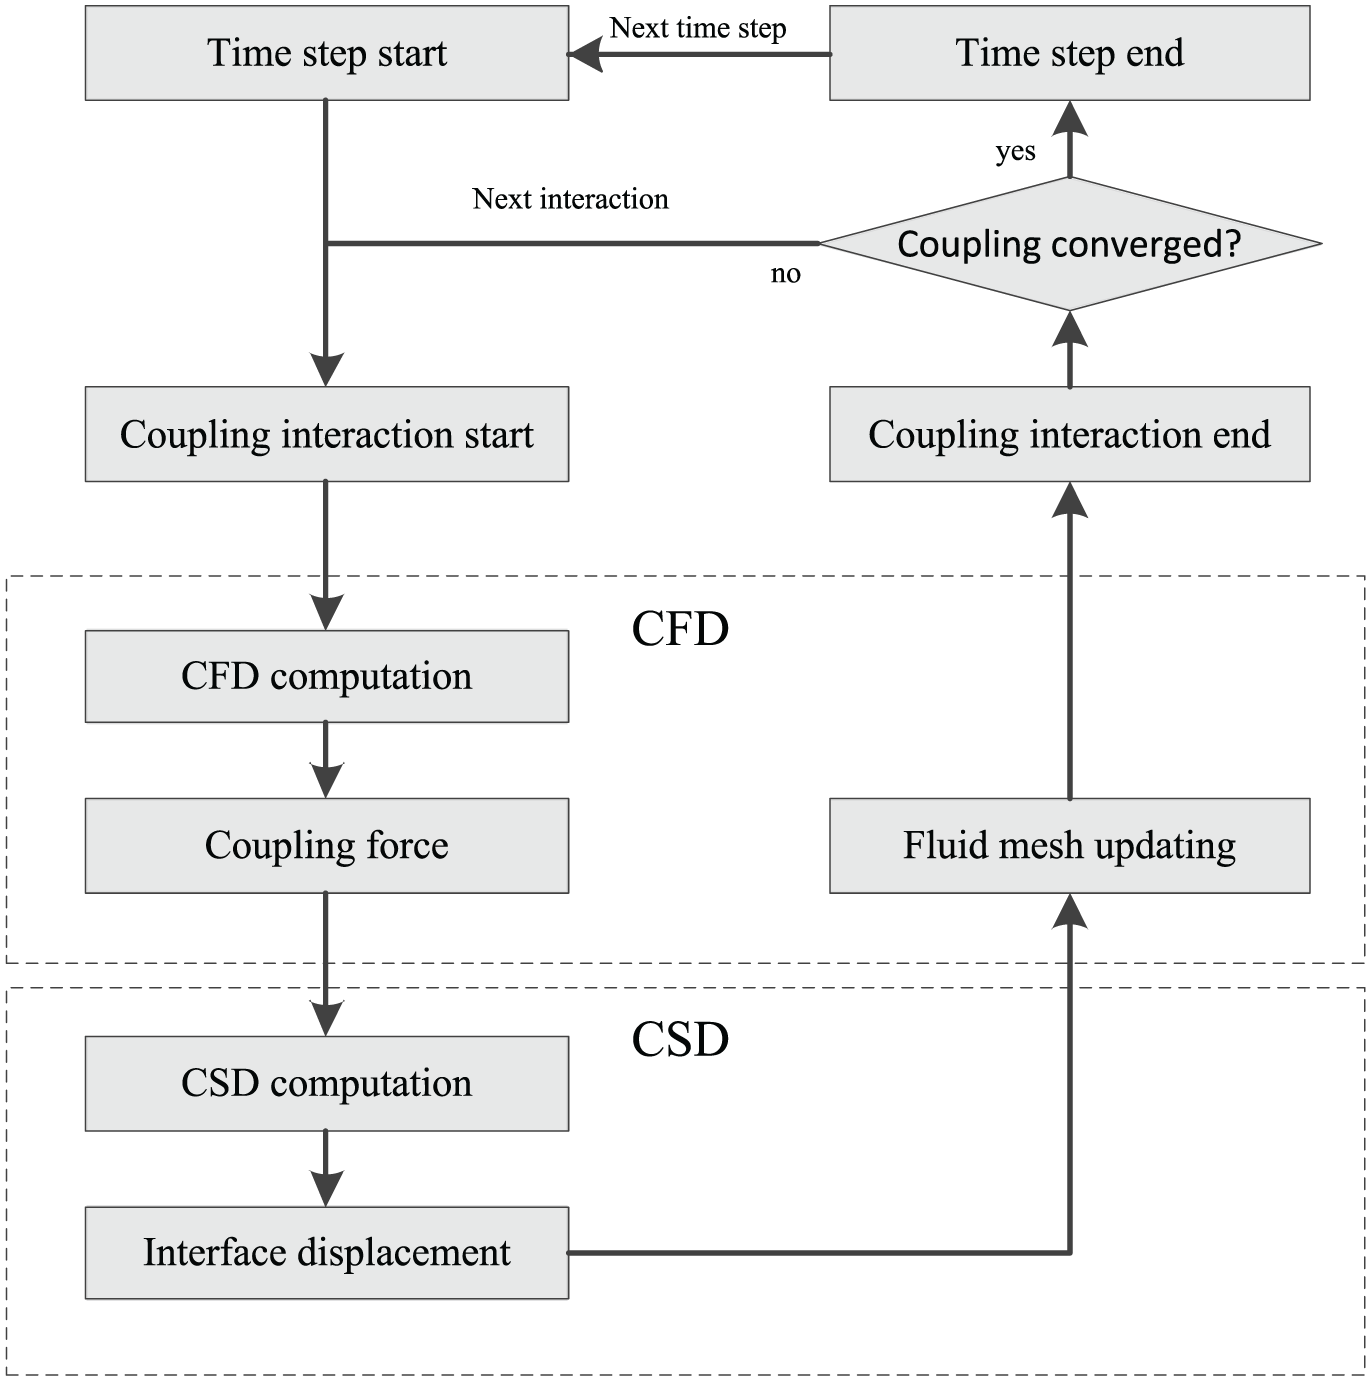
The schematic diagram of two-way fluid structure coupling.
Here, the root mean square (RMS) of the normalized change in data transfer values

And the normalized change in data transfer value
where
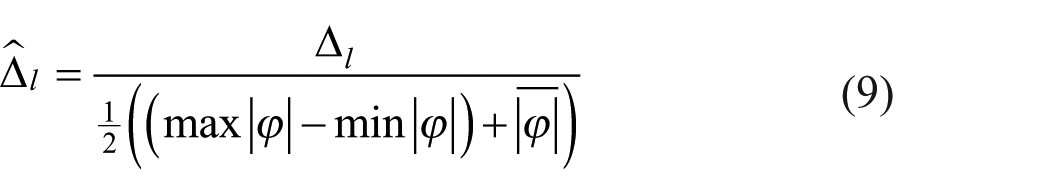
In equation (9), the

where
Case study
Pu et al. found that the number of raindrops with diameter of 1–3 mm was not in the majority of total raindrops, but their contribution to rain intensity and water content was the greatest. In one rainfall, the above two contribution values even reached 69.3% and 72.7%, respectively. 23 Based on the exciting experimental conditions, the typical raindrop with 2.12 mm was taken as the research object in this article. Meanwhile, deionized water was used instead of rainwater.
The untreated and one side silica gel treated 66 type polyamide grid silk were taken as the impact target, both of which were made of nylon 66. The mass addition (0.007 kg/m2) caused by silica gel treatment was almost negligible. Except for permeability, the remaining properties were basically the same. The former was often used for making ordinary parachutes, while the latter was mainly used for ram air parachutes. The material properties involved in experimental and numerical studies can be referred to Table 1.
The material properties.

Experiment setup
The schematic diagram of impacting experiment is shown in Figure 2. The syringe pump driven the flat-tipped needle to form a droplet with diameter of 2.12 mm. The different velocities could be obtained by adjusting the distance between needle and specimen. The fabric specimen was suspended and fixed by four brackets. The different fabric pretension could be obtained by adjusting brackets. There were two dynamometers in two adjacent directions to measure the fabric pretension. The whole droplet impacting process was captured by a high-speed camera (resolution: 512 × 512 dpi, frame number: 3000 fps). The fixation and dimensions of fabric specimen are shown in Figure 3.

The schematic diagram of experimental setup and apparatus.

The fixation and dimensions of fabric specimen.
In order to study the effects of velocity, permeability, and fabric pretension on impacting processes, 18 experiments were carried out in this article. The specific working conditions are shown in Table 2, and the actual experiment is shown in Figure 3.
Summary of models in experiments and calculation.

The suffix T indicates the fabric treated by silica gel on one side and U indicates the untreated fabric.
Calculation model setup
In order to save calculating time, the symmetrical model was used in this article. Here, a porous domain was established according to the actual thickness of fabric specimen. The geometry model and boundary conditions are shown in Figure 4.

Geometry model of flow field.
Then a mesh model was established and 1,614,471 hexahedral elements were used. Both the velocity inlet and pressure outlet were set to zero in this article. Finally, the flow field model was initialized. The two-phase distribution after initialization is shown in Figure 5.

Two-phase distribution after initialization.
The geometry and mesh models of structure are shown in Figure 6 and the fabric was discretized by 13,705 quadrilateral elements.
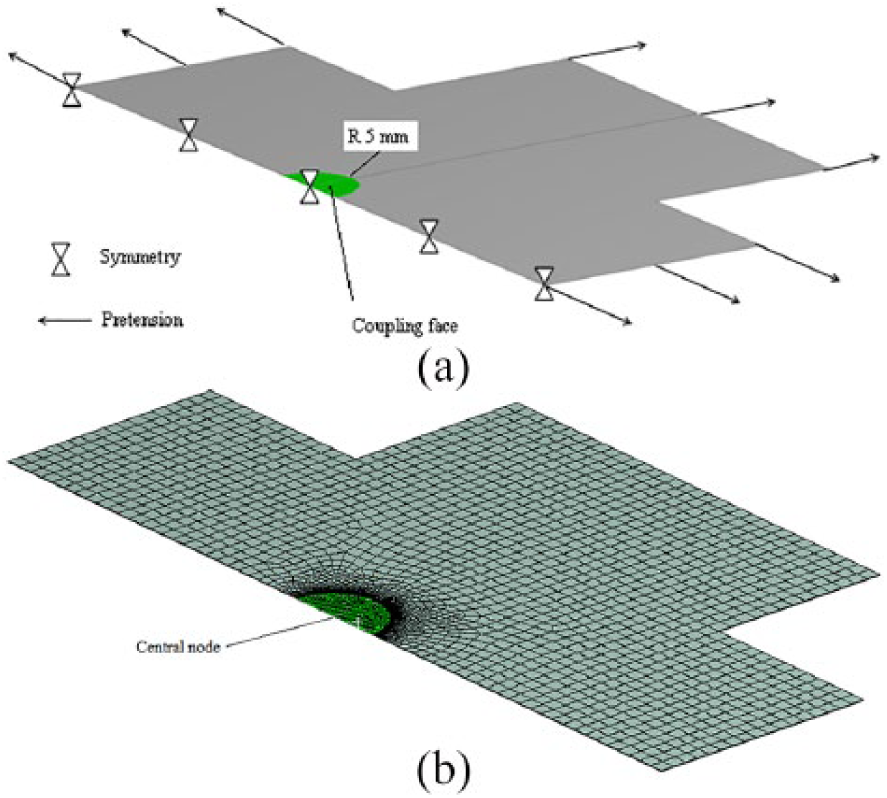
Structure model: (a) geometry model and (b) mesh model.
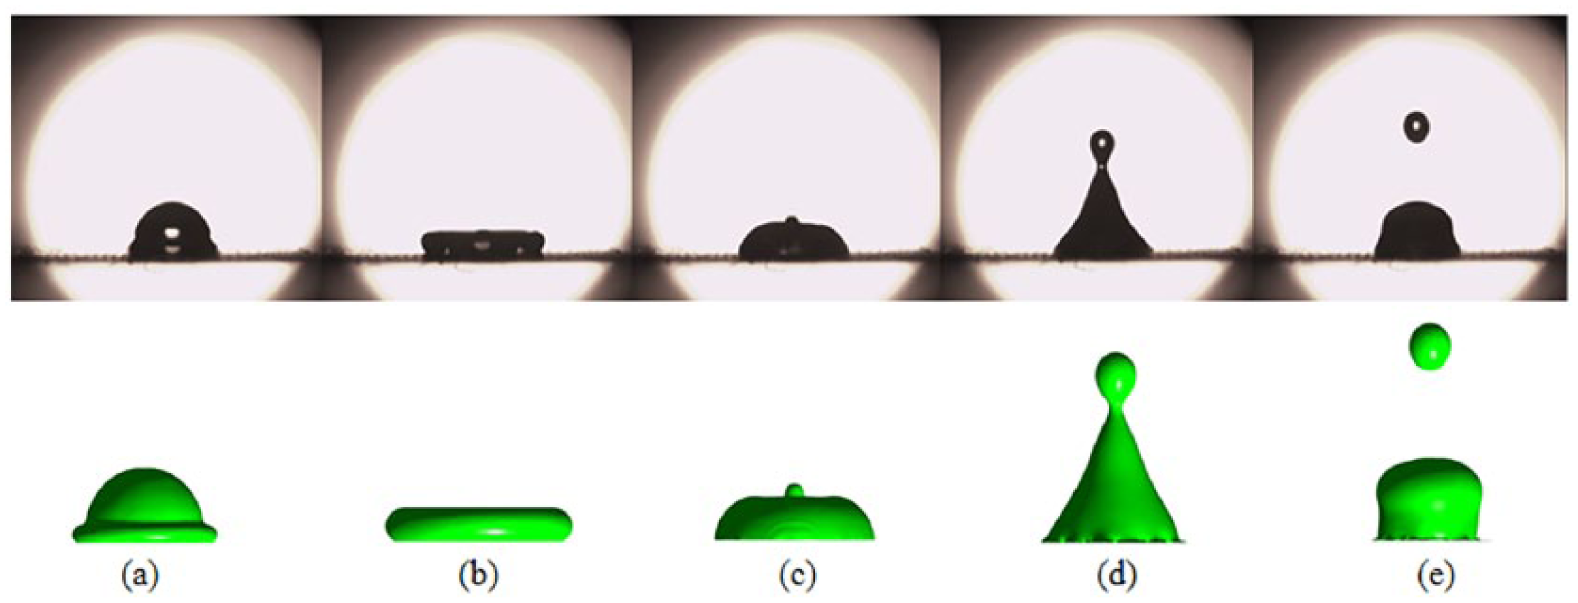
The fluid meshes’ deformation mainly appeared in the normal direction of the fabric. Therefore, the spring smoothing algorithm was used to realize the mesh updating. However, the thickness of porous domain would change and affect the permeability after mesh updating. In order to keep the thickness of porous domain at 0.08 mm, a one-to-many coupling data exchange method was used. Here, both the upper and lower surfaces of porous domain were defined as coupling surface. The upper surface was the primary coupling surface which sent mechanical information and accepted displacement information. The lower surface was secondary coupling surface which only accepted displacement information (Figure 7).

Exchange of coupling information.
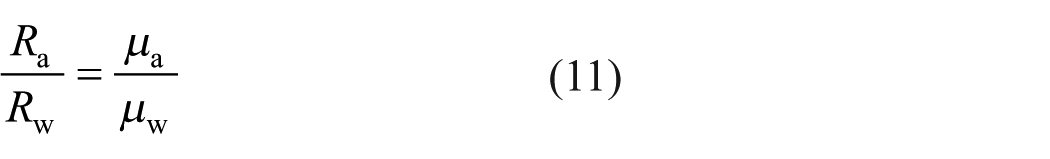
Acquisition of fabric permeability
Fabric water permeability was the key to accuracy of calculation. However, the existing water permeability testing standards were mainly for larger permeability fabric materials such as geotextiles and filtering fabric. On one hand, the flow resistance caused by experimental apparatus was not considered. On the other hand, the pressure difference in testing was large. While the water permeability of test object in this article was small, the pressure difference involved in droplet impacting was also small. Therefore, the existing testing standards and methods could not determine the permeability parameters. The water permeability of specimen was indirectly obtained using Makabe and Takaku’s 24 method.
First, the air permeability of two specimens was measured by YG461 type permeability tester according to the standard. Then the air resistances

Second, the curves were fitted (Figure 8) in polynomial form (

Fitting curves of water permeability.
The permeability coefficient
Summary of permeability coefficient and pressure drop coefficient.

Finally, the additional momentum loss term
Results and discussion
Deformation comparison of droplet
In this article, all models shown in Table 2 were tested and calculated. Here, four typical models were used to explain the effects of fabric permeability, impact velocity, and pretension on droplet deformation.
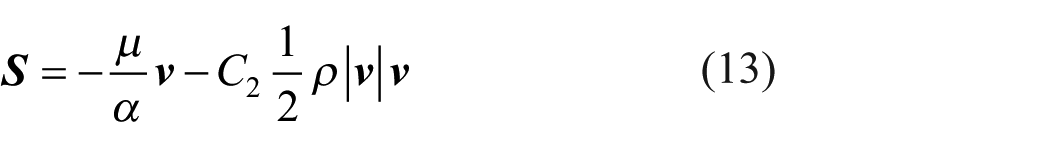
Figure 9 shows Model 11T’s experimental and numerical results. It could be found that the whole impacting process was divided into spreading stage, recoiling stage, and oscillating stage. The numerical results were almost the same with the experimental.
Spreading stage (0–3 ms). The upper part of the droplet remained spherical after the impact, while the lower part began to spread around (Figure 9(a)). The spreading diameter reached the maximum value at about 3 ms (Figure 9(b)). The contact angle was much larger than 90°, which shown strong hydrophobicity.
Recoiling stage (3–10 ms). When the spreading diameter reached the maximum, the droplet began to recoil. The bottom flowing obviously lagged behind the upper part, and the contact angle began to be less than 90° (Figure 9(c)). With the increase of rebound height, the contact angle decreased gradually and the specimen’s strong hydrophilicity began to appear. At 9 ms, the trend of droplet separation was obvious. The droplet presented a conical shape and the motion almost stopped. Finally, the separation occurred at about 10 ms.
Oscillating stage (after 10 ms). The rest part rapidly changed from conical to hemispherical shape by the surface tension after separation. The droplet began to oscillate until equilibrium, while the contact angle also changed around 90°.
Deformation of Model 11T: (a) 1 ms, (b) 3 ms, (c) 5 ms, (d) 9 ms, and (e) 12 ms.
Figure 10 shows Model 11U’s experimental and numerical results. The impacting process was almost the same as that of Model 11T except for the separation. However, with the increase of water permeability, the surface wettability and adsorption were enhanced. The phenomenon of motion hysteresis at droplet bottom was more obvious. In the recoiling state, the contact angle of Model 11U (Figure 10(c) and (d)) was significantly smaller than Model 11T’s (Figure 9(c) and (d)), and the former presented stronger hydrophilicity than the latter. At about 9 ms, Model 11U rebounded to the highest position without separation. Therefore, Model 11U entered into the oscillating stage earlier.

Deformation of Model 11U: (a) 1 ms, (b) 3 ms, (c) 5 ms, (d) 9 ms, and (e) 12 ms.
Figure 11 shows Model 21T’s experimental and numerical results. The impacting process could also be divided into three stages. It could be found that the spreading diameter was larger because impacting velocity increased. However, the duration of spreading was still around 3 ms. When the droplet reached the maximum spreading diameter, the border of droplet presented irregularity because the surface tension was difficult to maintain excessive superficial area. Although Model 21T had large initial kinetic energy, most of them were dissipated in spreading and recoiling. The rebound height was small and the recoiling time was long. At 12 ms, the droplet reached the maximum rebound height and then entered into oscillating stage.

Deformation of Model 21T: (a) 1 ms, (b) 3 ms, (c) 5 ms, (d) 9 ms, and (e) 12 ms.
Figure 12 shows Model 23T’s experimental and numerical results. The impacting process was similar to Model 21T’s, which indicated that the fabric pretension has little effect on droplet morphology change.

Deformation of Model 23T: (a) 1 ms, (b) 3 ms, (c) 5 ms, (d) 9 ms, and (e) 12 ms.
It could be found that the numerical method could accurately simulate the physical phenomenon of droplet impacting on fabric. And the other models’ numerical results were also in good agreement with the experimental results. Both numerical and experimental results shown that the impacting processes of droplet on fabric were different form that of droplet on porous substrates. The processes could be divided into spreading stage, recoiling stage, and oscillating stage, which was similar to the impacting on non-porous media. But the difference was also obvious. The biggest difference was the change of contact angle. In general, the difference between the advancing contact angle (in spreading stage) and receding contact angle (in recoiling stage) was not more than 5°. However, that difference in this article was far more than 5°. All the specimens presented hydrophobicity during droplet spreading (contact angle was larger than 90°) and hydrophilicity during droplet recoiling (contact angle was less than 90°). The treated or untreated specimens would absorb water more or less. The liquid’s motion in porous domain would lag far behind its in air because of the additional momentum loss term
Motion hysteresis effect of Model 21T: (a) in spreading stage and (b) in recoiling stage.
According to the results analysis of all models, it could be found that the order of factors affecting droplet deformation was impacting velocity, water permeability, and fabric pretension. With the increase of initial impact velocity and kinetic energy, the spreading area and viscous dissipation increased, while the kinetic energy for recoiling and rebound height decreased as result. The increase of water permeability could improve the wettability and slightly increase the spreading area, but the effect was not as good as by increasing impact velocity. However, increasing fabric pretension had little effect on droplet deformation.
Spreading factor comparison
The droplet spreading factor

where
Figure 14 shows the comparison of spreading factor. It could be found that the variation trend shown in numerical results were the same as that in experimental results. However, the experimental results had a larger fluctuation compared with the numerical results. Especially, when the impact velocity was large, such fluctuation was particularly obvious (Figure 14(e) and (f)). Because the greater the impact velocity, the more intense the fabric vibration. Then the vibration would cause difficulty in observation and cause larger measurement errors. The structural elements were masked when the numerical results were analyzed. Therefore, the measurement errors of numerical results were small.
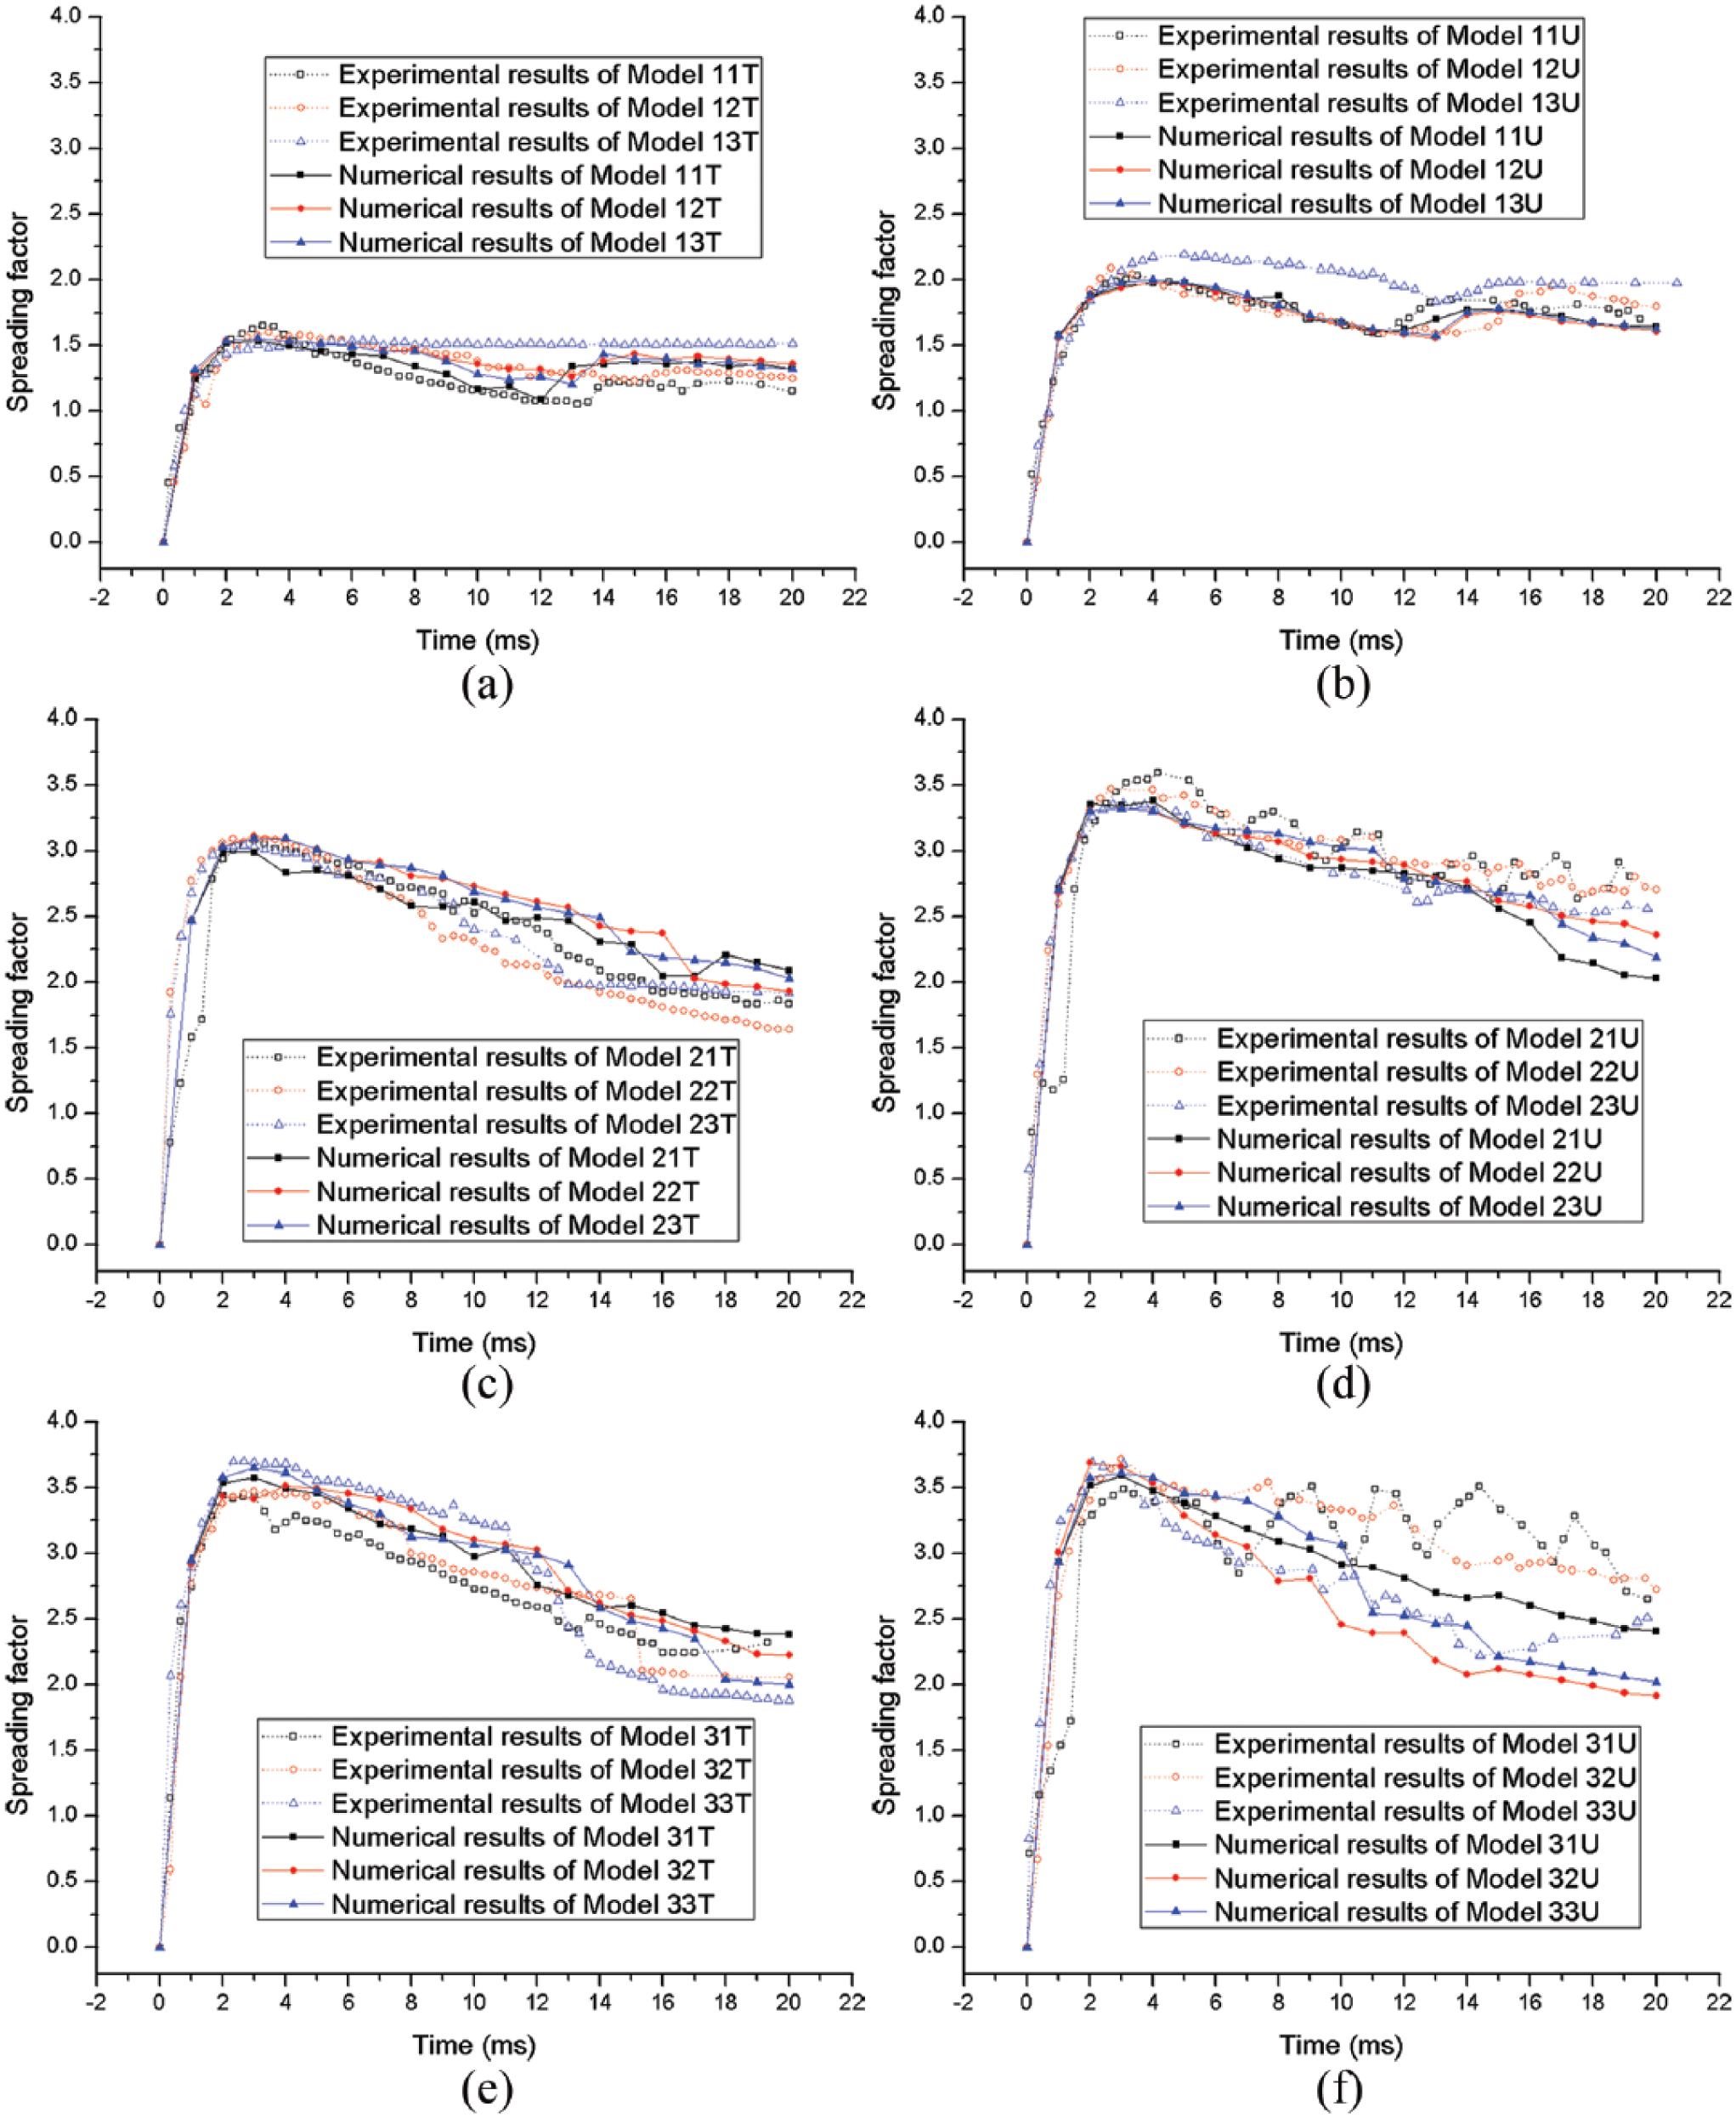
Comparison of spreading factor: (a) 0.77 m/s (treated), (b) 0.77 m/s (untreated), (c) 1.97 m/s (treated), (d) 1.97 m/s (untreated), (e) 1.97 m/s (treated), and (f) 1.97 m/s (untreated).
According to the numerical results, the following conclusions could be obtained. First, it could be found that the impact velocity had the most obvious effect on spreading. When the impact velocity with 0.77 m/s increased by 150% and 214%, the maximum spreading factor of the models treated by silica gel increased by 95% and 122%, while that of the untreated models increased by 63% and 69%, respectively. Second, the effect of water permeability on droplet spreading was limited. The droplet spreading effect of untreated models (Figure 14(b)) was obviously better than that of silica gel treated models (Figure 14(a)) when the impact velocity was 0.77 m/s. But that gap became smaller (Figure 14(c) to (f)) with the increasement of impact velocity. And third, the fabric pretension had little effect on spreading factor. In addition, both the experimental and numerical results shown that the time for droplets to reach the maximum spreading factor was about 3 ms. The above three factors had little effect on this time point.
Analysis of impact force
Figure 15 shows the impact force versus time curves. In order to capture the impact force peak and save data storage space, the output frequency of the first 5 ms was increased in fluid field calculation.

Impact force versus time curves: (a) 0.77 m/s (treated), (b) 0.77 m/s (untreated), (c) 1.97 m/s (treated), (d) 1.97 m/s (untreated), (e) 1.97 m/s (treated), and (f) 1.97 m/s (untreated).
The impact force increased rapidly after impacting, and the force peaks appeared in the early stage of spreading. Then the force curves experienced a short and intense fluctuation and stabilized and decreased gradually. The impact velocity was still the most important factor affecting the impact force. The peak value of impact force increased linearly as the velocity squared (Figure 16(a)), and the time to reach the peak was shorted with the increase of impact velocity (Figure 16(b)). The above change regulations basically satisfied the law of momentum conservation with the ignorance of gravity of droplet:

Impact force peak: (a) comparison of peak value and (b) time comparison of reaching the peak value.
Analysis of fabric vibration
Figure 17 is the magnitude–frequency curves and displacement curves of the central node shown in Figure 6(b). First, it could be found that the larger the fabric pretension was, the higher the natural vibration frequency of the whole system was. The increase of fabric pretension would drive the principal frequency of fabric vibration to move in high-frequency direction. Second, the greater the initial impact velocity, the greater the kinetic energy and the vibration magnitude under the same fabric pretension condition. And third, the difference of liquid mass absorbed by fabric during impact could be ignored, although the models’ permeability was different. Therefore, the effect of water permeability on fabric vibration could be ignored.
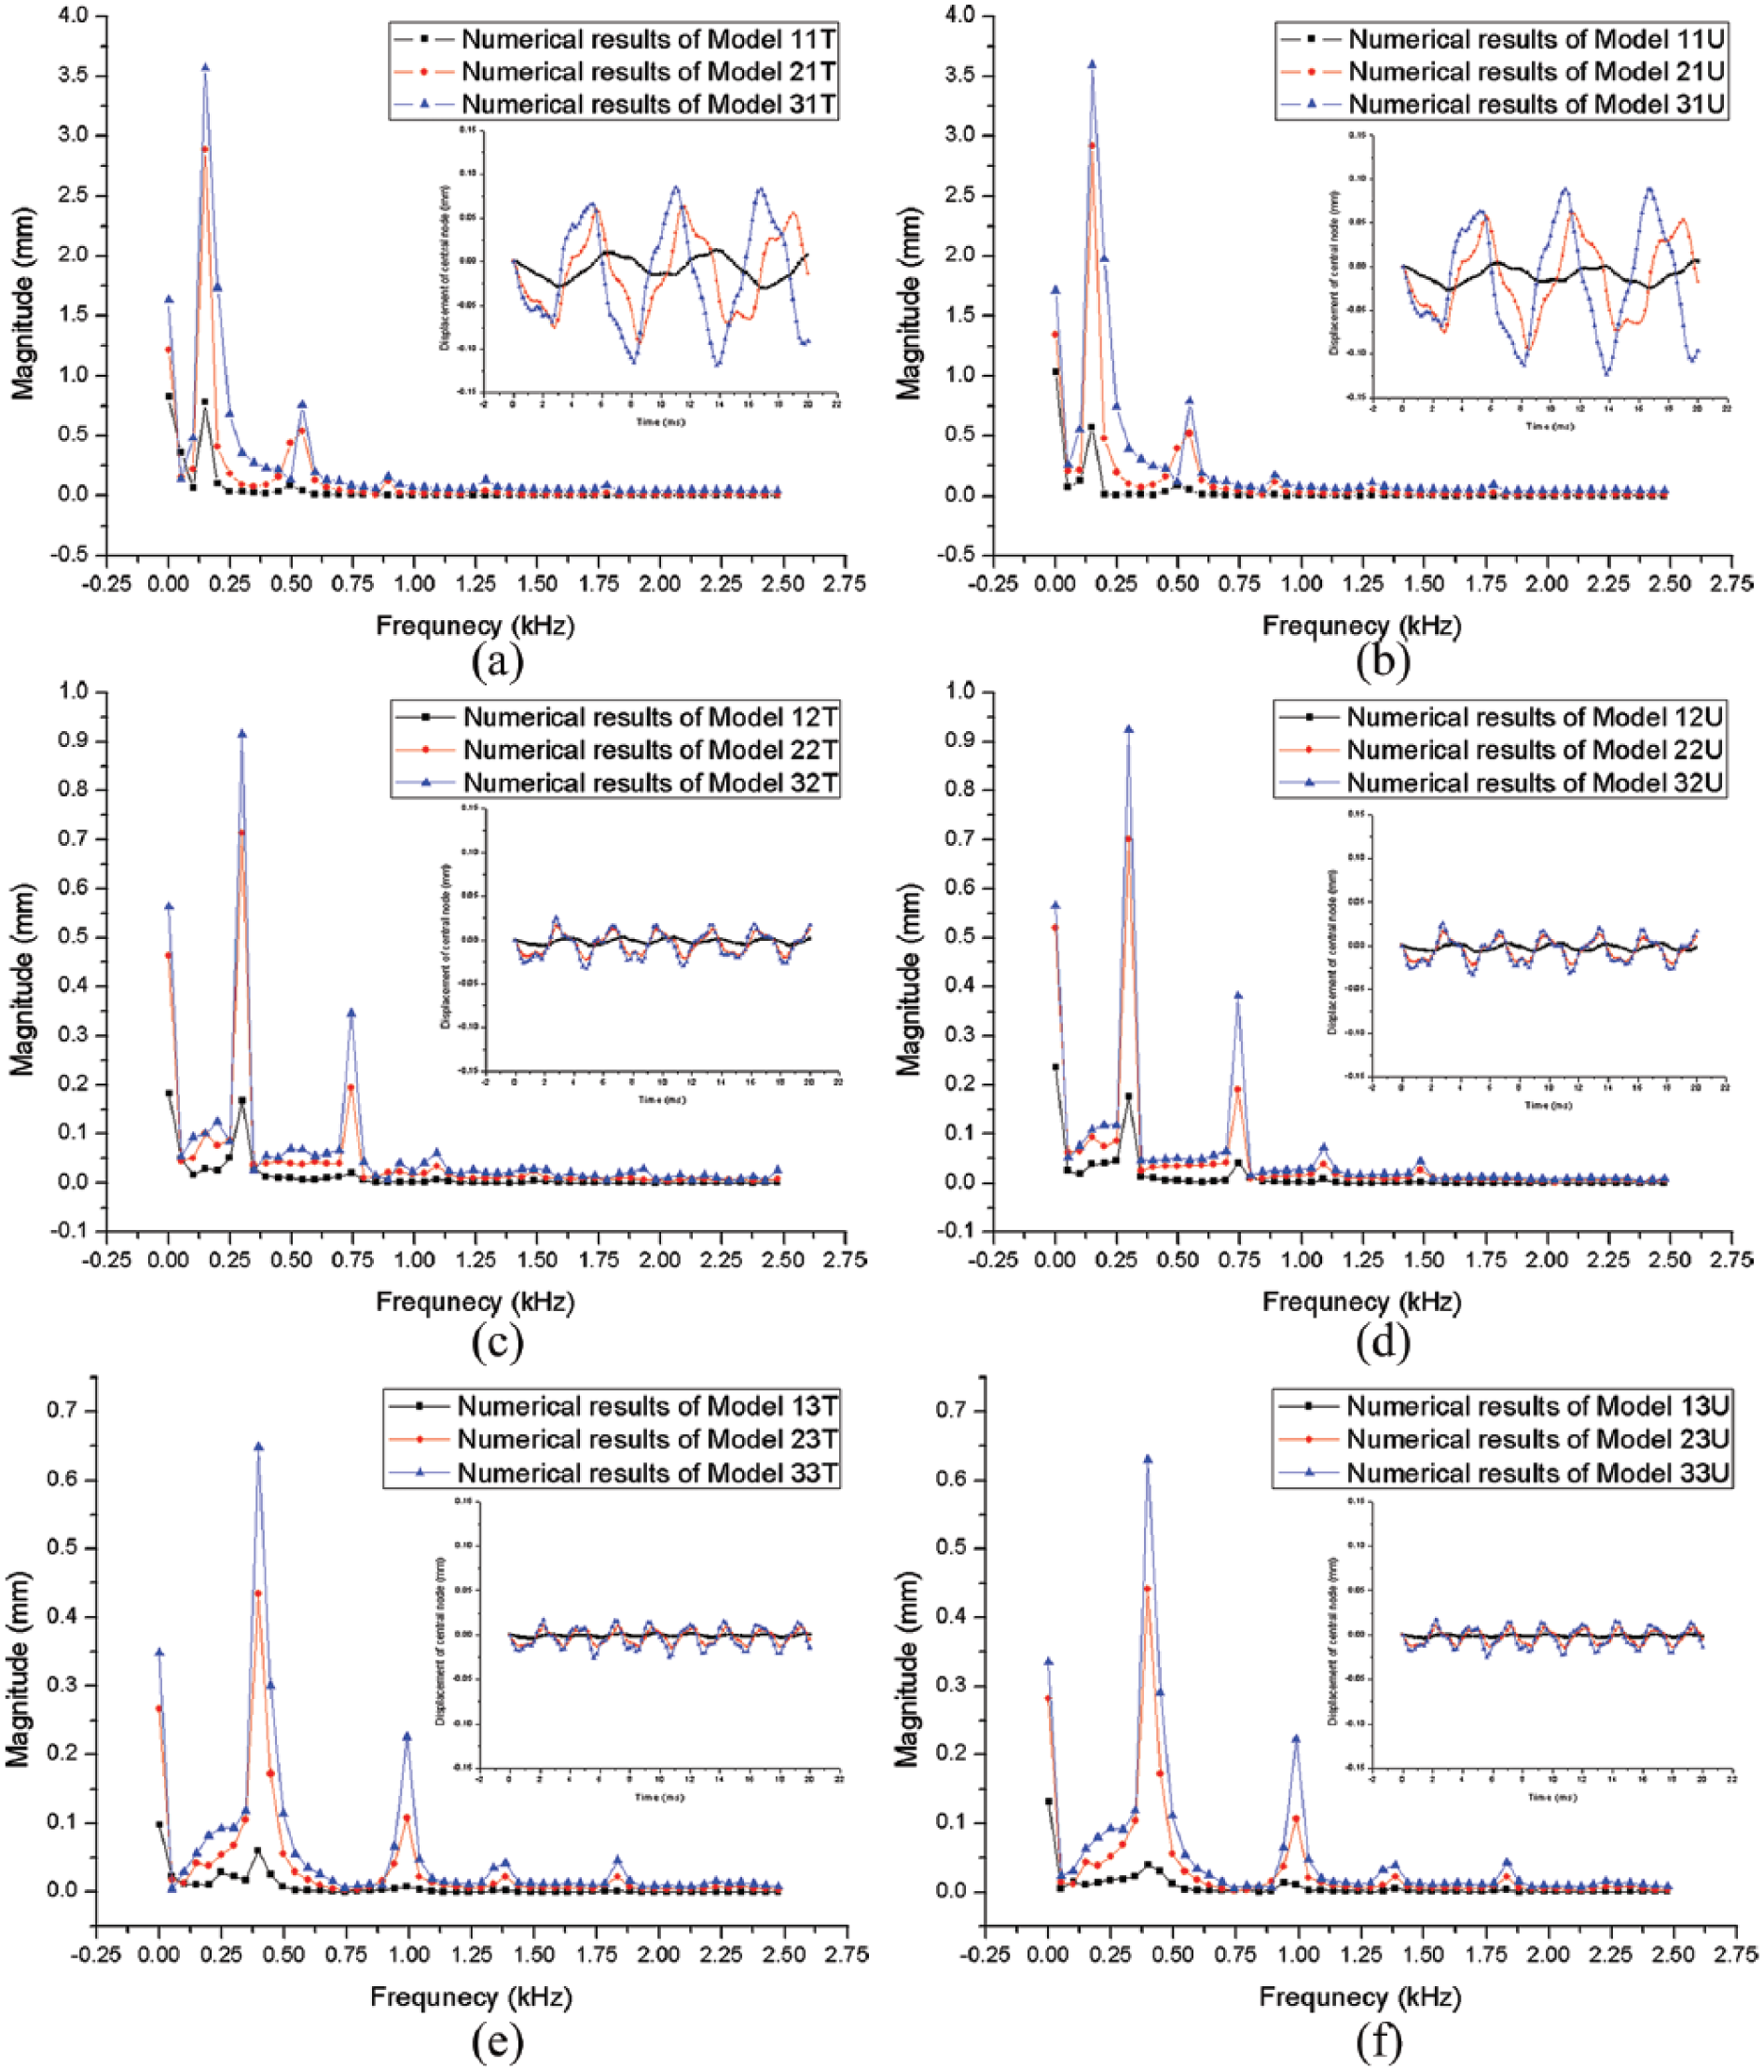
Magnitude–frequency curves and displacement curves of central node: (a) 0 N/m (treated), (b) 0 N/m (untreated), (c) 200 N/m (treated), (d) 200 N/m (untreated), (e) 400 N/m (treated), and (f) 400 N/m (untreated).
Conclusion
In this article, the two-way fluid–structure interaction numerical method was used to simulate the droplet impacting on the 66 type polyamide grid silk. The results were in agreement with the experimental results, which provided the feasibility and accuracy of this method. Meanwhile, the key data such as impact force and fabric vibration characteristics were obtained which were difficult to be obtained by existing experimental methods. The following conclusions could be obtained by analysis:
The process of droplet impacting on canopy fabric could be divided into spreading stage, recoiling stage, and oscillating stage, which was different from the impacting on traditional porous substrate. However, the fabric presented hydrophobicity during droplet spreading (contact angle was larger than 90°) and hydrophilicity during droplet recoiling (contact angle was less than 90°).
The impact velocity was the most important factor. The greater the impact velocity, the better the spreading effect, the greater the impact force peak and the vibration magnitude, the shorter the time to reach the force peak. Meanwhile, the peak value of impact force increased linearly as the velocity squared. However, the impact velocity had little effect on the principal frequency of fabric vibration.
The surface wettability of canopy was directly affected by fabric permeability. The droplet spreading factor would be increased by increasing the permeability. But this effect was limited when the impact velocity was increased.
The fabric pretension had little effect on droplet’s spreading, but had great effect on fabric vibration. The principal frequency could be increased and the vibration magnitude could be reduced by increasing the fabric pretension. In addition, the impact force peak could also be increased slightly by increasing the pretension.
Footnotes
Declaration of conflicting interests
The author(s) declared no potential conflicts of interest with respect to the research, authorship, and/or publication of this article.
Funding
The author(s) disclosed receipt of the following financial support for the research, authorship and/or publication of this article: This work supported by the Young Scientists Fund of the National Natural Science Foundation of China (grant no. 11602293), the Sichuan Science and Technology Program (grant no. 2018JY0177), the Scientific Research Foundation of the Education Department of Sichuan Province, China (grant no. 18ZA0551), and the Young Elite Scientists Sponsorship Program by CAST (grant no. 2017QNRC001).