
Abstract
The purpose of this study was to further explore the relationship between travel time and frequency of visits to collegiate recreation facilities. After surveying all students using collegiate recreation facilities at a large public southeastern US university, the local address of the 559 respondents was converted into travel time to their preferred facility using their preferred transportation method. This travel time was compared with swipe data on visits to the facility over a semester. A multinomial logistic regression was conducted to analyze the relationship between collegiate recreation facility usage level and travel time. Results support past research and ecological models of health behaviors demonstrating that proximity of recreation facilities is positively associated with higher usage by college students.
Background
The prevalence of obesity in US adults increased from 30.5% in 2017 to 41.9% in 2020 (Centers for Disease Control and Prevention, 2021), and lockdowns during the COVID-19 pandemic caused decrease in physical activity (Stockwell et al., 2021). This trend has affected young adults as well, including college students, with about 38% of college students above a healthy weight, including about 16% obese (American College Health Association, 2022). Weight gain during these early adult years can be attributed in part to a decrease in physical activity (Pauline, 2013) at a time when adult health behaviors are still being formed (Young et al., 2015).
The U.S. Department of Health and Human Services (2018) recommend adults engage in at least 2.5 h of moderate-intensity aerobic physical activity throughout each week, including 2 or more days of muscle-strengthening activities. Physical activity typically occurs in spaces designed for physical activity (Sallis, 2009). For college students this often includes collegiate recreation (CR) centers, with over half reporting at least weekly participation in facility-based CR programs (Forrester, 2014).
Research exploring factors affecting utilization of recreation facilities is framed by ecological models of health behavior, which refers to a family of theories sharing several core principles: behavior is influenced at intrapersonal, interpersonal, organizational, community, and public policy levels; there are interactions across these levels; influence varies with types of behaviors; and interventions improve when affecting more levels (Sallis et al., 2015). For example, in their meta-analysis of college students’ physical activity behaviors, Keating et al. (2005) acknowledge the importance of social cognitive theory (Bandura, 1986), which focuses on the interaction between people and environments, as used by many researchers to classify behavioral determinants. Even individual-level models, like the theory of planned behavior (Ajzen, 1991), have been expanded to include environmental factors, such as Prins et al. (2010) researching the availability of sports facilities as a moderator between behavioral intention and sports participation.
One factor in these ecological models, at the community environment level, is the proximity of recreation spaces and facilities (Sallis et al., 2012). For example, the National Recreation and Park Association notes the large impact on frequency of participation from how close someone lives to recreation facilities and programs (Godbey & Mowen, 2010). Similarly, Brownson et al. (2001) found that US adults reporting access to parks and/or indoor gyms were about twice as likely to meet recommendations for physical activity.
In the university setting, Reed (2007) notes an increase in researchers using ecological models to better understand student behavior, finding differences in awareness of CR facilities and hypothesizing this may be due to proximity of one's residence. Shaffer et al. (2017) found students living in off-campus apartments with physical activity amenities were less sedentary. Several studies have found that students living on campus were significantly more likely to visit a CR facility (Ajibade, 2011; Miller et al., 2008; Watson et al., 2006). However, this assumes residence halls are closer to a facility than off-campus living, and there has been limited research exploring the proximity of residential halls to CR facilities (e.g., Kapinos et al., 2014).
Reed and Phillips (2005) asked students to provide their local address, converting this into average straight-line distance to the CR facilities they reported using. Frequency of use was self-reported on a questionnaire. The relationship between distance and frequency of use was inconclusive, and they called for additional investigation.
Allen and Ross (2013) similarly asked students to provide their local address and compute a travel distance between local address and preferred CR facility. They also did not find a significant association between distance and self-reported frequency of physical activity. However, they recognized that their sample was too small to generalize conclusions. Prins et al. (2010) applied similar methodology to studying adolescents, and they noted the limitation of physical activity being self-reported.
The purpose of this study is to further examine the relationship between travel time and visits to several CR facilities using two novel measurements. First, rather than relying on self-report, this study utilizes direct measure of facility visits using entry point swipe data. Second, since most students cannot travel to a CR facility in a straight line at the same speed, this study converts local address into travel time for each student's preferred mode of transportation.
Methodology
The study sample came from a cross-sectional survey conducted by a large public southeastern US university. The survey was sent about 6 weeks into Spring 2021 to all students who had already visited either of the two on-campus recreational sports facilities at least twice that semester. Participants were asked to provide their current local address, typical location before visiting a recreational sports facility (from residence to facility or from classroom to facility), and preferred method of transportation (vehicle, walk, bicycle, scooter, or bus). As suggested by Peachey and Baller (2015), items were included about parking availability. Participants were also asked to rate how important proximity to recreational spaces was when selecting their local address. Student ID card turnstile swipes were recorded and linked to binary sex, age, and academic classification obtained from institution. These demographic factors were included since prior research found them useful in controlling for variance in participation (Allen & Ross, 2013).
The Google Maps package in Python was used to calculate travel time in minutes from students’ preferred location to their typically used CR facility based on their preferred transportation method. If they preferred departing from home when traveling to a CR facility, local address was used as their starting location. If they preferred departing from class, the main building of their major was used as their starting location.
Participants were categorized into groups based on average visits per week, dividing the total number of card swipes recorded at both facilities over one semester by 16 weeks. The categories were as follows: 0 to 1 time per week, more than 1 up to 2 times per week, more than 2 up to 3 times per week, and more than 3 times per week.
Statistical analyses were performed using SAS version 9.4 statistical software. A multinomial logistic regression analysis was conducted to predict usage level as the dependent variable (Kwak & Clayton-Matthews, 2002). The sample was not large enough (Peduzzi et al., 1996) to include age and academic classification, therefore only gender was included as a covariate, and travel time was used as the independent variable (de Jong et al., 2019).
Results
Invitation to participate in the survey was sent to the university email address of the 54,051 students meeting the engagement criteria. There were 1,115 surveys started, 764 of which were submitted, and 559 of those were complete, resulting in the final sample being 1% of the population. Sample (N = 559) students had an average age of 21, were predominately Freshman (32%), and were mostly female (57%) (Table 1).
Demographics of CR Users.
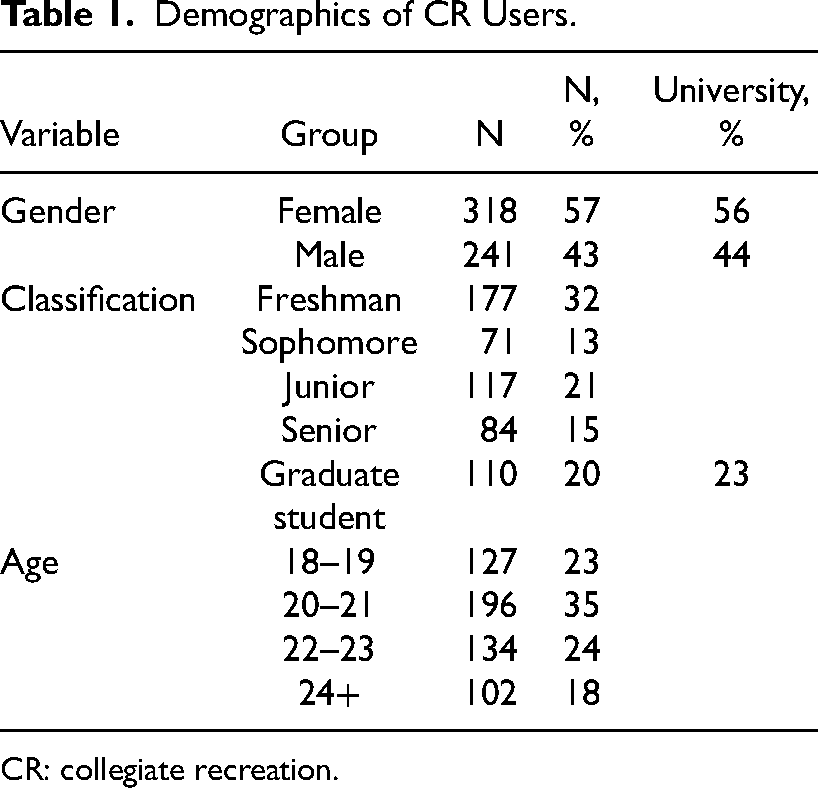
CR: collegiate recreation.
Half of users used the facilities an average of less than once per week, while the second most frequent usage level was more than three times per week (Table 2).
Distribution of Usage Categories.
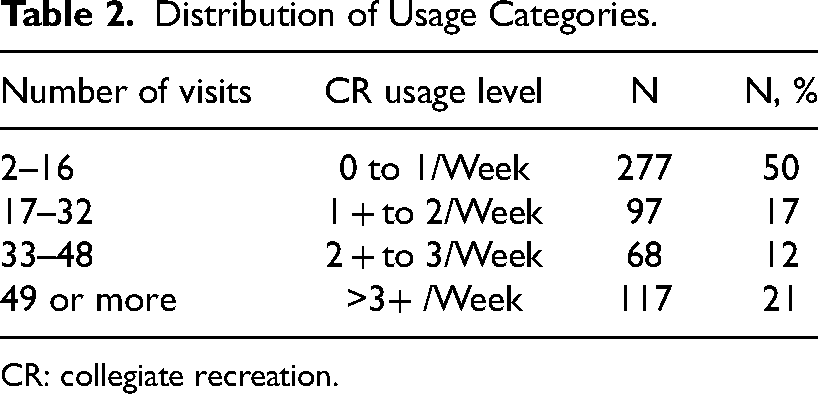
CR: collegiate recreation.
Most respondents have less than 10 min of travel time to their preferred CR facility from their typical location (class or home) using their indicated mode of travel (walk, bicycle, bus, or personal vehicle; Table 3).
Usage Level by Travel Time.
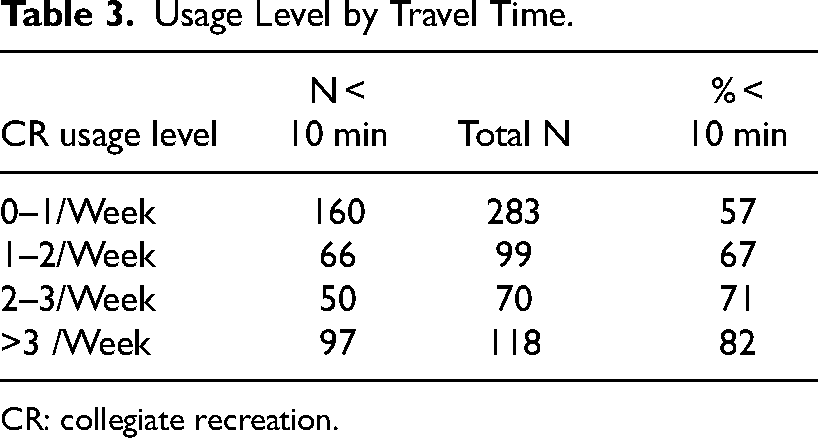
CR: collegiate recreation.
Thirty-three percent of respondents indicated proximity to recreation spaces was very important or extremely important in their selection of local address, while 42% indicated it was slightly important or not at all important. However, there was no significant difference between these groups in travel time to their preferred CR facility (t(142) = 1.14, p = .25).
Gender was a significant covariate related to travel time, χ2(6) = 51.2421, p < .0001. For example, females were 3 times less likely to be heavy user than males, χ2(3) = 23.3528, p < .001. Increasing travel time, controlling for gender, was associated with a decreased likelihood of visiting the preferred CR facility more often (χ2(3) = 30.6335, p < .001). For a 1min increase in travel time, respondents were 7.8% less likely to have visited their preferred CR facility more than three times per week, OR = 0.922, 95% CI [0.892, 0.952] (Table 4).
Odds Ratio Estimates.
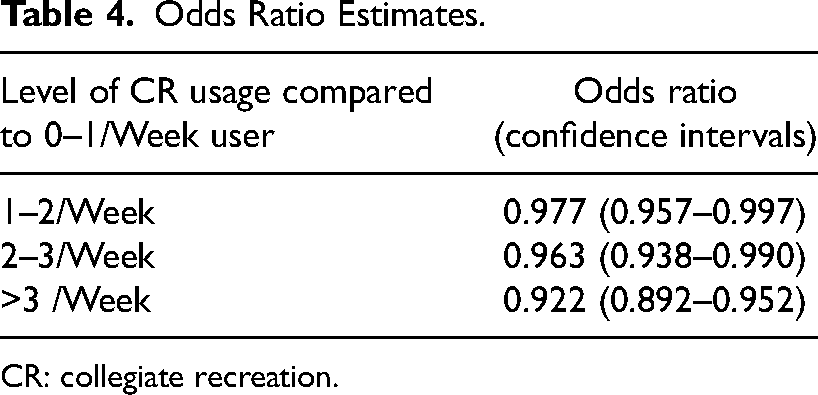
CR: collegiate recreation.
Plotting the number of visits by travel time to the most popular facility, the best fit line averages almost one less visit per semester for every two additional minutes of travel time (number of visits = 18.7–0.46 * travel time; Figure 1).
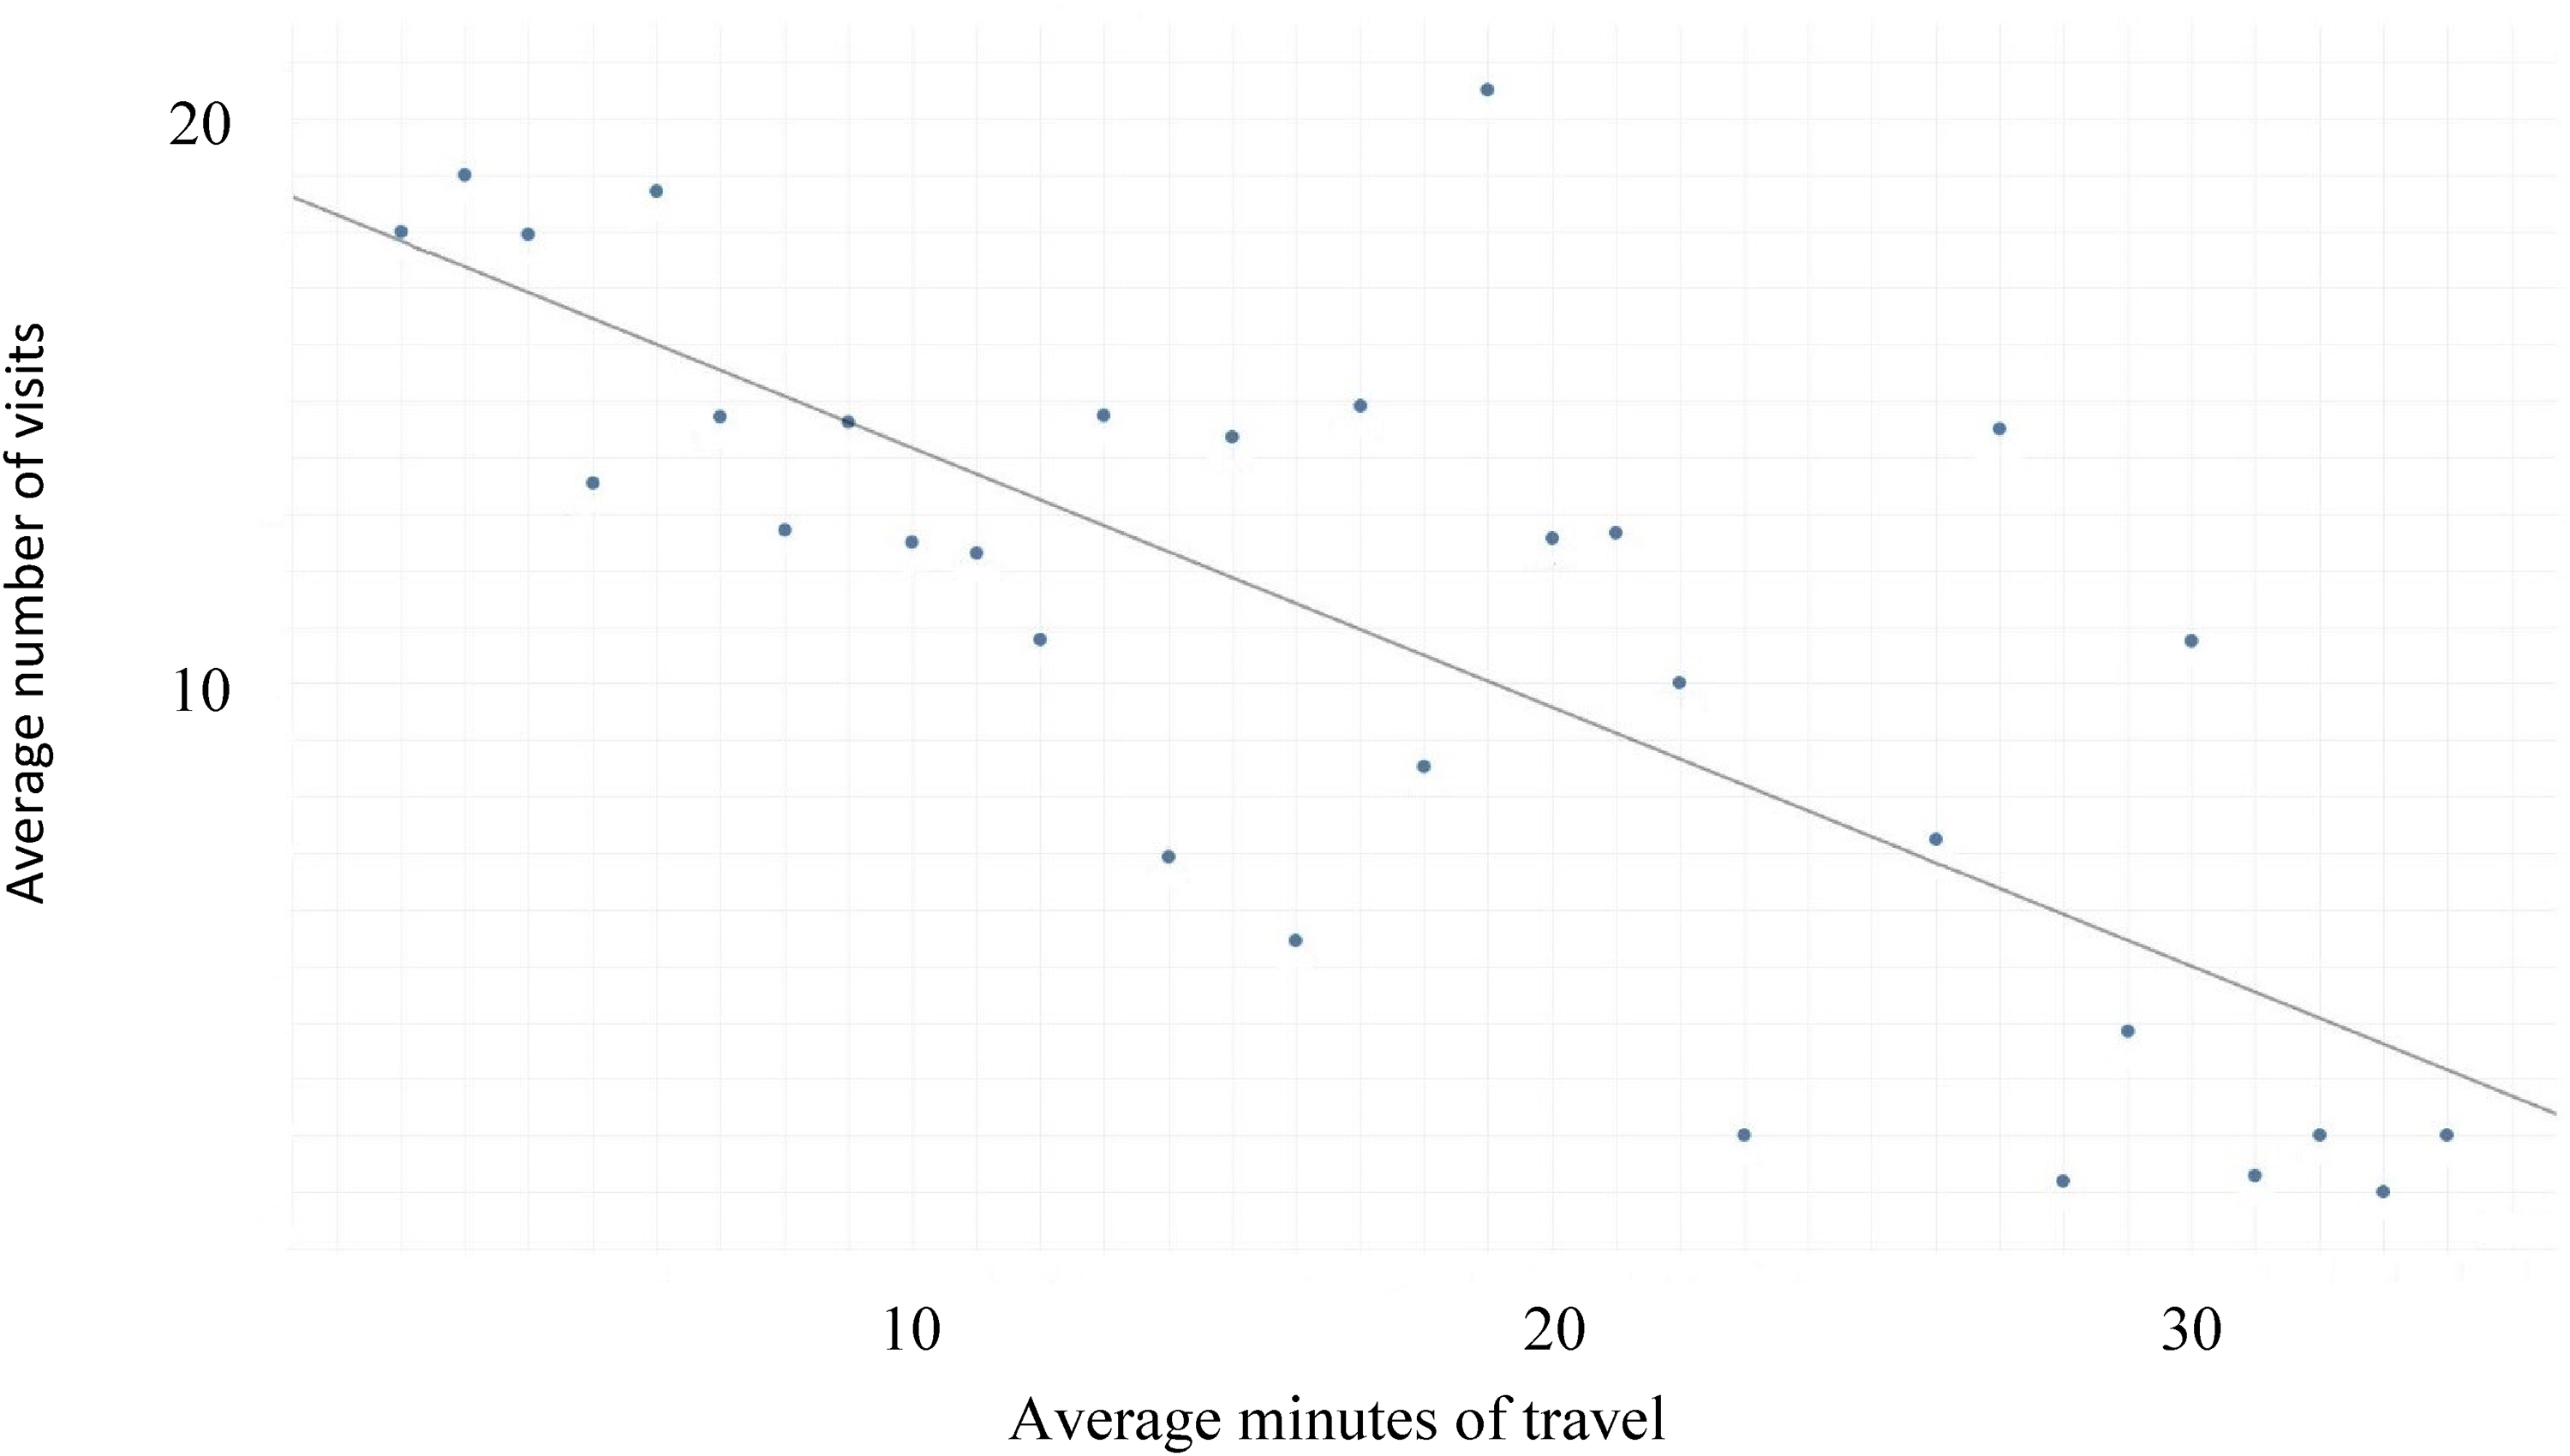
Travel time versus number of visits.
Discussion
Students with a longer travel time to their preferred CR facility were significantly less likely to be high frequency users. Inverting this result, students with a shorter travel time were significantly more likely to be high frequency users. This finding supports the physical environment element within ecological models of health behavior (Sallis et al., 2015). More specifically, this further confirms the intuitive nature of proximity to recreational facilities as a community environment factor associated with more use of recreational facilities (Sallis et al., 1998).
This study also advances research on the association between proximity of recreation facilities and activity levels. While past research using self-reported access levels (e.g., Huston et al., 2003; Shaikh et al., 2018) has found a significant association, studies using distance as a measure of proximity have been inconclusive (e.g., Allen & Ross, 2013; Reed & Phillips, 2005). Since converting to travel time in this study resulted in discerning an association, future research should continue using travel time as a potentially stronger direct method of measuring proximity.
Swipe access into CR facilities was also utilized in this study instead of self-reported activity levels. This is a more direct measure of facility use; however, it does not measure what each student does once they enter the facility, nor their level of physical activity. For example, some students may visit a CR facility to watch others play a game and not engage in any physical activity; and others exercise outside of CR facilities, some on their own, some using other CR programs. Future research should incorporate direct measures of facility access as well as additional measures of physical activity in and outside of facilities.
The study questionnaire included items about parking. However, results became invalid after multiple construction projects affected parking availability during the tracking phase of the study. Since travel time incorporated each student's preferred method of transportation, future research utilizing travel time should include considerations for parking as well as bus stops. If either is inconvenient, the actual travel time will be increased, which may reduce the likelihood of students selecting that facility location or how often they visit.
This study was limited to a response rate yielding a small fraction of the university population as a sample, so results may not generalize to the student body. Furthermore, this study is limited to one data collection period at a single institution. The methodology should be replicated and improved upon at other institutions.
Despite these limitations, there are several implications for practitioners. There was no significant difference in travel time based on self-reported importance of proximity in selecting where to live, yet proximity is significantly associated with more visits. This finding supports a core principle of ecological models, that proximity positively influences health behaviors (Sallis et al., 2015). For practitioners, this means that the placement of CR facilities relative to where students happen to live is worthy of consideration. Mapping student travel time to various existing CR facilities can also promote the creation and inform the siting of new facilities to positively influence the engagement of students living in certain regions around a campus (Reed, 2007).
Other core principles of ecological models include that behavior is influenced by a variety of factors across levels, that these factors interact, and that interventions are more influential when they impact more levels. Therefore, practitioners should incorporate the factor of proximity into promotional efforts. For example, connections between students living in the same apartment complex could be facilitated to boost interpersonal motivations. By using the results of this study and ecological models of health behavior in such ways, practitioners can further promote the usage of CR facilities so more students enjoy the benefits needed for their lifelong wellbeing.
Footnotes
Declaration of Conflicting Interests
The authors declared no potential conflicts of interest with respect to the research, authorship, and/or publication of this article.
Funding
The authors received no financial support for the research, authorship, and/or publication of this article.