
Abstract
Fetters et al.’s (2013) mixed methods integration framework uses construction metaphors: building, connecting, merging, and embedding. In a similar vein, this article uses an architectural metaphor and introduces design patterns as building blocks for mixed methods research design. A design pattern embeds one specific design decision into its preceding design decisions. As an example, I will describe a design pattern for mixed methods matched comparisons sampling. Using one exemplar study, I will demonstrate the pattern’s three design phases. Embedding matched comparisons sampling into its preceding design decisions shows that, to optimize the comparison of subpopulations in the qualitative research strand, the quantitative sample of this design pattern should aim to include almost all members of one small target population.
Keywords
My goal in this article is to support mixed methods researchers struggling with one specific design decision, which is made in the following exemplar study:
Visser et al. (2018) used a questionnaire to identify students with high, middle, and low levels of procrastination and then selected students from these three groups for an interview. (Schoonenboom, 2023, p. 367)
This design decision is an example of mixed methods sampling: Quantitative questionnaire data are used to sample students for a qualitative interview study. As part of a mixed methods study, this qualitative study is referred to as the qualitative research strand. Integrating quantitative and qualitative data sets through the sampling frame is called “connecting” by Fetters et al. (2013), who distinguish it from other ways of integrating quantitative and qualitative data, such as “building,” in which one data set informs the data collection approach of the other. Various types of mixed methods sampling have been distinguished, including basic, stratified, parallel/concurrent, sequential, identical, nested, and multilevel (Collins et al., 2007; Creamer, 2018; Onwuegbuzie & Collins, 2007; Tashakkori et al., 2021). Extending terminology from Patton (2015), I identify the exemplar as a form of mixed methods matched comparisons sampling.
In this article, I describe how mixed methods matched comparisons sampling is embedded in previous design decisions. My approach is comparable to that of Corrigan and Onwuegbuzie (2023), who model mixed methods sampling as a vertical tree to show how mixed methods sampling decisions depend on two previous design decisions: a study’s purpose (Blaikie, 2010; Johnson & Christensen, 2020) and its purpose of mixing (Collins et al., 2006; Greene et al., 1989). Such “vertical” approaches, which consider how a specific design decision is embedded in previous decisions, can be contrasted to “horizontal” approaches, in which specific design decisions are discussed in detail and less attention is paid to their dependence on other design decisions. For instance, Tashakkori et al. (2021) discuss mixed methods sampling separately from other design decisions, such as those related to formulating the research question. Similarly, Fetters et al. (2013) discuss different connection points between the quantitative and qualitative components of a study, such as the sampling frame or data collection, but they do not discuss how the sampling frame is embedded in other design decisions. What these “horizontal” and “vertical” approaches share, though, is a focus on comprehensiveness and classification. Like Tashakkori et al. (2021), Corrigan and Onwuegbuzie (2023) aim at providing a comprehensive overview and classification of mixed methods sampling procedures. This comprehensiveness makes these approaches useful for mixed methods researchers in a wide variety of contexts.
Comprehensive classificatory approaches have been criticized for providing little understanding of how qualitative and quantitative research are combined in practice (Bryman, 2006), for ignoring variation in mixed methods studies (Maxwell & Loomis, 2003), and for providing only limited support to mixed methods researchers in planning their studies (Maxwell et al., 2015). Building on these criticisms as well as on the comprehensive approaches that are critized, this article takes a different approach. Instead of a comprehensive classification, I will provide a vertical description of one specific design decision. I will show how the matched comparisons sampling decision in the exemplar study is embedded in various preceding design decisions: in the study’s distant and immediate goals, in its adoption of a comparative or non-comparative approach, and in the type of data collection in its qualitative research strand. I will show how these previous decisions determine what the optimal sampling strategy is. In the case of mixed methods matched comparisons sampling, the optimal sampling strategy is a combination of a heterogeneous qualitative sample and a quantitative sample that aims to include almost all members of one small target population.
I will call such a design decision and its preceding decisions a “design pattern” (Alexander et al., 1977; for the use of design patterns to classify whole mixed methods studies, see Van Turnhout et al., 2014). By focusing on one mixed methods sampling design pattern, I want to give mixed methods researchers in research contexts similar to the exemplar study more detailed advice on sampling than would be possible in a comprehensive treatment of mixed methods sampling. Based on literature on qualitative sampling, mixed methods sampling, and meta-synthesis, I will outline three decision phases that belong to the design pattern in which mixed methods matched comparisons sampling is embedded. I will show how design decisions in earlier phases enable and restrict design decisions later on. In the discussion, I will focus on what the mixed methods community can learn from such design patterns that could make them useful for designing mixed methods research in general.
A Design Pattern for Mixed Methods Matched Comparisons Sampling
The Three Phases of the Design Pattern for Mixed Methods Matched Comparisons Sampling.
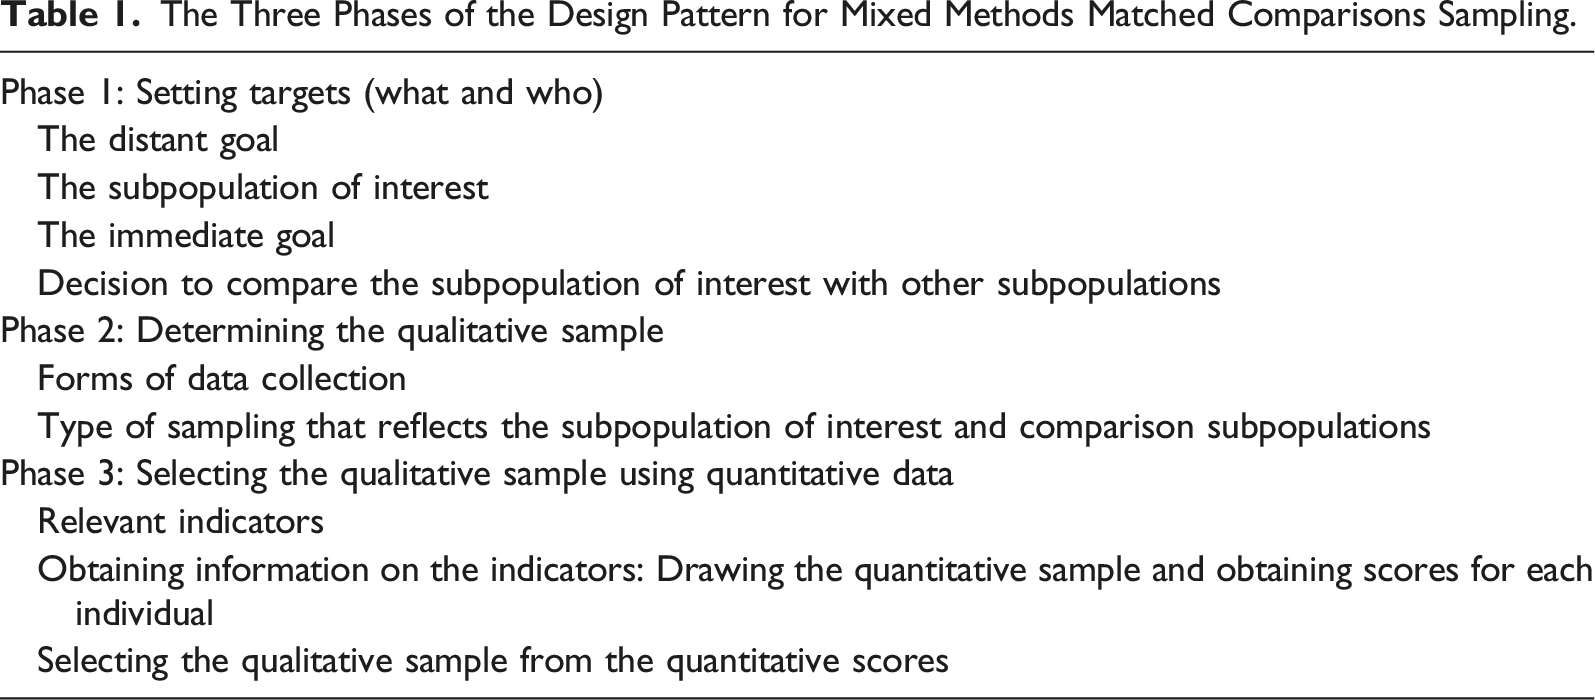
Phase 1: Setting Targets (What and Who)
The Distant Goal
A social science research study usually starts with an overarching or distant goal (Schoonenboom, 2018) to which it contributes. This goal is often about changing an unwanted situation, an objective called “influencing” by Johnson and Christensen (2020). In his dissertation project, Visser (2020) developed an intervention to reduce academic procrastination, or the postponing of study tasks, among first-year students of a small teacher education program in the Netherlands. Contributing to this intervention constituted the distant goal of the exemplar study Visser et al. (2018).
The Subpopulation of Interest
A distant goal often affects a specific target group. The distant goal in Visser et al. (2018)—developing an intervention to reduce academic procrastination—aimed at the target group of procrastinating first-year students of a teacher education program at a university of applied sciences in the Netherlands. This target group is called a “subpopulation,” which is defined as “a specific group of individuals with common … characteristics … that is the target of an intervention or a policy” (Emmott et al., 2023). The common characteristic of the subpopulation in Visser et al. (2018) is “suffering from procrastination.” The prefix “sub” in “subpopulation” indicates that it is part of a larger population. Visser et al.’s (2018) larger population is all first-year students of that specific teacher education program, some of whom procrastinate and belong to the subpopulation, while others do not.
The Immediate Goal
After the distant goal and the subpopulation of interest have been defined, the next step is to determine the study’s immediate goal (Schoonenboom, 2018). A researcher’s immediate goal is what they hope to accomplish with the study. Visser et al.’s (2018) immediate goal was to describe students’ procrastination experiences. From a distant-goal perspective, this immediate goal makes sense because understanding students’ procrastination experiences can help design an intervention aimed at reducing procrastination.
Decision to Compare the Subpopulation of Interest With Other Subpopulations
The last step of Phase 1 is determining which other subpopulations to study. The researchers have to decide if they want to compare their subpopulation of interest with other subpopulations within the same population. This kind of comparison is common in quantitative studies in which, for instance, procrastinators are routinely compared to non-procrastinators. Comparison is also useful in qualitative research because it can reveal different perspectives (Onwuegbuzie & Leech, 2007).
Comparison is underutilized in qualitative research on procrastination. Visser et al. (2018) noted that until their 2018 study, qualitative studies on procrastination relied on convenience samples of students who self-identified as procrastinators (Grunschel et al., 2013; Klingsieck et al., 2013). Instead, Visser et al. (2018) compared the experiences of their subpopulation of interest to those of other subpopulations to better understand procrastination. More specifically, they compared three subpopulations: students who procrastinated frequently, sometimes, and seldom. Comparing the three subpopulations assumes that they are part of the same population, in this case the population of all first-year students of one teacher education program at one university of applied sciences in the Netherlands. This university environment contains specific procrastination opportunities and triggers, and students may react differently to them, leading to different levels of procrastination.
Phase 2: Determining the Qualitative Sample
Forms of Data Collection
After Phase 1, the researchers know which subpopulations to study and with what aims. With this information, they can now determine what kind of individuals will be studied and how, that is, determine the sample and the methods of data collection. The question is how to best collect data in order to achieve the immediate goal. In order to achieve their immediate goal of understanding students’ procrastination experiences, Visser et al. (2018) opted to use the data collection method of interviewing.
Type of Sampling That Reflects the Subpopulation of Interest and Comparison Subpopulations
On the basis of all previous information, the researchers can now select an optimal qualitative matched comparisons sample. To optimize comparison, a purposeful, heterogeneous sample (Patton, 2015) is needed, in which each subpopulation is represented equally. In order to study individual experiences thoroughly, the sample size should not be too large—typically less than 30 cases (Creamer, 2018; Teddlie & Tashakkori, 2009). Visser et al. (2018) decided upon a small and heterogeneous qualitative sample of 24 first-year students for their qualitative research strand, equally divided among three subpopulations: 8 low procrastinators, 8 moderate procrastinators, and 8 high procrastinators.
Phase 3: Selecting the Qualitative Sample Using Quantitative Data
Relevant Indicators
Phase 3 addresses the practical issue of identifying and selecting individuals to meet the Phase 2 sample requirements. Quantitative tools can make Phase 3 much more efficient, since they let researchers quickly identify people who are members of the subpopulations to be included in the qualitative research strand. To make identification possible, researchers need appropriate indicators (DeVellis & Thorpe, 2021): quantitative scores that can be used as proxy measures of membership in relevant subpopulations. For this purpose, Visser et al. (2018) used the Academic Procrastination State Inventory (APSI; Schouwenburg, 1995). The APSI measures academic procrastination using 31 items and a Likert scale with values ranging from 1 (never) to 5 (always). The scores of the quantitative questionnaire, ranging between 31 and 155, are divided into nine stanines, each with their own interpretation (Jesson, 2018). In Visser et al.’s (2018) sample, APSI scores ranged between 36 and 56 for low procrastinators, between 73 and 81 for moderate procrastinators, and between 110 and 129 for high procrastinators.
Obtaining Information on the Indicators: Drawing the Quantitative Sample and Obtaining Scores for Each Individual
In the second step of Phase 3, quantitative data on the indicators are obtained from members of the population, which, as we argued above, should be relatively small to optimize comparison. To the extent possible, data are obtained from all members of the population, so that the pool of individuals from which to draw the heterogeneous qualitative sample will be large enough. Visser et al. (2018) administered the APSI questionnaire to all 215 members of their population: first-year students in a teacher education program at a university of applied sciences in the Netherlands. The APSI was completed by 186 students, which is 87% of the population.
Selecting the Qualitative Sample From the Quantitative Scores
In the last step of Phase 3, the quantitative indicators are used to select the desired number of members for each subpopulation. This purposeful selection procedure has been called “matched comparisons” by Patton (2015, p. 279). Matched comparisons are useful when the aim is to acquire insights into factors that differentiate one subpopulation from another. Within an otherwise comparable population, subpopulations are distinguished based on their different scores in one or more dimensions. As Patton (2015, p. 281) explains, “Matched comparisons often begin with quantitative data and categorical distinctions as the basis for matching and then move to in-depth case studies to understand what explains the differences behind the numbers.” In alignment with this explanation, Visser et al. (2018) divided their quantitative scores into three groups, representing the subpopulations of students who procrastinate frequently, sometimes, and seldom. In each group, the eight students with the most extreme scores were invited for an interview. This final step completes Table 1’s design pattern for mixed methods matched comparisons sampling.
Discussion
Before analyzing mixed methods matched comparisons sampling as a design pattern, I would like to consider its advantages. Earlier, I discussed how comparative approaches can reveal why different groups behave differently under similar circumstances. In fact, Visser et al. (2018) found that moderate procrastination students responded differently to an experienced aversion to the theoretical part of their studies than high procrastination students (low procrastination students did not report such an aversion). Low procrastinators and moderate procrastinators were highly motivated to become teachers, but high procrastinators were not. Consequently, moderate procrastinators used their motivation to keep studying during aversion experiences, while high procrastinators gave up because of a lack of motivation. These differences distinguished the three subpopulations without exception. By using a comparative approach, Visser et al. (2018) revealed significant procrastination mechanisms that previous qualitative studies with convenience samples of high procrastinators had not identified.
Mixed Methods Matched Comparisons Sampling as a Design Pattern
Turning now to mixed methods matched comparisons sampling as a design pattern, I note that it can be classified as “qualitatively driven” (Hesse-Biber, 2010; Morse & Niehaus, 2009). In mixed methods matched comparisons sampling, quantitative data are subordinate; they serve the qualitative research strand, not the other way around. The distinction between qualitatively and quantitatively driven studies is well established in the mixed methods literature (Tashakkori et al., 2021) and has been made in various ways. According to Morse and Niehaus (2009), for instance, a qualitatively driven mixed methods study is inductive. I argue that the design pattern for mixed methods matched comparisons sampling is qualitatively driven for at least three related reasons: (1) The quantitative data are not analyzed to draw conclusions, (2) the groupings they create are preliminary and may change as a result of qualitative analysis, and (3) the sampling of quantitative data is determined by the requirements for the qualitative research strand. To my knowledge, this last argument is new in the discussion on mixed methods sampling.
In the design pattern for mixed methods matched comparisons sampling, quantitative data are used to identify members of different subpopulations, but they are not analyzed statistically. A design with this characteristic would be classified as the case-selection variant of an explanatory sequential design (Creswell & Plano Clark, 2018) or a preliminary quantitative input design (Morgan, 2014). Accordingly, Visser et al. (2018) did not determine the overall level of procrastination in their first-year students, nor did they correlate procrastination scores with other relevant variables. Each individual’s score on the APSI test was classified as either high, intermediate, or low. From each of the three groups, eight students were invited for an interview. Hence, the quantitative data were used for diagnostic purposes only, making them subordinate to the qualitative data. The qualitative data were analyzed and used to draw conclusions. Although not unimportant (Corrigan & Onwuegbuzie, 2023), such quantitative data are not the carriers of conclusions in this design pattern, but instead diagnostic tools for identifying members of different subpopulations.
The subordinate character of quantitative data in the design pattern for mixed methods matched comparisons sampling is further demonstrated by the fact that quantitative grouping into subpopulations is always preliminary and may change based on qualitative findings; something that did not occur, but might have occurred in Visser et al. (2018), in which the qualitative outcomes aligned perfectly with the quantitative subpopulation divisions. In this design pattern, the quantitative diagnostic scores, such as those of the APSI, should not be interpreted as proof that individuals with essentially different characteristics, such as different procrastination levels, exist outside the context of the study. Instead, such grouping is viewed as a provisional and temporary distinction made for the purpose of the study’s qualitative research strand only, which again shows the subordinate role of quantitative data in the design pattern.
Finally, in the design pattern for mixed methods matched comparisons sampling, quantitative data are also subordinate because the qualitative research strand determines how the quantitative sample is drawn. The aim of the design pattern is to design a sampling plan for a qualitative research strand in which the experiences of a subpopulation are compared to those of other subpopulations within the same population, with the aim of acquiring insights into the factors that differentiate one subpopulation from another. Not unlike a quantitative experiment, such a comparative qualitative research strand requires a population acting in a relatively homogeneous environment. Only then can identified differences be attributed to differences between subpopulations and not to differences between environments. As a result, the population inhabiting this relatively homogeneous environment will often be small. Visser et al. (2018) chose as their relatively homogeneous environment the first year of one teacher education program at one specific university. They studied the reactions of different subpopulations (students with high, intermediate, and low levels of procrastination) to this environment. Within such a small population, data are, to the extent possible, collected from all members, so that the heterogeneous qualitative sample can be drawn from a big enough pool. Accordingly, Visser et al. (2018) administered the APSI questionnaire to all 215 members of their population (186 responded). In a quantitative-only study, the researchers might have drawn a random sample of students from several different clusters (i.e., universities) to make their findings more generalizable. Instead, Visser et al.’s (2018) choice to survey all members of their small population is based on the requirements of their comparative qualitative research strand.
In summary, the qualitative research strand of the design pattern for mixed methods matched comparisons sampling determines how the quantitative sample is drawn. If quantitative considerations had played a role, then the quantitative sample would have been a random sample from a relatedly heterogeneous population to maximize generalizability. Instead, the quantitative sample in the design pattern is drawn from a relatively homogeneous environment to optimize comparison in the qualitative research strand. Ideally, the complete target population would be sampled—an ideal that is almost never attained.
In this article, I have analyzed the design decisions related to one mixed methods sampling design pattern. My conclusion is that the design pattern for mixed methods matched comparisons sampling comes into being when researchers make specific design choices: they study experiences, use qualitative methods of data collection, they study an identifiable subpopulation and compare it to other subpopulations of the same population. Given these choices, I recommended collecting quantitative data from a population in a relatively homogeneous environment, and use these quantitative data to draw a sample for the qualitative research strand. Furthermore, I advised including as many members of the population as possible in the quantitative sample, ideally approaching a sample of the complete target population (Patton, 2015).
Contribution to Mixed Methods Research
To better understand the benefits and limitations of focusing on only one design pattern, the design pattern for mixed methods matched comparisons sampling can be compared with other authors’ descriptions of mixed methods sampling in four ways. First, mixed methods sampling is often presented in the mixed methods literature as a combination of quantitative probability sampling and qualitative purposeful sampling (Creamer, 2018; Tashakkori et al., 2021). However, in the design pattern for mixed methods matched comparisons sampling, quantitative sampling is not random. Instead, it is a sample that approximates the complete, usually small, target population (Patton, 2015)—in the exemplar, 186 of the 215 population members. Random sampling is preferable if quantitative data are going to be analyzed statistically, which is not the case in this design pattern. Furthermore, the mixed methods literature describes quantitative and qualitative samples as relatively independent, each determined by its own logic. In contrast, in this design pattern, quantitative sampling is not independent of the qualitative research strand but rather is determined by it. A sample that approximates the complete target population of one homogeneous environment is sought to optimize comparison in the qualitative research strand.
Second, this article locates the selection of different groups in a different phase of the research process than is common in the mixed methods literature. In the mixed methods literature, selecting different groups is seen as a decision within sampling, for instance, “selecting settings, groups and/or individuals that represent a sample” (Corrigan & Onwuegbuzie, 2023, p. 139) or “identif[ying] the stratification variable of interest and the subgroups on that variable (as in QUAN stratified sampling)” (Tashakkori et al., 2021, p. 169) [emphasis added]. In contrast, in Table 1, the selection of different groups is seen as a selection of subpopulations, which happens prior to sampling. As a result, this design pattern recognizes that the different subgroups in a sample represent different subpopulations, instead of being simply different groups within a sample.
Third, the preceding design decisions that I identified as most relevant to mixed methods matched comparisons sampling are different from those mentioned in the mixed methods literature. The preceding decisions in Table 1 refer to the needs of the qualitative research strand, such as what experiences to study, the subpopulation of interest, whether to include comparison, and the methods of qualitative data collection. The design decisions relevant to mixed methods sampling mentioned in the mixed methods literature include the purpose of the study, its purpose of mixing, its theoretical drive, the research question, prior knowledge, and the study’s research paradigm (Corrigan & Onwuegbuzie, 2023; Creamer, 2018; Morse & Niehaus, 2009; Tashakkori et al., 2021).
Lastly, mixed methods design patterns change how one views mixed methods research design. “Fully integrated mixed methods research design” (Creamer, 2018; Teddlie & Tashakkori, 2009) involves integration of qualitative and quantitative components at all stages of the research process separately, such as formulating the research question, sampling, data collection, data analysis, and drawing inferences. In contrast, I view a mixed methods study as a collection of design patterns that each spans various research components. Design patterns are combined in a study and overlap. It is possible that some of their requirements conflict with each other, and such conflicts should then be resolved. For example, if quantitative data are not only used to draw a qualitative sample, but are also analyzed statistically, the optimal sample for inferential statistical analysis (a quantitative random sample of the population at large) may differ from the optimal quantitative sample for the qualitative research strand (an approximation of the complete target population of people sharing a specific environment).
Fetters et al.’s (2013) mixed methods integration framework uses construction metaphors: building, connecting, merging, and embedding. In this article, I have turned to a different metaphor, inherited from architecture: that of design patterns (Alexander et al., 1977). I have shown how one decision in research design, that of mixed methods matched comparisons sampling, is embedded in a larger whole, a design pattern, which is itself one of various design patterns within a mixed methods design. I have thereby provided mixed methods researchers with more detailed support related to mixed methods matched comparisons sampling than would otherwise be possible.
Footnotes
Declaration of Conflicting Interests
The author(s) declared no potential conflicts of interest with respect to the research, authorship, and/or publication of this article.
Funding
The author(s) received no financial support for the research, authorship, and/or publication of this article.