
Abstract
Mixed methods research requires data integration from multiple sources. Existing techniques are restricted to integrating a maximum of two data sources, do not provide step-by-step guidance or can be cumbersome where many data need to be integrated. We have solved these limitations through the development of the extended Pillar Integration Process (ePIP), a method which contributes to the field of mixed methods by being the first data integration method providing explicit steps on how to integrate data from three data sources. The ePIP provides greater transparency, validity and consistency compared to existing methods. We provide two worked examples from health sciences and automotive human factors, highlighting its value as a mixed methods integration tool.
Keywords
Research involving the collection, analysis and integration of both qualitative and quantitative data in one study, or a set of closely related studies, is referred to as mixed methods (Johnson & Walsh, 2019; Schifferdecker & Reed, 2009). It is considered the third major research approach, along with qualitative and quantitative research (Harris, 2021; Johnson & Onwuegbuzie, 2007).
Adopting mixed methods research allows for the collection of both qualitative and quantitative data, capitalising on the strengths of both research approaches, whilst minimising their weaknesses to provide an integrated understanding a phenomenon (Halcomb & Hickman, 2015).
Fetters and Freshwater (2015) describe that a greater understanding can be achieved when integrating qualitative and quantitative data, as opposed to adding together separate qualitative and quantitative study results (Fetters & Freshwater, 2015).
While mixed methods research has been increasing in both developed and developing countries since the turn of the century (Harris, 2021), barriers and challenges around the integration of mixed methods research exist (Bryman, 2006; Guetterman et al., 2020). Many researchers feel uncertainty on how to integrate data collected during mixed methods projects (Bryman, 2007; Fetters, 2020; Fetters & Freshwater, 2015; Haynes-Brown & Fetters, 2021; Yin, 2014) and to date, literature provides only sparse guidance on how to integrate data from different sources (Dawadi et al., 2021).
This article will describe the development of a new data integration method, offering detailed guidance on the steps of integration for researchers and providing two worked examples from different disciplines. The need for this new data integration method was identified as part of the first author’s mixed methods project in Health Sciences.
Case Background
As part of a mixed methods project, which aimed to explore how the delivery of sexual health services through pharmacies could be improved, the first author conducted three linked studies: a quantitative retrospective study analysing the uptake and utilisation of pharmacy-based sexual health services (Gauly et al., 2020a; Gauly et al., 2021), a systematic review summarising what is known about users’ and staff experiences of pharmacy-based sexual health services (Gauly et al., 2019) and a qualitative interview study exploring staff and users’ experiences of pharmacy-based sexual health services (Gauly et al., 2020b). Figure 1 shows the procedural diagram for this project, describing the relationships between the three studies of the project. The first author initially analysed the findings from the three linked studies separately. Data from the quantitative retrospective study were analysed using descriptive statistics. Findings from the studies included in the systematic review were analysed using a narrative synthesis. Finally, the data from the qualitative interview study were analysed thematically. However, there is value in the integration of different components in achieving a result that is ‘greater than the sum of the parts’ (Barbour, 1999: p. 40). Data integration can lead to new insights, for example, in understanding variations in outcomes (Richards et al., 2019). Integrating data is therefore considered as essential for research that uses both qualitative and quantitative approaches to answer one research question or different but highly linked research questions (O’Cathain et al., 2010; Salmons, 2015). To integrate the findings from the mixed methods project, a data integration method that allowed for the systematic integration of three different study designs needed to be identified. Procedural diagram for the Health Sciences project.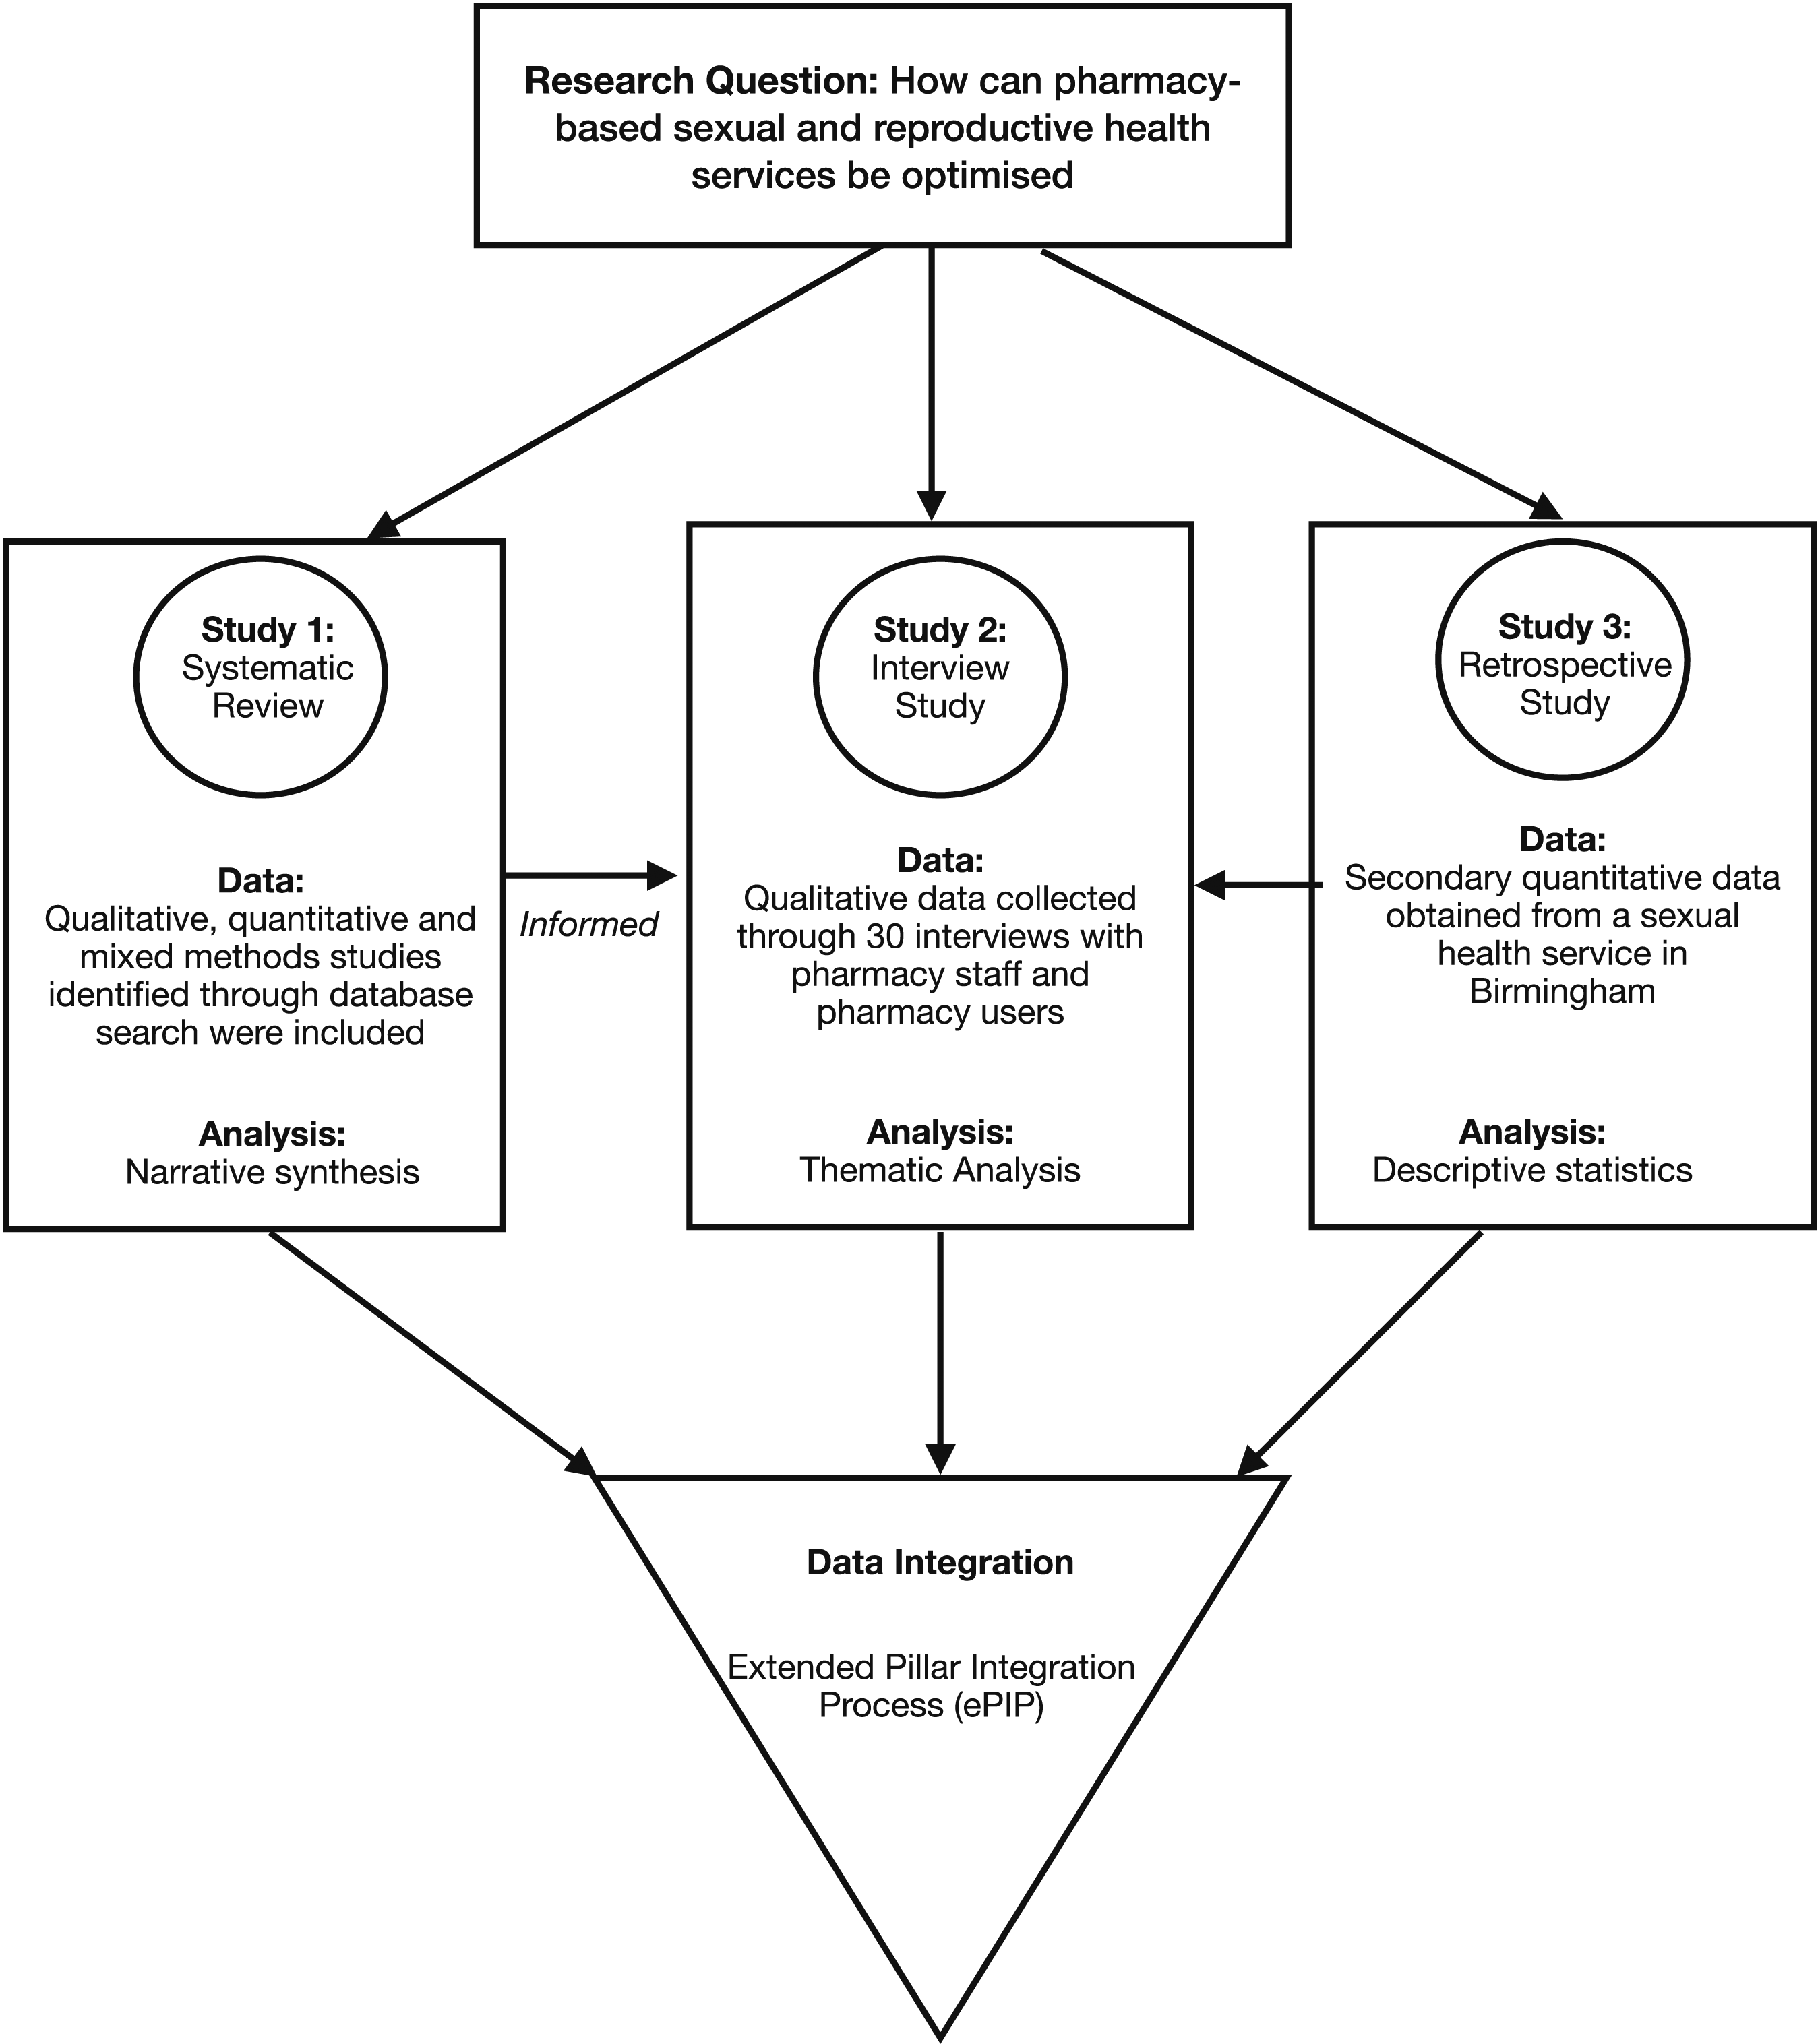
Methodological Gap and Objective
Having established the value of data integration, several methods have been proposed that attempt to formalise and standardise this process. Two data integration methods described by O’Cathain et al. (2010) include the Triangulation Protocol and the Following a Thread method (Moran-Ellis et al., 2006). Further, joint displays have emerged as another method to integrate mixed methods research (Guetterman, Creswell, & Kuckartz, 2015; Guetterman, Fetters, & Creswell, 2015). A joint display is a table used “to integrate data by bringing data together through a visual means to draw out new insights beyond the information gained from separate quantitative and qualitative results” (Fetters et al., 2013, p. 2143).
Guetterman, Fàbregues and Sakikibara have reviewed data integration techniques which use a joint display (Guetterman et al., 2021). These techniques include the recently published Pillar Integration Process (PIP) (Johnson et al., 2017), the Mixed Methods Data Linking Activity (Fetters, 2019) and the Case Comparison Table (Schoonenboom & Johnson, 2021).
However, all of those integration methods have evident limitations in their application: the triangulation protocol has been shown to only be applicable in the synthesis of data from two different qualitative data sources (Farmer et al., 2006a). PIP, the Mixed Methods Data Linking Activity and the Case Comparison Table have been shown to be most suited to integrate data from one qualitative and one quantitative data source (mixed methods research) (Fetters, 2019; Johnson et al., 2019; Schoonenboom & Johnson, 2021). In contrast, the Following a Thread method demonstrates how data from more than two data sources can be integrated (Moran-Ellis et al., 2006) and is the only method to date that enables data integration from more than two data sources. However, the Following a Thread method has been criticised for lacking clearly defined steps on how to integrate data (Johnson et al., 2019; O’Cathain et al., 2010). Consequently, a recent systematic review evaluating articles which applied the Following a Thread method found that the methodological descriptions were ‘sparse’ and ‘lacked transparency’ in included articles (Dupin & Borglin, 2020). Hence, there was an opportunity to contribute a formalised method providing step-by-step guidance on how to integrate data from three study types.
When reviewing the publications on the triangulation protocol, the Following a Thread method and PIP, we noted that none provided an example demonstrating transferability of the respective method to different research disciplines. Given that mixed methods is increasingly being used across different disciplines (Tashakkori & Creswell, 2008), we felt it was desirable for a publication on data integration methods to provide evidence on whether it is applicable to different research disciplines. The objective therefore was as follows: • Based on a previous method, to develop a data integration method which is applicable to different research disciplines and provides guidance on how to systematically synthesise data from three different data sources
Method
Selecting the PIP as the Method to be Expanded
We chose to build on an existing integration method to build on the strength of previously peer-reviewed work. We started by reviewing existing data integration methods, namely, the Triangulation Protocol, the PIP and the Following a Thread method, in order to select one which would provide the basis of our proposed expansion of integration capabilities.
As previously discussed, the Following a Thread method was deemed inappropriate as it lacked clear steps on how to synthesise data (Johnson et al., 2019; O’Cathain et al., 2010). While both the Triangulation Protocol and the PIP have clearly defined steps on how to integrate data, we chose the PIP as the method to be extended because it focuses more on the generation of new insights compared to the Triangulation Protocol (Johnson et al., 2019). The PIP has been cited 90 times (Johnson et al., 2019). To identify how PIP has been used and whether any limitations had been identified, we exported and screened all references. 70 articles could be accessed. Three could not be reviewed because they were not in English. Of the remaining articles (n = 67), 29 used PIP to integrate one qualitative and one quantitative dataset. None of the identified studies has used PIP to integrate more than two datasets. One study highlighted that it was difficult to line up data easily due to the high number of data (Ryan et al., 2022). This feedback was considered in the development of Extended Pillar Integration Process (ePIP).
Data Integration With the Original PIP
The PIP uses a joint display consisting of five columns and is completed throughout four stages: 1. Listing, 2. Matching, 3. Checking and 4. Pillar Building. Figure 2 shows the template for the joint display of the original PIP. In stage 1 (Listing), two columns are completed. Depending on whether findings from the quantitative or qualitative study will be listed first, this will be either the first and second column from the left or the first and second column from the right. Raw data and coded/grouped data from the first data source are listed in the columns ‘Data’ and ‘Categories’, respectively. The listing can be comprehensive or selective. In the second stage (Matching), the two columns on the opposite side of the joint display are completed: raw and coded/grouped data from the second data source related to findings from the first data source are listed in the same row in columns ‘Data’ and ‘Categories’; raw and coded/grouped data from the second data source not related to findings from the first data source are listed in a separate row in columns ‘Data’ and ‘Categories’. In stage 3 (Checking), all data in the four completed outside columns are cross-checked for completeness and accuracy. In stage 4 (Pillar Building), the central column is completed: meta-themes, conceptualising the insights identified from connecting and integrating the qualitative and quantitative columns, are located in the pillar columns. Meta-themes are akin to meta-inferences (Guetterman et al., 2020, 2021). Template for the joint display of the original pillar integration process (PIP) (Johnson et al., 2019 2017).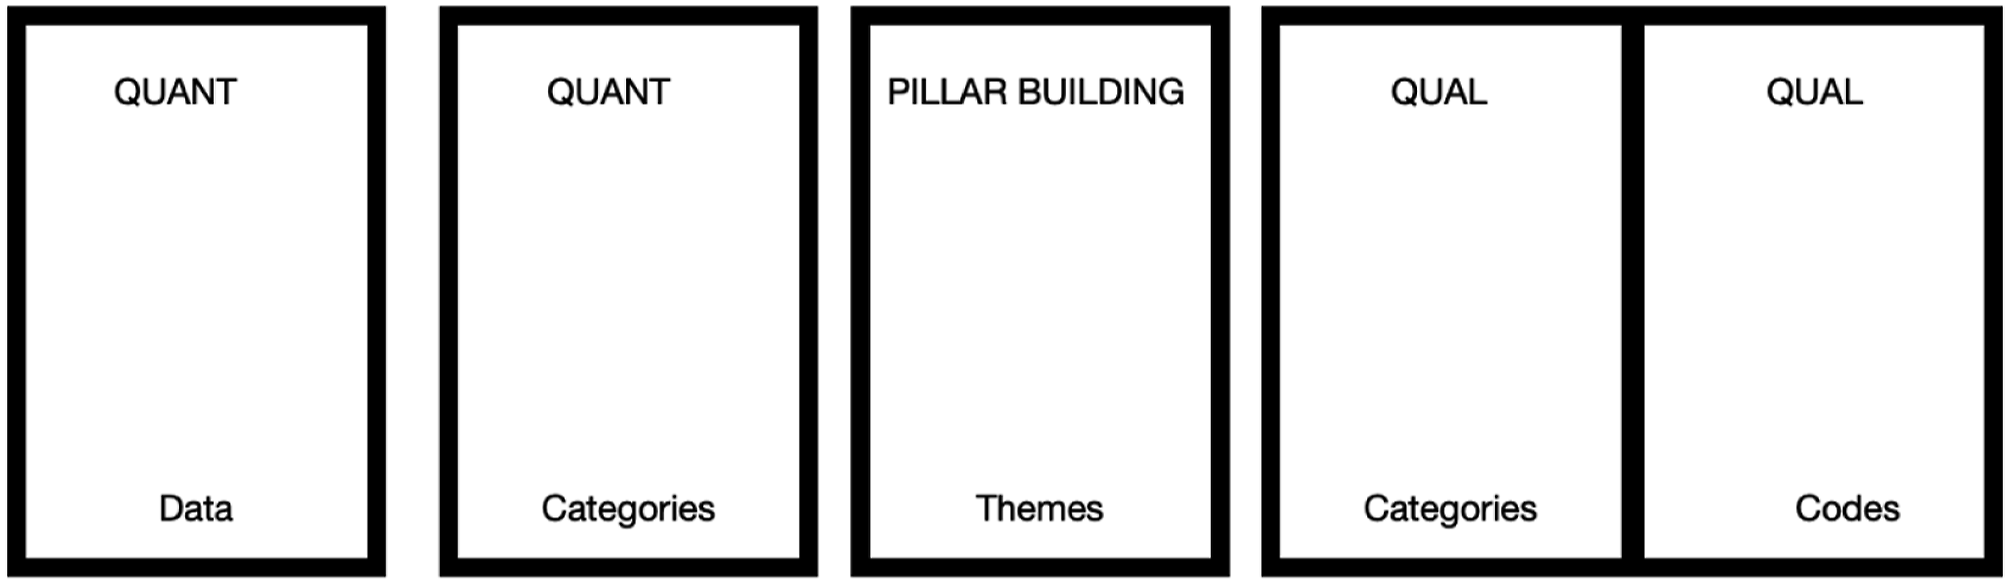
Developing the Extended Pillar Integration Process (ePIP)
The ePIP is underpinned by a subtle realist epistemological view, which reflects that we can only know reality from our personal perspective (Hammersley, 1992). This is aligned with a pragmatist position, which allows researchers to gather a range of data in order to best answer question questions (Dawadi et al., 2021; Johnson & Onwuegbuzie, 2004, 2007).
We started by following the guidance of the original PIP method to integrate the findings from the three linked studies from the Health Sciences mixed methods project on pharmacy-based sexual health services. Through the application of the original PIP, the limitations and restrictions of the model became evident. We therefore iteratively made adaptions and additions to the model throughout the data integration process. We formally recorded, discussed and refined all iterations and adaptions, along with careful justification for all changes. This led to the first version of the ePIP. To test and refine this newly developed ePIP model, we used data from three linked studies from the second author’s mixed methods project in Automotive Human Factors Design.
Demonstrating the Extended Pillar Integration Process on its Applicability to Different Disciplines
We further refined and developed the ePIP by applying the new method to data from an Automotive Human Factors Design project. The aim of this mixed methods project was to understand how future interfaces in partially automated vehicles can be designed to support the driver more appropriately in the use of these new driving systems. Three linked studies were conducted by the second author: a qualitative interview study explored and thematically analysed the types of information drivers want to be presented with a partially automated vehicle system (Ulahannan et al., 2020a). Then, an Ideas Café, an event that brings the public together with domain experts for exploratory research, was conducted to understand what factors of an interface can contribute to increasing drivers’ trust in a partially automated vehicle. Qualitative data were produced by event participants who noted down their answers on the research question on sheets of paper. The qualitative data collected were analysed thematically (Ulahannan et al., 2019). Informed by the interview study and the Ideas Café, a prototype interface to support the driver in the use of a partially automated system was designed. Consequently, an eye tracking study was conducted to collect quantitative data to understand how the information displayed on the prototype interface is used and crucially, to understand how this changes longitudinally with increasing experience with the system (Ulahannan et al., 2020b). The interface was displayed to participants whilst they experienced a simulated partially automated drive, every day for five consecutive days. A statistical analysis of the eye tracking data was conducted. Figure 3 shows the procedural diagram from this mixed methods Automotive Human Factors Design project. It describes how the three studies of the project were related. We then used the ePIP to integrate the findings from those three studies. Any further iterations to the ePIP were noted and justified. Procedural diagram for the Automotive Human Factors Design project.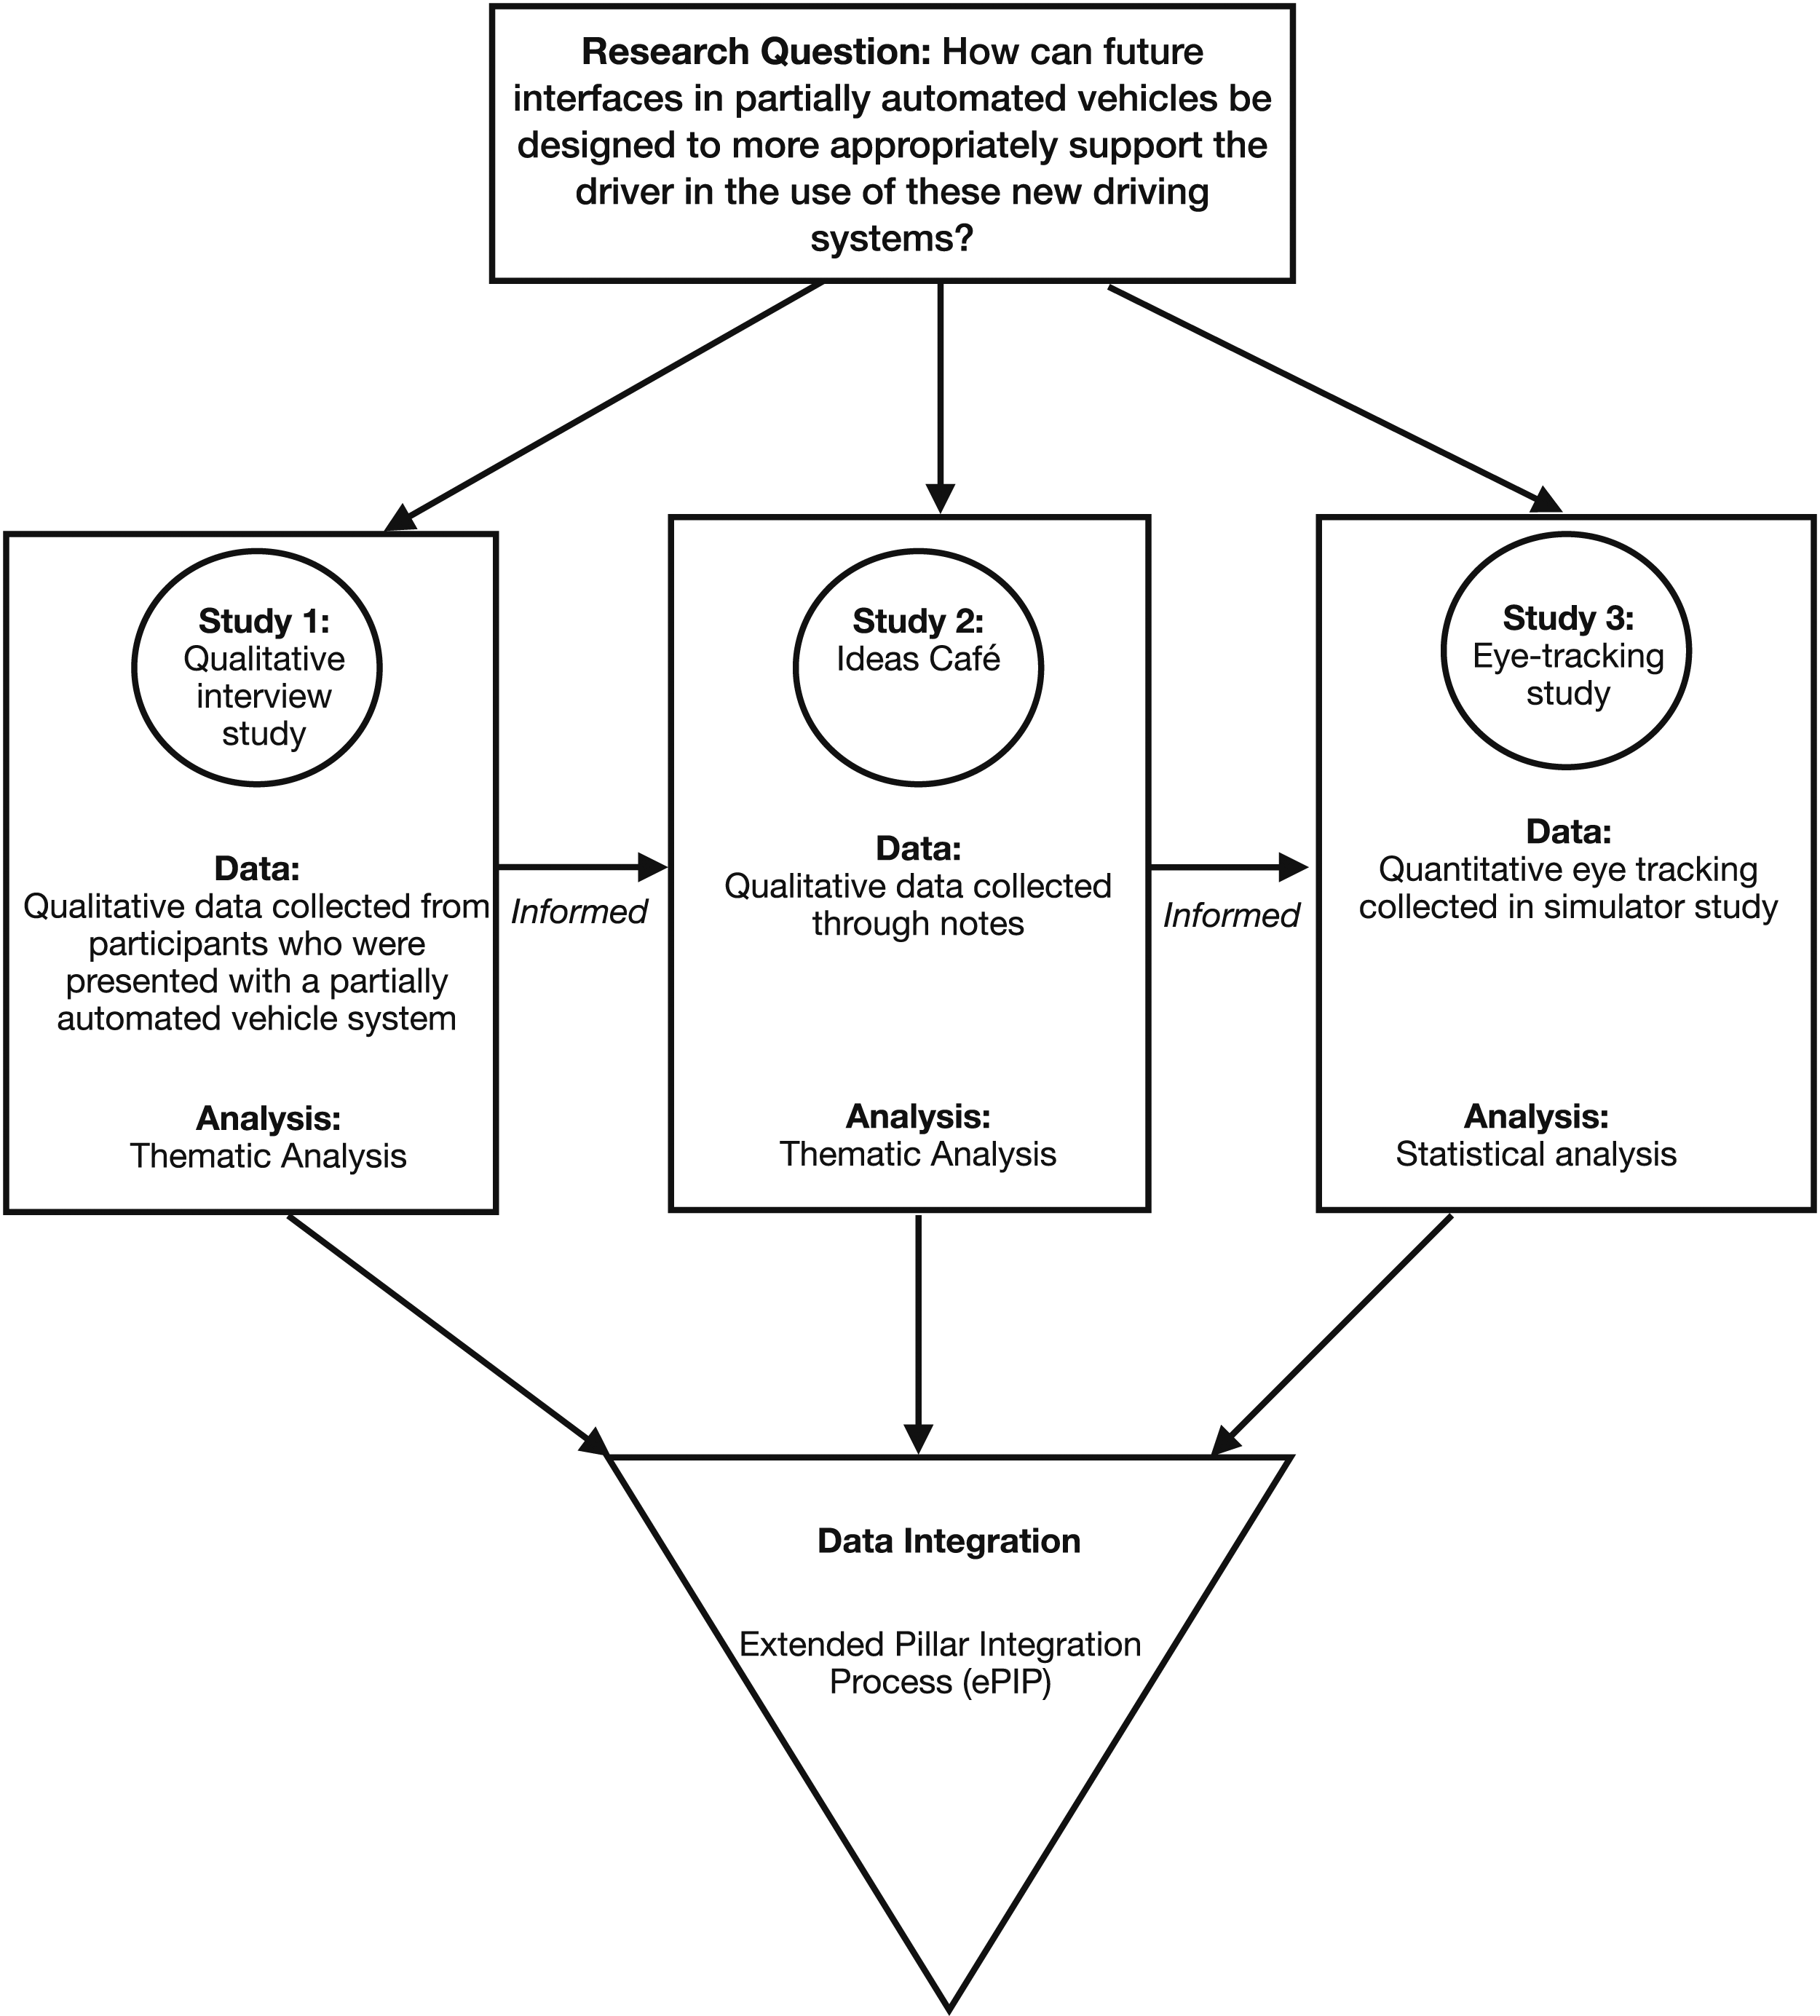
Results
We developed the ePIP through, firstly, integrating data from the mixed methods Health Sciences project and then applying and refining the developed method on the integration of data from an Automotive Human Factors Design mixed methods project. In the next section, we describe iterations on the joint display of the original PIP and their contributions. In the following section, we then explain the iterations on the stages of the original PIP and their contributions.
Joint Display Iterations and Their Contributions
An overview of all iterations on the joint display are provided in Figure 4. The iterations on the joint display relate to the number of columns, order of columns and labelling of columns. All iterations and their contributions are now described in turn. Overview of all iterations which occurred as part of the development of the ePIP.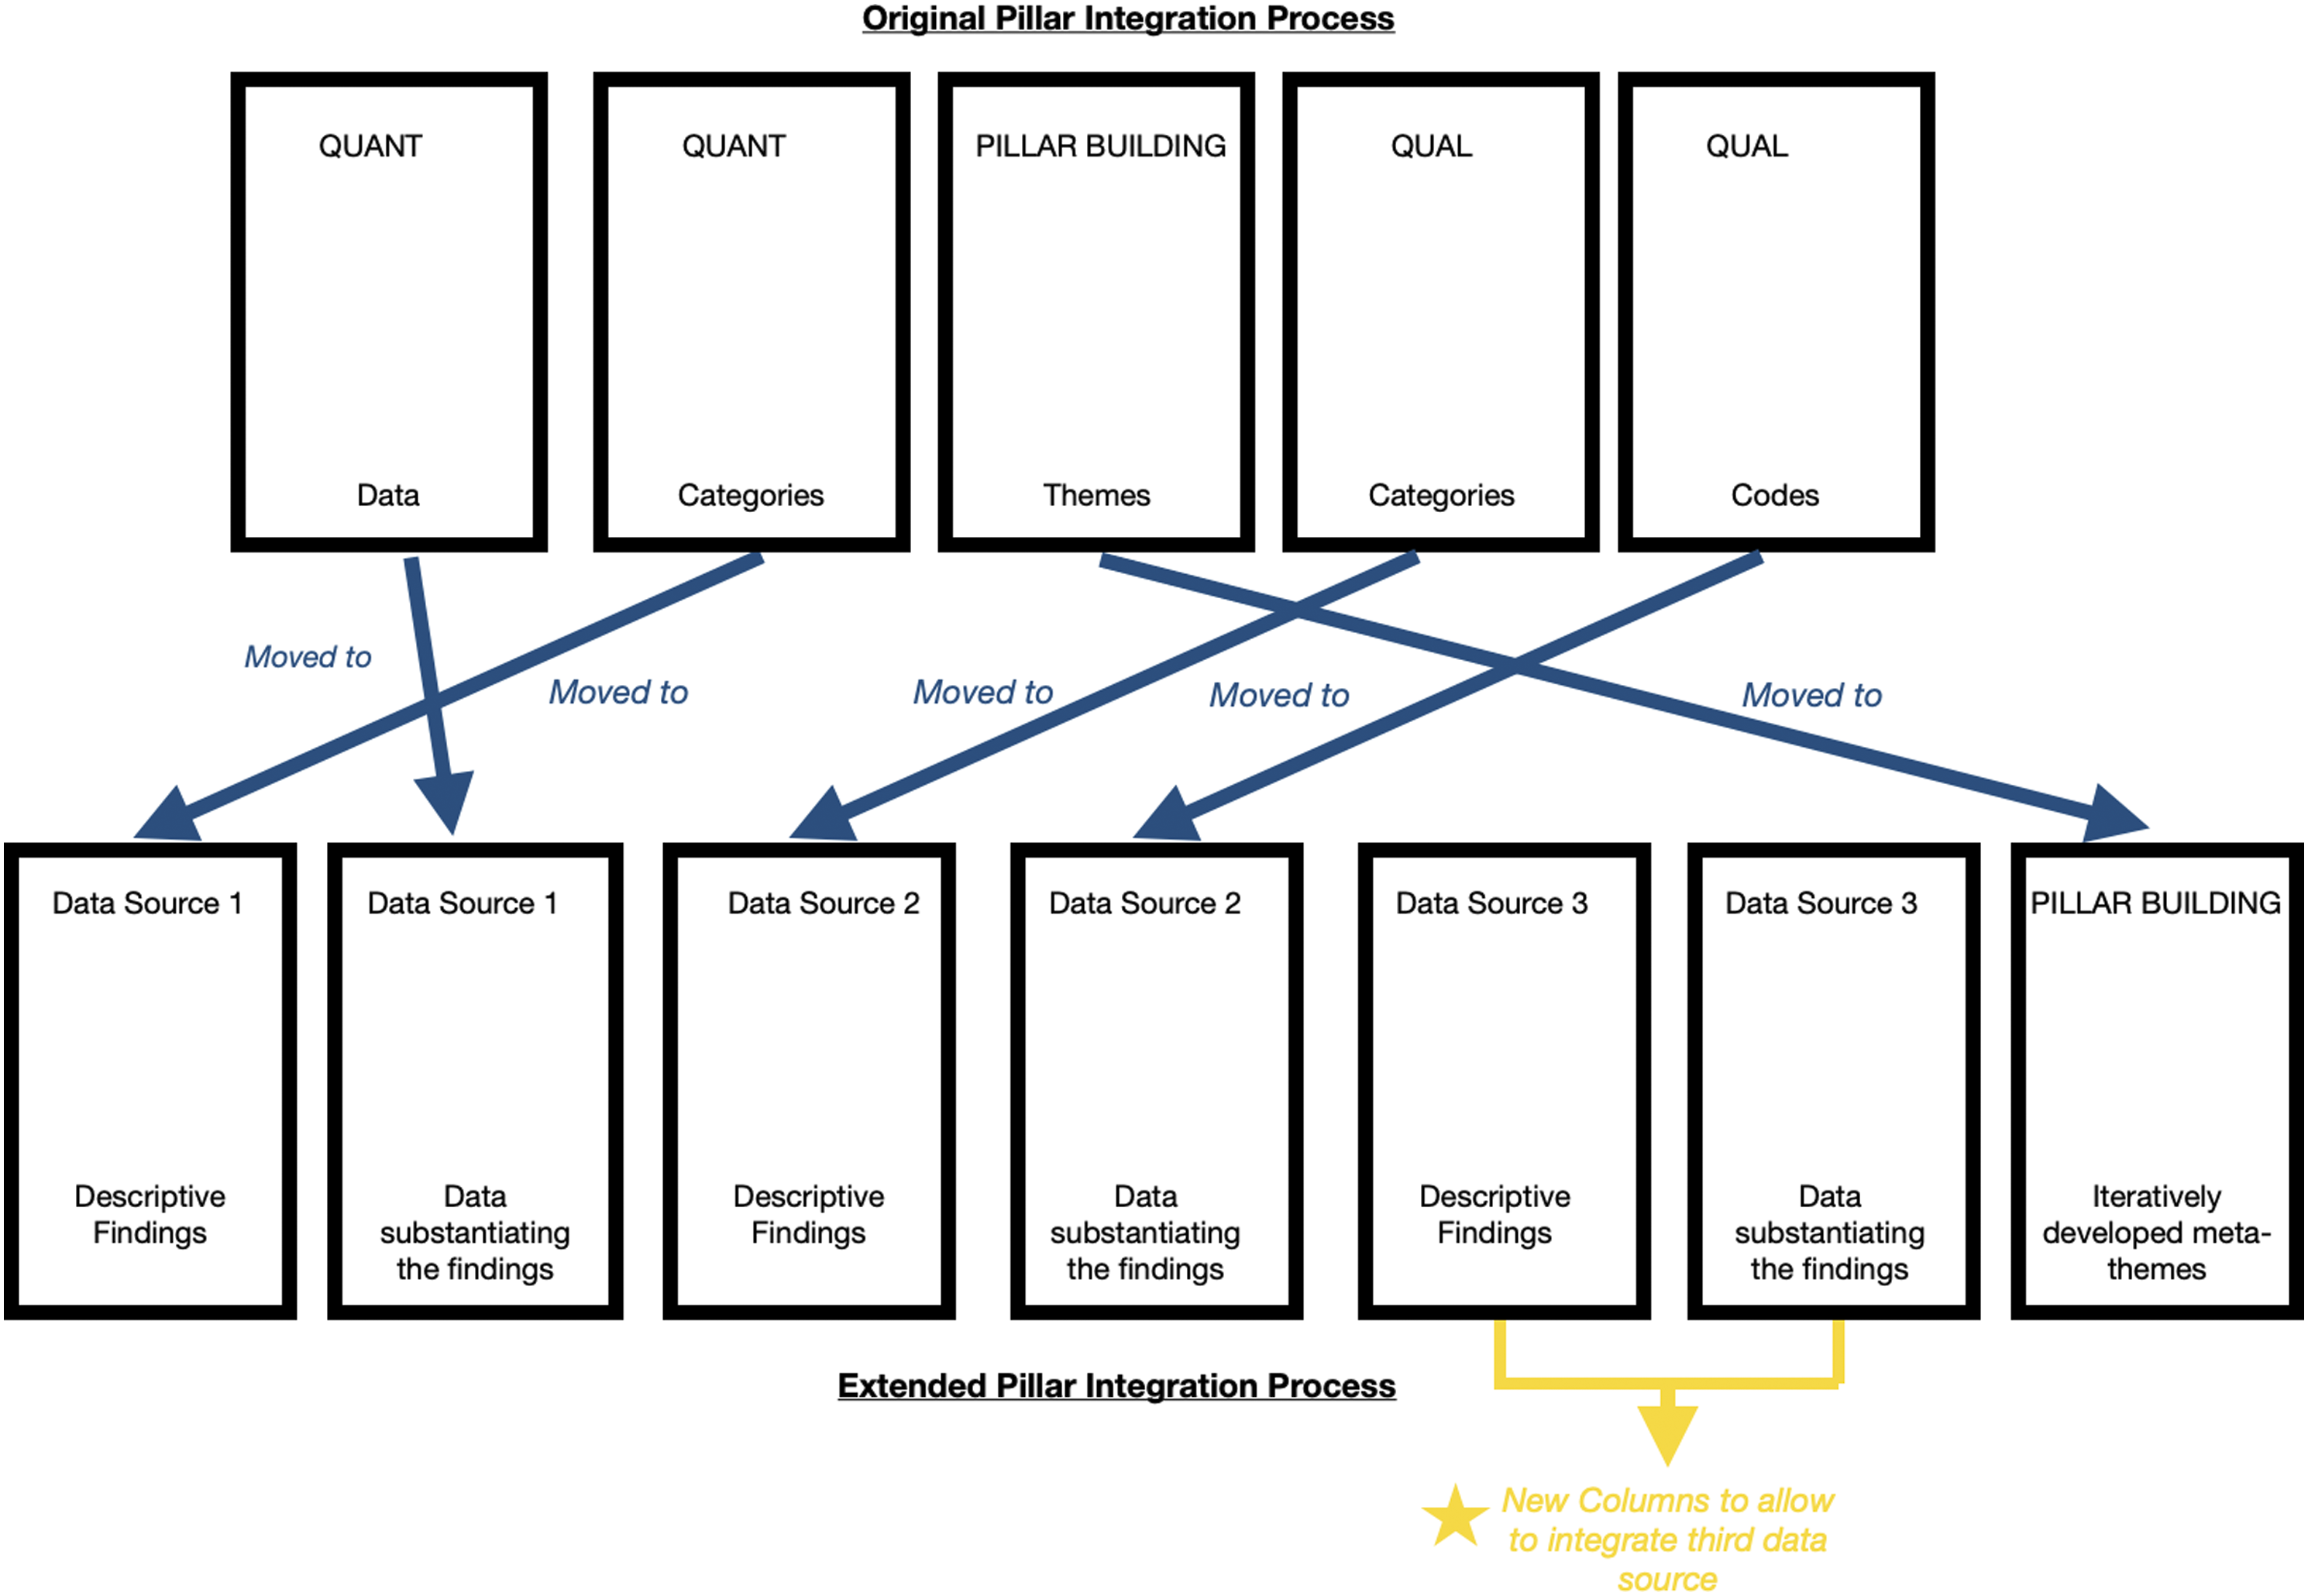
Iterations and Their Contributions Relating to the Number of Joint Display Columns
The original PIP, consisting of five columns (one pillar building column, two columns for data source 1, two columns for data source 2), only allows for the integration of data from two data sources. To allow for the integration of three data sources, two columns were added as part of the development of the ePIP. Hence, as shown in Figure 4, the ePIP consists of seven columns (One pillar building column, two columns for data source one, two columns for data source two, two columns for data source three).
Iterations and Their Contributions Relating to the Order of Joint Display Columns
The pillar building column is placed centrally in the original PIP. However, with seven columns, the centre column of the ePIP would have been between the third and fourth column and would have split up the two columns of the second data source. As the content of these two columns belong together, this would have negatively impacted the structure of the joint display. As shown in Figure 4, the pillar building column was therefore moved to the far right of the joint display.
Further, when integrating the data of the mixed methods project on pharmacy-based sexual health services, it was considered more user-friendly to first list the descriptive study findings and then back them up with substantiating data rather than the other way around. That was particularly true because the findings of each individual study had already been analysed previously and were already grouped into descriptive findings. As shown in Figure 4, the columns describing the findings (namely, the columns ‘QUANT categories’ and ‘QUAL Categories’) were therefore placed to the left of the data substantiating the findings (namely, column ‘QUANT Data’ and column ‘QUAL Codes’).
Iterations and Their Contributions Relating to the Labelling of the Columns
The labelling of the columns in the original PIP suggests that only data from one quantitative and one qualitative data source could be integrated. It further suggests that quantitative data were provided as substantiating data for the quantitative data source and quotes provided as substantiating for the qualitative data source. However, we intended to integrate three data sources and wanted the ePIP to be inclusive for the integration of all types and combinations of data sources. As shown in Figure 4, we therefore changed the labelling of the columns ‘QUANT’ and ‘QUAL’ to ‘DATA SOURCE 1’, ‘DATA SOURCE 2’ and ‘DATA SOURCE 3’. Further, the label ‘categories’ was changed to ‘descriptive findings’ and the labels ‘Data’ and ‘Quotes’ were combined to ‘Data substantiating the findings’ to be more inclusive of all types of data sources.
As outlined and justified in a later section (see 3.2.2), meta-themes are developed iteratively in the ePIP rather than at the end of the integration process. As shown in Figure 4, the label ‘meta-themes’ was therefore changed to ‘iteratively developed meta-themes’.
Iterations on the Pillar Integration Process Stages and Their Contributions
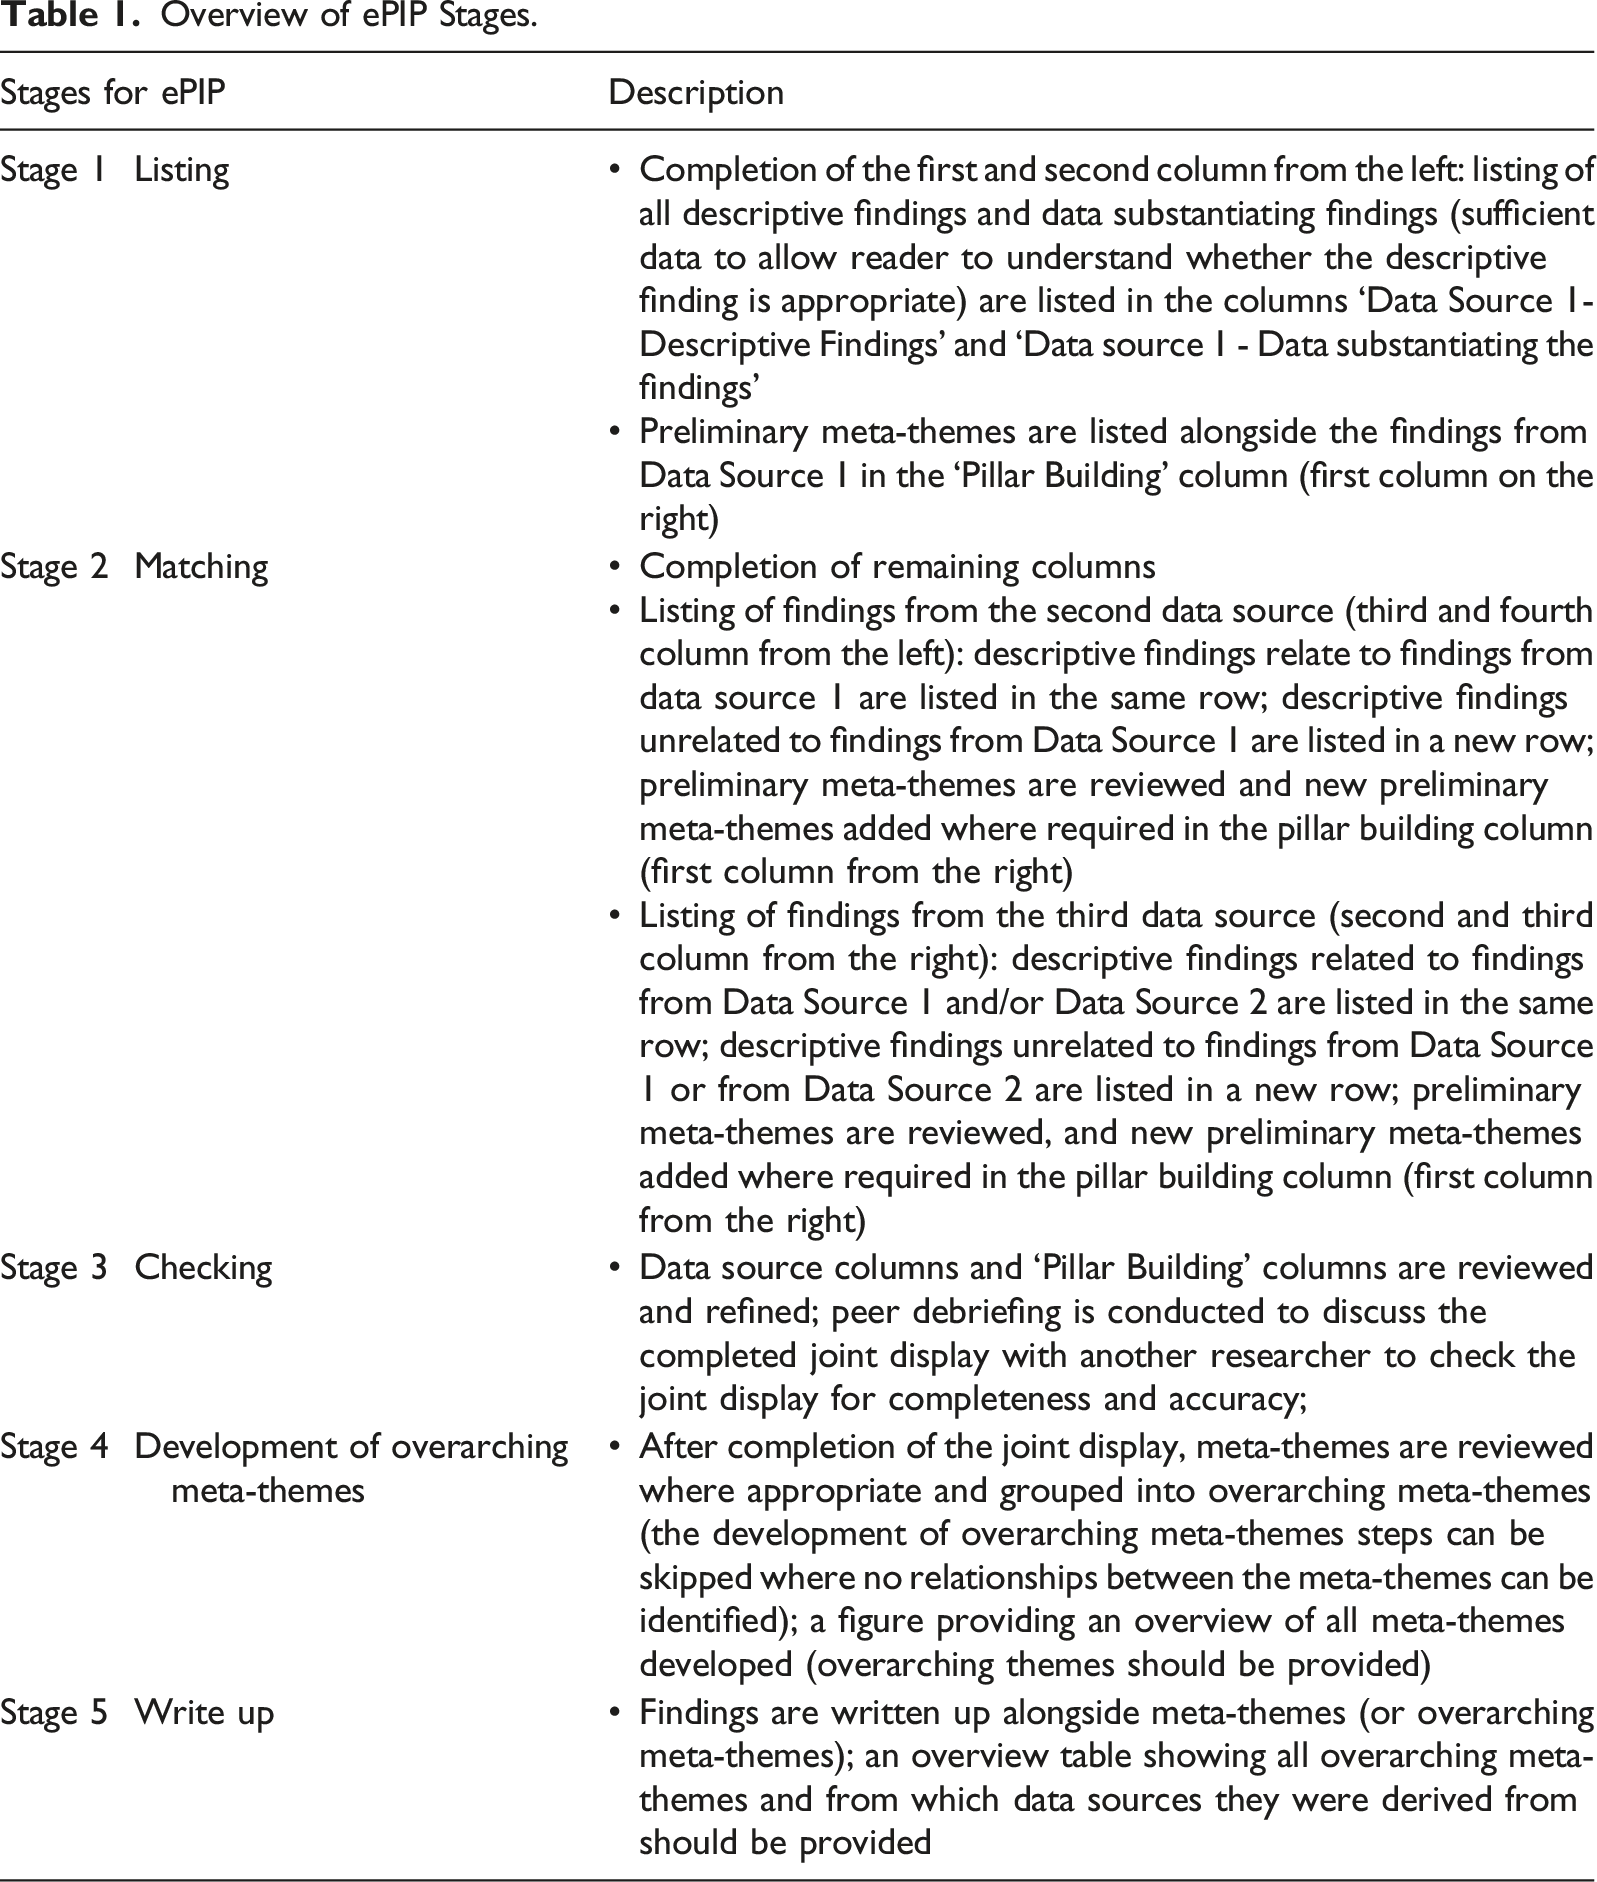
Overview of ePIP Stages.
Guidance Regarding the Comprehensiveness of Listing of Descriptive Findings and Substantiating Data as Part of Stage One
In the publication of the original PIP it is stated that ‘listing can be comprehensive or selective’ (Johnson et al., 2019). However, when developing the ePIP, we felt that that by omitting findings, this could possibly lead to bias in the data integration process and lead to the inconsistent application of the ePIP. We therefore recommend that all descriptive findings should be listed in the ePIP. We felt there was no guidance in the publication of the original PIP on how much data substantiating the descriptive findings needed to be added.
We initially intended to add all substantiating data for the descriptive findings. However, this led to an overly long table which made it difficult to keep an overview of findings. An overly long table prevents clarity and increases the risk that opportunities to synthesise findings between studies are missed. This was a criticism by other researchers who used the original PIP to integrate study findings (Ryan et al., 2022). After discussion, we decided that as much data (e.g. quotes, percentages, etc.) should be listed as needed to allow the reader to understand whether the description of the findings are appropriate. Hence, data substantiating the findings does not have to be comprehensive but should be sufficient to clearly back up the description of the finding.
Development of Meta-Themes Throughout Stage One and Three
Meta-themes, also referred to as meta-inferences (Guetterman et al., 2020, 2021), are themes that are developed by moving beyond the individual studies and the separate datatypes and by comparing and contrasting the datasets (Johnson et al., 2019).
In the original PIP, the development of meta-themes occurs only in the final stage called Pillar Building. However, once we had listed all the data from the first data source of the mixed methods Health Sciences project and we moved on to Matching stage. However, we felt the large number of rows created as part of the listing process made it difficult to keep an overview on how findings from the different data sources were related. We therefore decided to develop meta-themes iteratively rather than only at the final stage to keep a better overview. The meta-themes were entered into the column on the right whenever a new finding was listed into a row. Meta-themes were reviewed in every stage. This also encouraged us to continually think and reflect on the relationships between the findings throughout the process. Since all columns are completed at the end of stage two ‘Matching’, all columns are reviewed for completeness and accuracy in the third stage ‘Checking’.
Integration of Third Data Source as Part of Matching Stage
As outlined previously, we added two columns as part of the development of the ePIP. Those columns (second and third column from the right) are completed in the same manner as the columns for the other data sources. Where a finding from the third source matches (relates or supports) a finding from any of the previously listed data source(s), the findings are listed in the same row as the findings of the respective data source(s). Where a finding does not match (is not related to/does not support) a finding from the previously listed data source(s), the finding is listed in a separate row. After all findings from the third data source are listed, data substantiating the findings from the third data source are listed. Where data from the third data source is added in the same row as data from the previously data sources, the meta-themes listed in the pillar building column should be reviewed and where necessary be further developed. Where findings are added into new rows, new preliminary meta-themes should be listed in the first column from the right.
Integration of Peer Debriefing Into Checking Stage
Peer debriefings are meetings or exchanges between a researcher and the research team or an impartial peer, in which extensive discussions about research findings are conducted (Simoni et al., 2019; Spall, 1998). While Johnson et al. do not specify that another researcher should be involved in the third stage ‘checking’, we recommend that peer debriefing should be conducted to check the completed joint display for completeness and accuracy. Involving another researcher can increase the validity of the findings and reduce bias. When checking the joint display of the Health Sciences mixed methods project, the joint display was checked by the PhD supervisors of the first author. In the example from the Automotive Human Factors Design mixed methods project, the completed joint display was reviewed and refined through peer debriefings with other researchers.
We have provided the completed joint display for the Automotive Human Factors Design project as example in the online Appendix (see Supplementary Material 1). It shows all seven columns of the ePIP and can be used as guidance for researchers.
Development of Overarching Meta-Themes as Optional Additional Stage
When integrating data from the Health Sciences mixed methods project as part of the development of the ePIP, we identified eighteen meta-themes. We felt that the high number of meta-themes made it difficult to keep an overview of them. We therefore decided to review all meta-themes and to identify whether there were any relationships between them. This led to the development of overarching meta-themes as shown in Figure 5. We therefore suggest that researchers should review their meta-themes for relationships and develop overarching meta-themes where appropriate. A figure presenting all meta-themes (and their overarching meta-themes) should be provided. Overarching themes and meta-themes from the Health Sciences mixed methods project.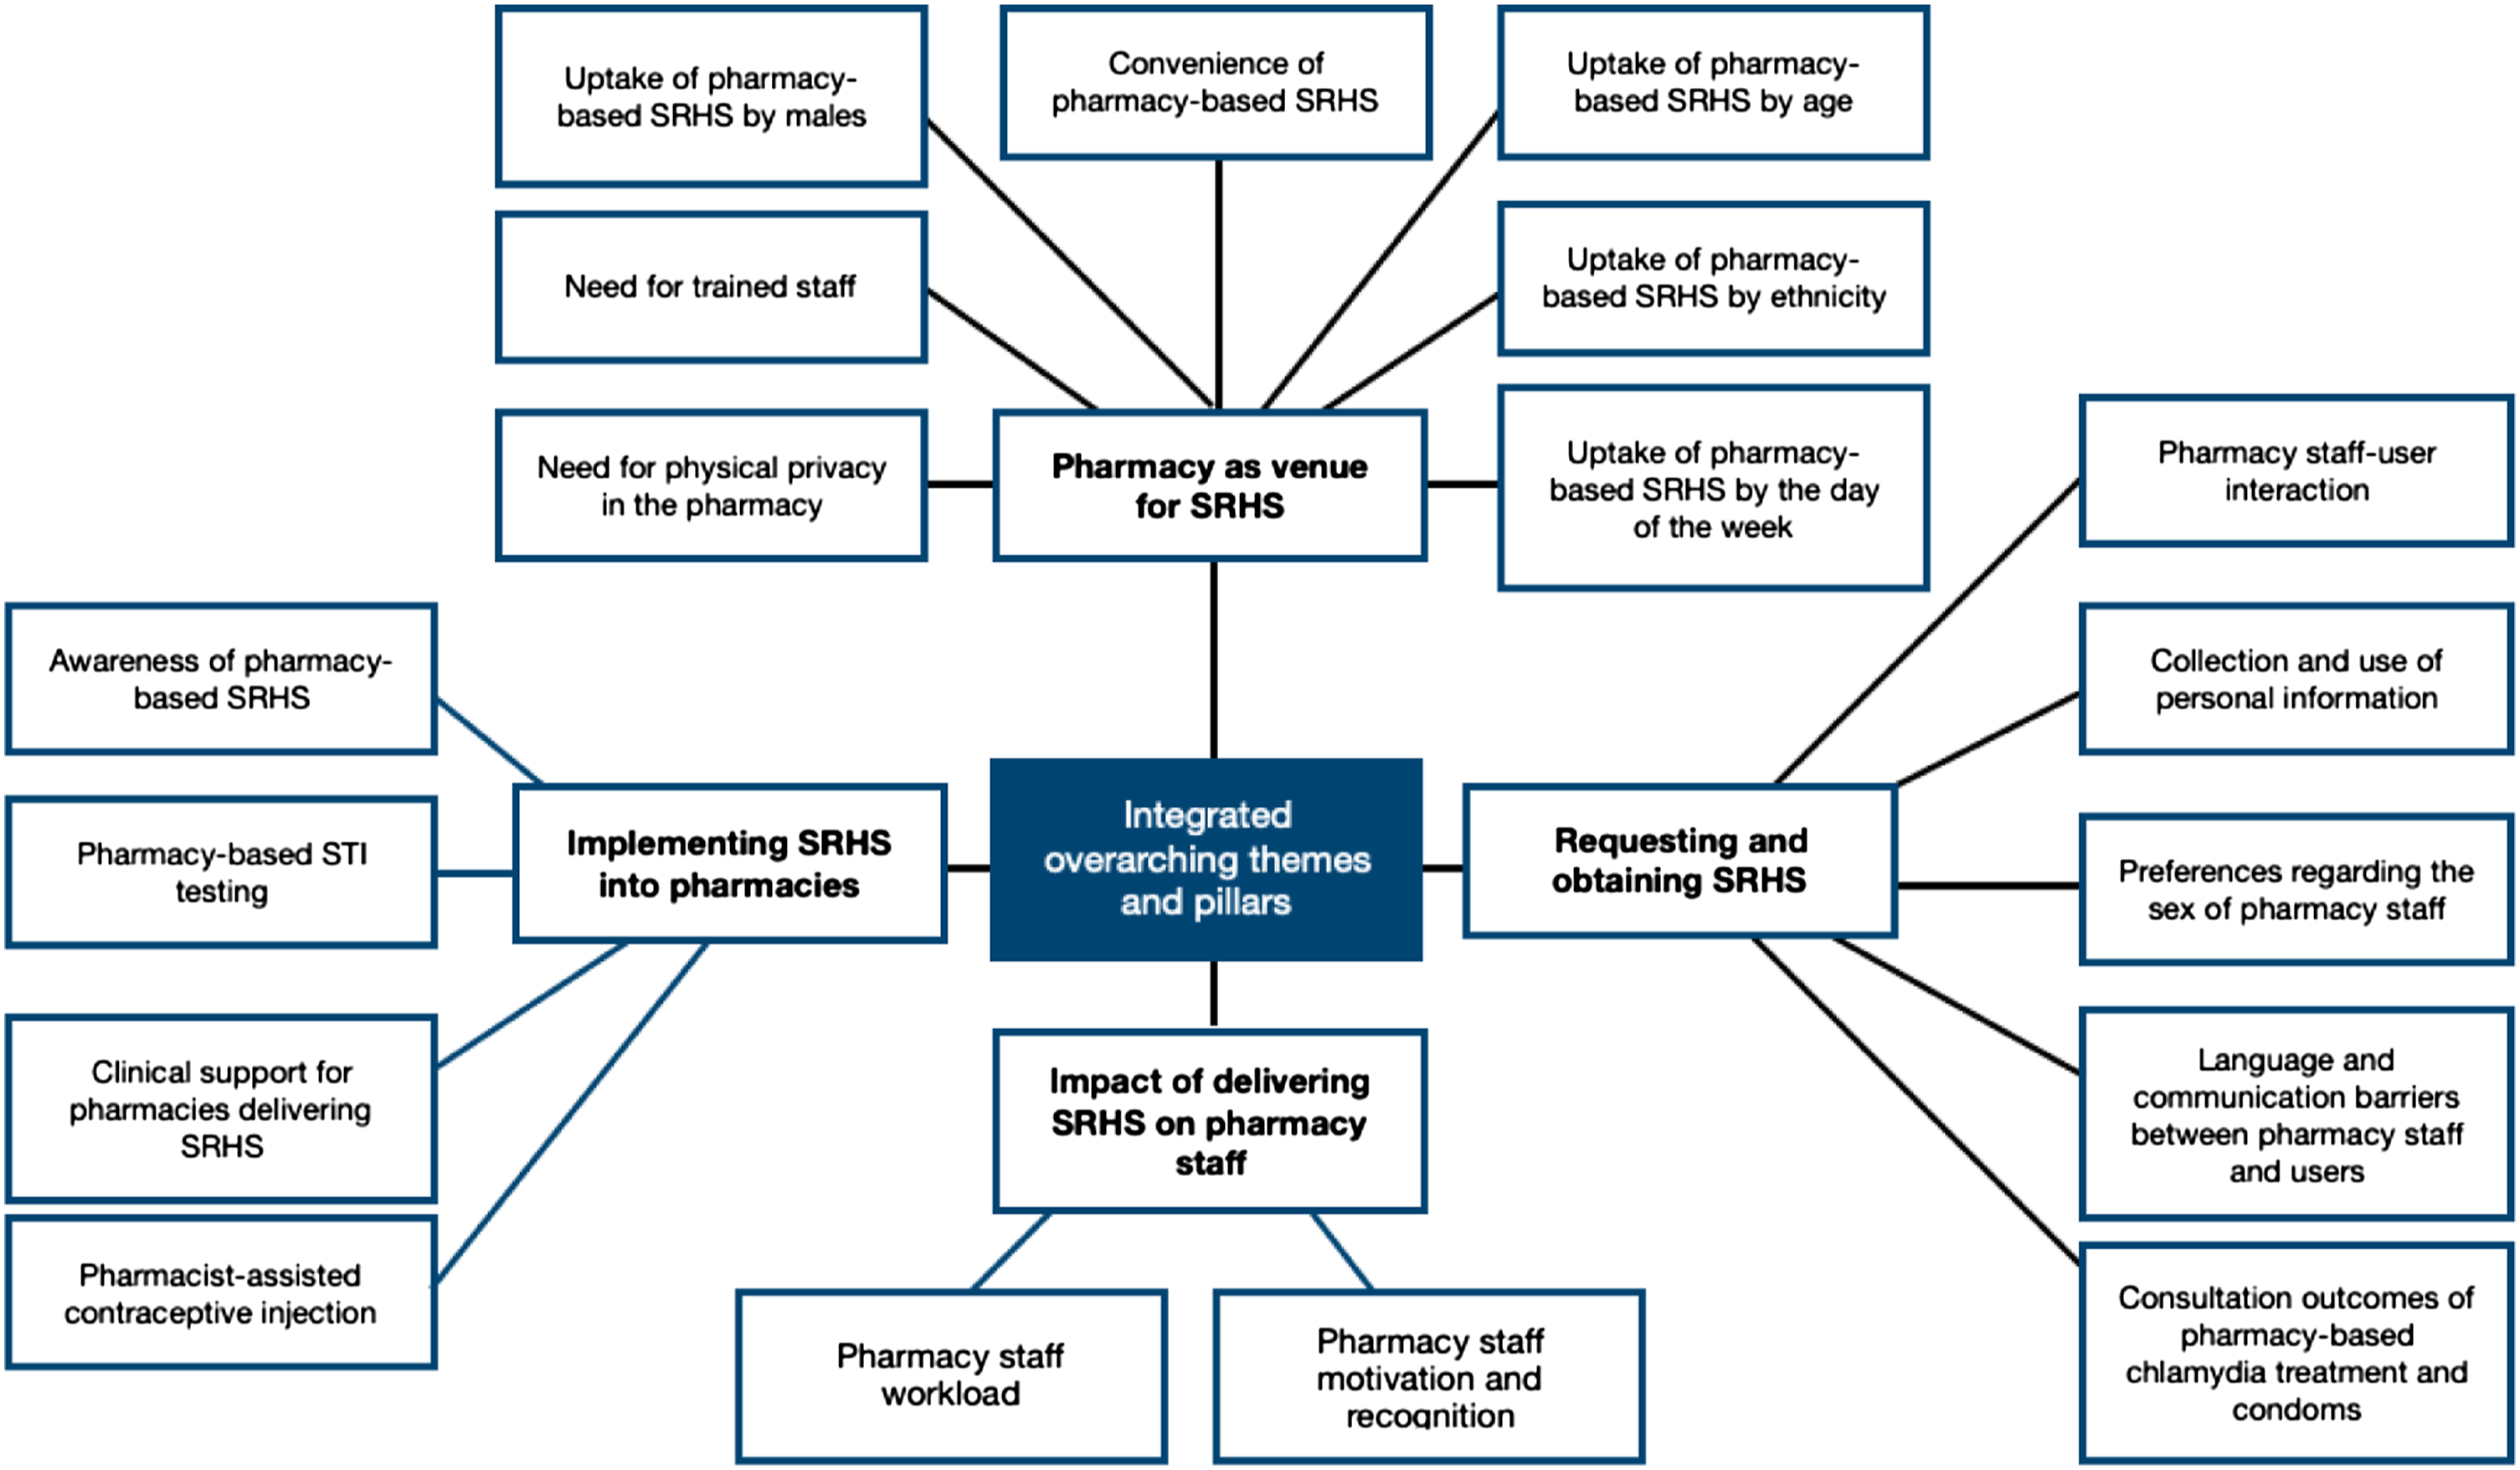
Guidance on the Write Up
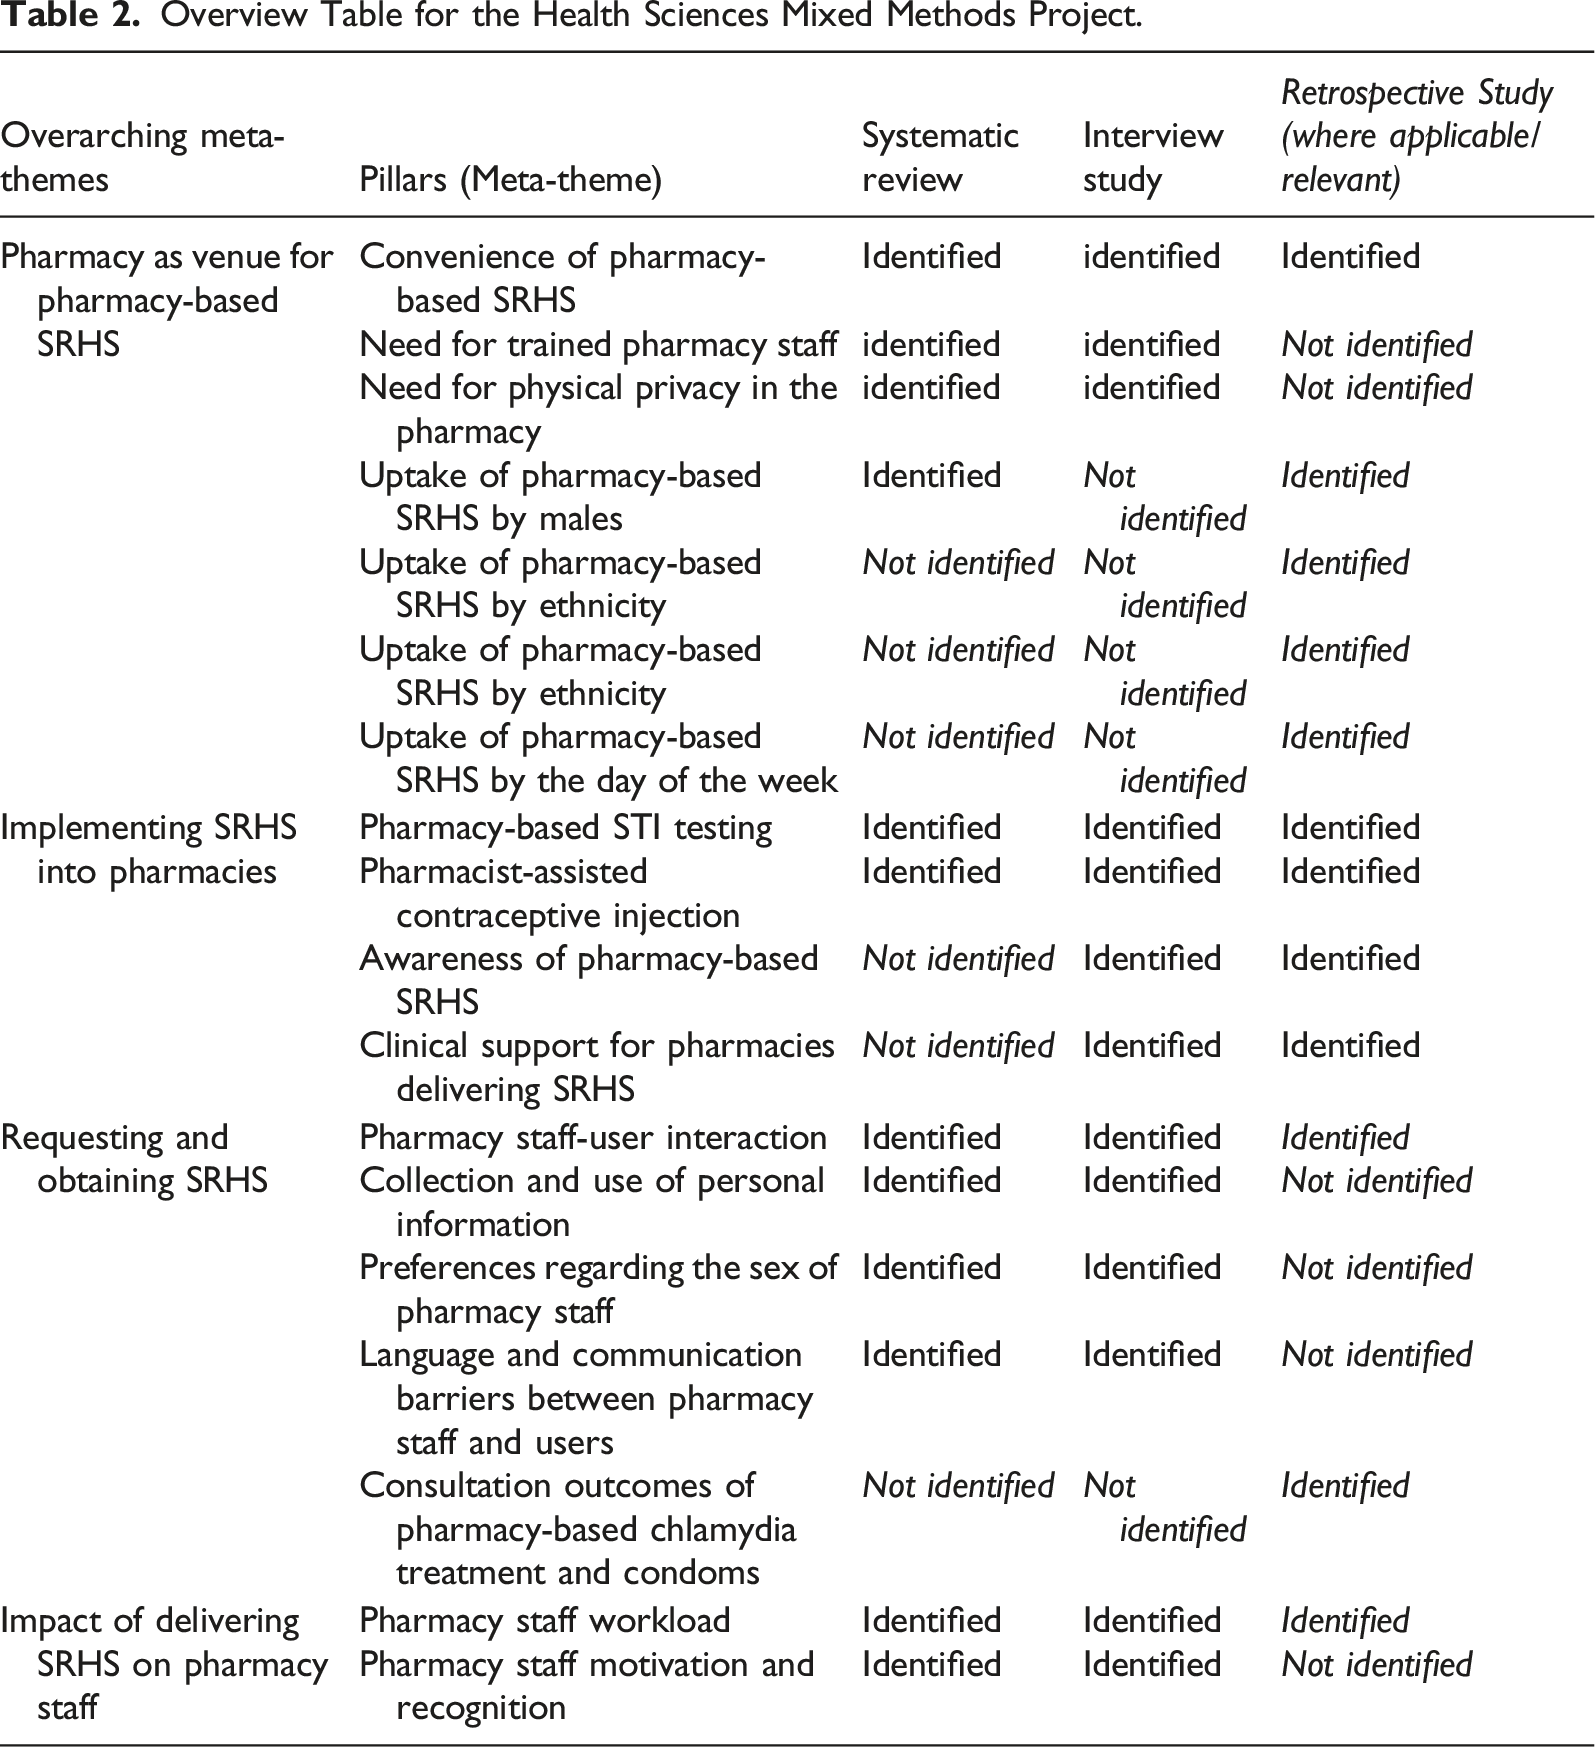
Overview Table for the Health Sciences Mixed Methods Project.
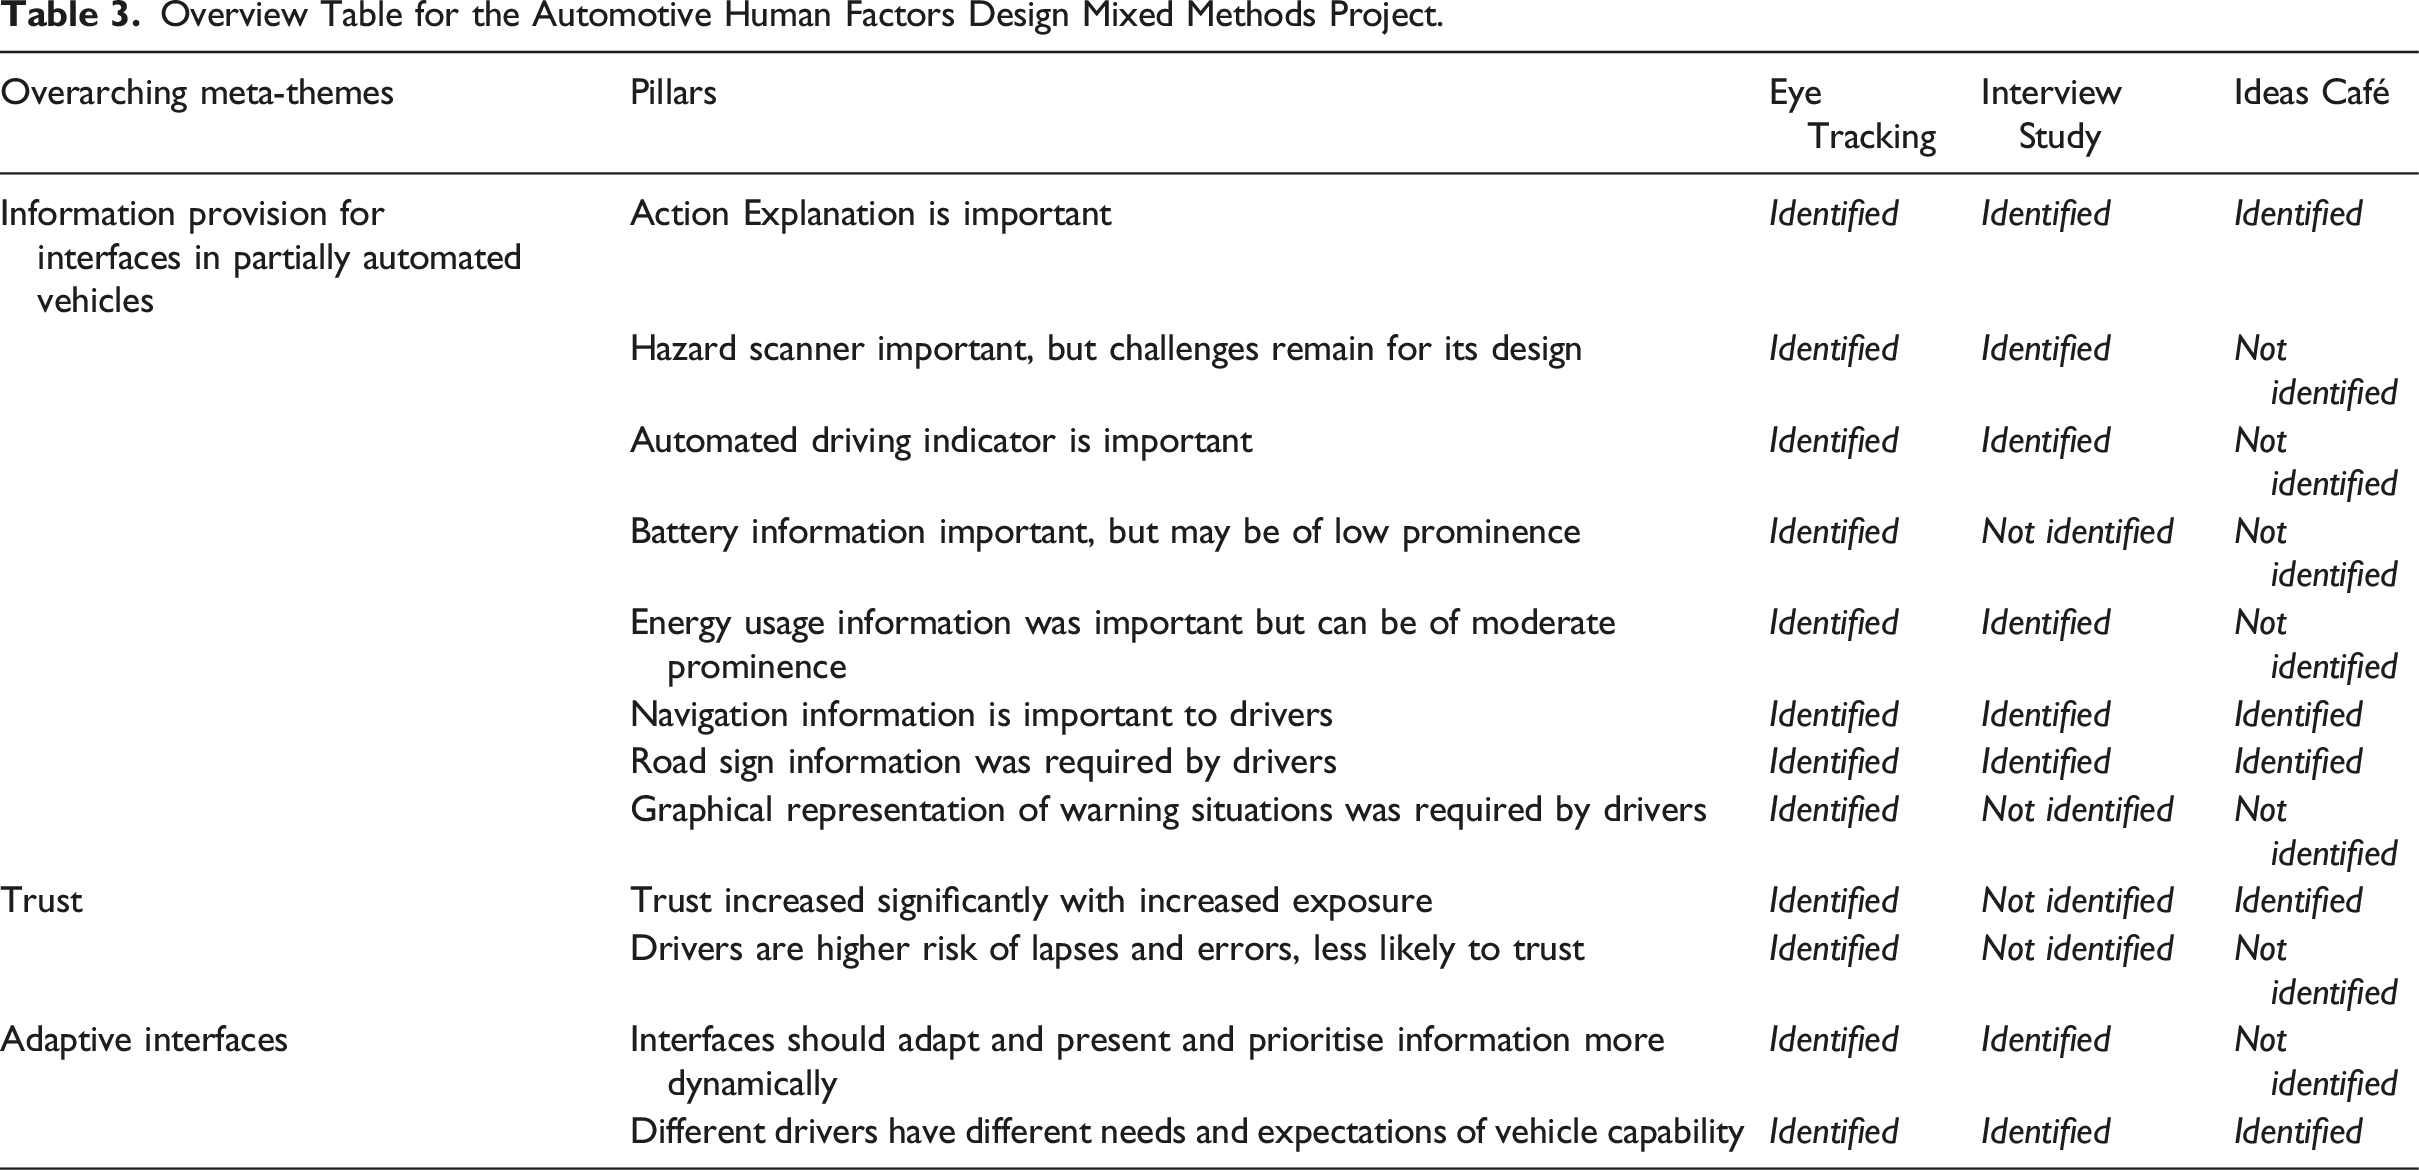
Overview Table for the Automotive Human Factors Design Mixed Methods Project.
Discussion
Contribution to the Field of Mixed Methods Research
It was evident that the existing methods of mixed methods data integration, there were limitations, namely, that they only supported the integration of a maximum of two data sources, did not provide step-by-step guidance and the methods can be cumbersome where much data were to be integrated. There was a need to develop a new method that could address these limitations. We began the design of a new method, based on the existing PIP. Consequently, we evolved the ePIP. Using the data from the Health Sciences project, we adapted the joint display and stages of the original PIP to meet our needs. All enhancements were noted down, justified and iteratively refined through deliberation with our research team. We then tested the applicability to other research disciplines and further refined the ePIP by integrating data from a mixed methods project from Automotive Human Factors Design.
The ePIP offers several methodological contributions compared to previous data integration methods. Firstly, existing integration methods often did not provide transparent, step-by-step methodological guidance on integrating data from more than two data sources. With regards to the original PIP method, this improves upon it and overcomes these limitations which may have inhibited its applicability. Secondly, because the ePIP does not require comprehensive listing of data substantiating the findings, it generates a relatively shorter table which enables the researcher to link findings of data rich studies more easily, limiting the risk that opportunities to synthesise findings are missed. Finally, the ePIP was applied to two existing projects across two disciplines: health sciences and automotive human factors. This provides a practical demonstration of the capability of ePIP to work across different disciplines of research as well as the benefits of integrating more than two quantitative and qualitative data sources. Hence, ePIP allows for plurality in methods across disciplines. To date, no other data integration method has been observed to have the same qualities. Therefore, ePIP can be considered a novel methodological contribution to the field of mixed methods research.
Limitations
We developed the ePIP using data from a mixed methods project and demonstrated its applicability to another discipline on a second example. However, to further validate the transferability of the ePIP, future research should test its applicability on a larger number of research projects.
Another limitation of the ePIP is that it only provides guidance on how to synthesise data from three but not more than three data sources. However, it is likely that some research projects use more than three studies to answer one research question or different but highly linked research questions. While we believe that the ePIP can be further extended to allow for the data integration of more than three data sources by adding additional columns in the same manner as outlined in this article, this needs to be confirmed in future research.
Conclusions
Existing mixed methods literature emphasise the importance of integrating data; however, relatively few well-articulated integration techniques are available. The ePIP is an extension and refinement of the PIP described by Johnson et al. (Johnson et al., 2019). This article described the steps of the ePIP and outlined its methodological contribution. The contributions include amongst others the applicability to integrate data from three different data sources in a transparent and replicable way, the provision of two examples demonstrating the applicability of the method to different disciplines, the addition and revision of stages to allow for greater transparency, validity and consistency.
Supplemental Material
Supplemental Material - The Extended Pillar Integration Process (ePIP): A Data Integration Method Allowing the Systematic Synthesis of Findings From Three Different Sources
Supplemental Material for The Extended Pillar Integration Process (ePIP): A Data Integration Method Allowing the Systematic Synthesis of Findings From Three Different Sources by Julia Gauly, Arun Ulahannan, and Amy L. Grove in Journal of Mixed Methods Research
Abbreviations
Pillar Integration Process
Extended Pillar Integration Process
Footnotes
Acknowledgments
This paper and the studies that comprise the worked examples would not have been possible without the first and second authors’ doctoral supervisors, Dr Helen Atherton, Prof Jonathan Ross, Dr Stewart Birrell and Dr Rebecca Cain, as well as funding from the University Hospitals Birmingham NHS Foundation Trust and Jaguar Land Rover.
Authors’ Contributions
The first author conceived the original idea to develop the Extended Pillar Integration Process and led its development by integrating the data from the Health Sciences mixed methods project. All iterations and changes made to the original Pillar Integration Process and the justification for them were discussed with the second and last author. The second author applied the developed Extended Pillar Integration Process for the integration of the data from the Automotive Human Factor Design project supported by the first and the last author. Any further iterations were discussed between all authors. The first author developed the journal draft and the second and last author reviewed the draft.
Declaration of Conflicting Interests
The author(s) declared no potential conflicts of interest with respect to the research, authorship, and/or publication of this article.
Funding
The author(s) received no financial support for the research, authorship, and/or publication of this article.
Ethics Approval
NHS REC and HRA approval (Rec Reference: 18/SC/0511), in addition to local NHS Trust approval (Ref number: RKK6366), were obtained for the Health Sciences project. Ethical approvals were individually obtained for the eye tracking study (BSREC REGO-2018-2196), interview study (BSREC REGO-2016-1788) and ideas café (Coventry P52764).
Supplemental Material
Supplemental material for this article is available online
References
Supplementary Material
Please find the following supplemental material available below.
For Open Access articles published under a Creative Commons License, all supplemental material carries the same license as the article it is associated with.
For non-Open Access articles published, all supplemental material carries a non-exclusive license, and permission requests for re-use of supplemental material or any part of supplemental material shall be sent directly to the copyright owner as specified in the copyright notice associated with the article.