
Abstract
Machine learning (ML) models are cost-effective tools that can establish a prognosis by considering clinical, genomic, and histological data from breast cancer patients. In this study, we evaluate the performance of 12 ML models in predicting the overall survival of breast cancer patients from “The Cancer Genome Atlas-Breast Cancer” database at 60 months of follow-up. The models evaluated were Logistic Regression (LR), Ridge Classifier (RC), Least Absolute Shrinkage and Selection Operator (LASSO), K-Nearest Neighbors (KNN), Naive Bayes (NB), Linear Discriminant Analysis (LDA), Decision Tree (DT), Multilayer Perceptron (MP), Stochastic Gradient Descent (SGD), Support Vector Machine (SVM), Random Forest (RF), and XGBoost (XGB). The most accurate models were NB (86.76%) and SGD (85.29%). The models with the highest sensitivity were SGD (93.75%), MP (91.67%), and NB (89.89%), while the models with the highest specificity were KNN (95.0%), DT (90.0%), and LASSO (85.0%). The models with the highest area under the ROC curve were LDA (90.83%), LASSO (90.1%), and LR (89.79%). The most relevant variables were “Previous Diagnosis of Cancer,” “Presence of Tumor,” “Ancillary Therapy,” and “Histology.” Our findings demonstrate that AI tools for predicting patient outcomes are a viable option when expensive prognostic genomic tools are not available. According to our results, NB and LASSO show promising performance in predicting the prognosis of breast cancer patients. Further studies with data from developing countries are needed to improve the performance of these tools.
Introduction
According to the World Cancer Observatory (GLOBOCAN), breast cancer (BC) had the highest incidence and mortality among females in 2020. 1 Despite advancements in cancer treatments over the past decade, early-stage cancer diagnosis remains challenging. 2 Diagnostic mammography, one of the primary tools for cancer detection, often suffers from reduced accuracy due to dense breast tissue or poor resolution in early stages of breast cancer, thereby diminishing its efficacy. 3 Additionally, this method does not account for other histopathological characteristics that may identify high-risk patients, 3 such as cell morphology, degree of differentiation, hormone receptor expression, growth factors, clinical stage, and tumor genomic signatures. 4
Recently, the development of artificial intelligence (AI), machine learning (ML), and deep learning (DL) has enabled physicians to enhance their diagnostic and prognostic capabilities for breast cancer. 2 AI, understood as a set of computer-coded programs or algorithms that utilize data analysis and pre-programmed instructions to make predictions and decisions, has demonstrated unprecedented accuracy levels in cancer diagnosis and prognosis. 2 ML, a subset of AI, consists of algorithms designed to automatically learn and improve from experience, allowing for the analysis of a large number of patient characteristics and prediction of survival rates.2,5,6 DL, a subgroup of ML, employs multi-layered neural network algorithms to make predictions and analyze complex information. 7 Consequently, AI, ML, and DL can be invaluable tools in cancer prediction and diagnosis by analyzing pathology profiles, imaging studies, and generating mathematical sequences from medical images to uncover hidden relationships.3,5
In the context of breast cancer, various models based on machine learning,8,9 deep learning, 10 or a combination of both have been explored. 11 The standard evaluation of these models involves two phases: training and testing. Typically, following the training phase, the models are reduced to retain only the highest-performing ones. 11
In this study, we tested 12 different machine learning models to assess their strengths and weaknesses and propose an integrated model. We identified the most relevant variables that contribute to prognosis using artificial intelligence, focusing on the overall survival of breast cancer patients at 60 months of follow-up.
Methods
Data collection
We used the public databases of “The Cancer Genome Atlas-Breast Cancer” from the National Cancer Institute. 12 The data was manually corrected for typos and abbreviations, converting them into analyzable variables. The ML models used were Logistic Regression (LR), Ridge Classifier (RC), Least Absolute Shrinkage and Selection Operator (LASSO), K-nearest Neighbors (KNN), Naive Bayes (NB), Linear Discriminant Analysis (LDA), Decision Tree (DT), Multilayer Perceptron (MP), Stochastic Gradient Descent (SGD), Support Vector Machine (SVM), Random Forest (RF), and XGBoost (XGB).
Inclusion and exclusion criteria
We analyzed cases of patients with at least 60 months of follow-up. Patients with shorter follow-up times or a large amount of missing data were excluded, resulting in a sample of 344 patients. Among these, 250 were alive at 60 months of follow-up, and 94 patients were deceased. The distribution between groups was slightly unbalanced (approximately 2.65:1), so equilibrium techniques between categories were not necessary.
Data preprocessing
Exploratory Data Analysis (EDA) was performed to infer a priori correlations between the variables and the problem case (deceased at 60 months of follow-up). After this analysis, variables with little statistical significance were discarded, leaving 62 variables from the 344 patients, with 20.68% missing data. Factor Analysis of Mixed Data (FAMD) was then performed (Figure 1), revealing that the variance for the alive and deceased subgroups was only 9.94% and 6.97%, respectively; thus, no variables were excluded after this analysis. Variables were encoded for operation: Boolean categorical and ordinal categorical variables were assigned integers, and cardinal categorical variables were converted into dummy variables. Missing data were imputed, with categorical variables assigned the value “indeterminate” and numerical ones “0.0.” Patients with inconsistencies between related variables were excluded, resulting in a final sample of 339 patients, 136 input variables, and 1 output. Factor analysis of mixed data that shows the variance for the alive and deceased subgroups (9.94% vs. 6.97%, respectively).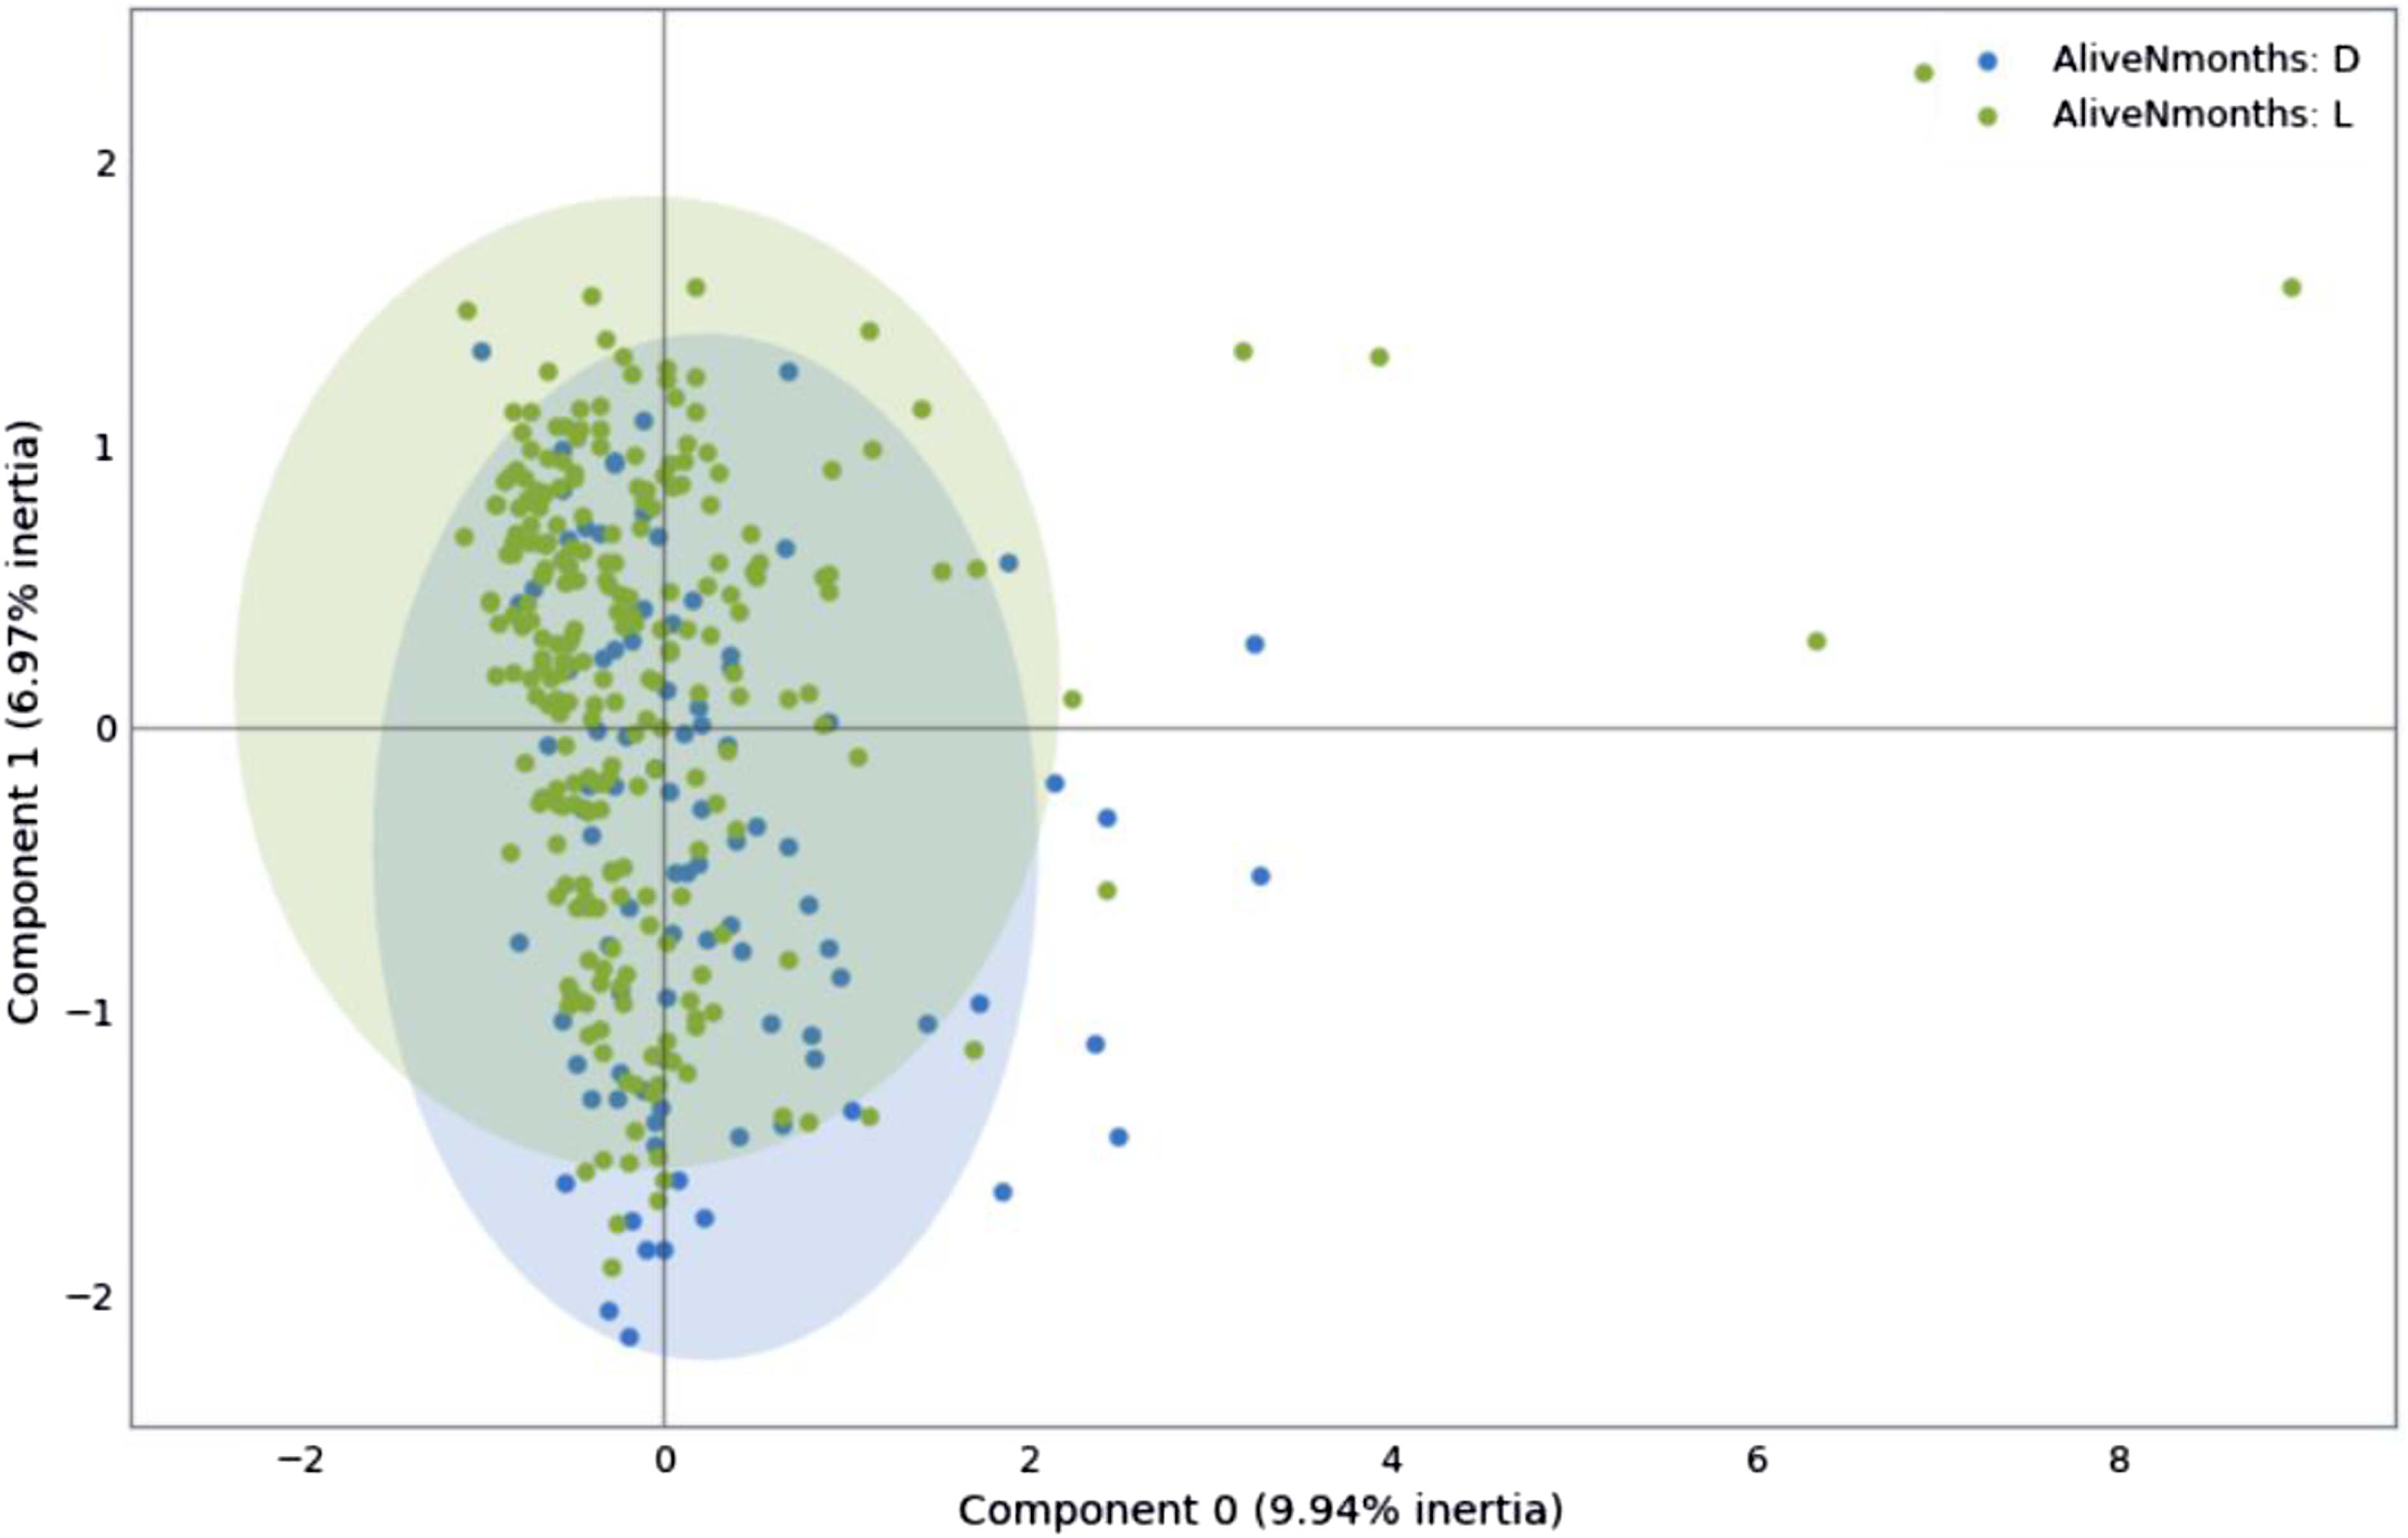
Machine learning models
The supervised learning models used for the analysis were from scikit-learn: LR, Ridge Classifier, LASSO, KNN, NB, LDA, DT, MP, SGD, SVM, and RF, 13 as well as the XGB model. 14
Initial training
The data was divided in an 80/20 proportion for the training and test phases, respectively. Initial training was conducted using the default values of the hyperparameters for each model, with the seed set for random number generation. The first cross-validation consisted of five blocks to evaluate model performance in terms of sensitivity, specificity, accuracy, precision, area under the ROC curve (AUROC), and F value.
Optimization of the models
Hyperparameter optimization was performed through iterative exploration using the GridSearchCV tool from scikit-learn, leveraging the previously obtained block validation to improve model accuracy. The hyperparameters adjusted for each model were: • Logistic Regression (LR): C, solver, max_iter • Ridge Classifier (RC): alpha, solver • Least Absolute Shrinkage and Selection Operator (LASSO): alpha, max_iter • K-nearest Neighbors (KNN): n_neighbors, weights, algorithm • Naive Bayes (NB): var_smoothing • Linear Discriminant Analysis (LDA): solver, shrinkage • Decision Tree (DT): criterion, max_depth, min_samples_split • Multilayer Perceptron (MP): hidden_layer_sizes, activation, solver, max_iter • Stochastic Gradient Descent (SGD): loss, penalty, max_iter • Support Vector Machine (SVM): C, kernel, gamma • Random Forest (RF): n_estimators, max_depth, min_samples_split • XGBoost (XGB): n_estimators, max_depth, learning_rate, subsample
After optimizing the hyperparameters, the models were retrained, selecting the optimal decision threshold based on information from the initial AUROC evaluation, sensitivity, specificity, accuracy, precision, AUROC, and F value. This allowed the elimination of less significant input variables, reducing them from 136 to 31 for the final training which included: • Diagnosis Age • Menopause Status • Race • Prior Cancer Diagnosis • Neoplasm Status • Genome Altered • Mutation Count • TMB • Surgical Margin Status • Surgical Procedures First • Anatomic Subdivision • Invasive Tumor • T Stage • N Stage • M Stage • Primary Lymph Node Assessment • Lymph Node H&E staining • ER Status • PR Status • HER2 Status • Ki-67 Status • Anastrozole Status • Cyclophosphamide Status • Examestane Status • Gemcitabine Status • Letrozole Status • Trastuzumab Status • Vinorelbine Status • Ancillary Treatment Status • Doxorrubicin Status • Paclitaxel Status
Results
The five models with the best performance in terms of accuracy were RC (85.97%), MP (83.02%), SVM (82.65%), LASSO (82.28%), and LR (82.27%).
Model performance scores
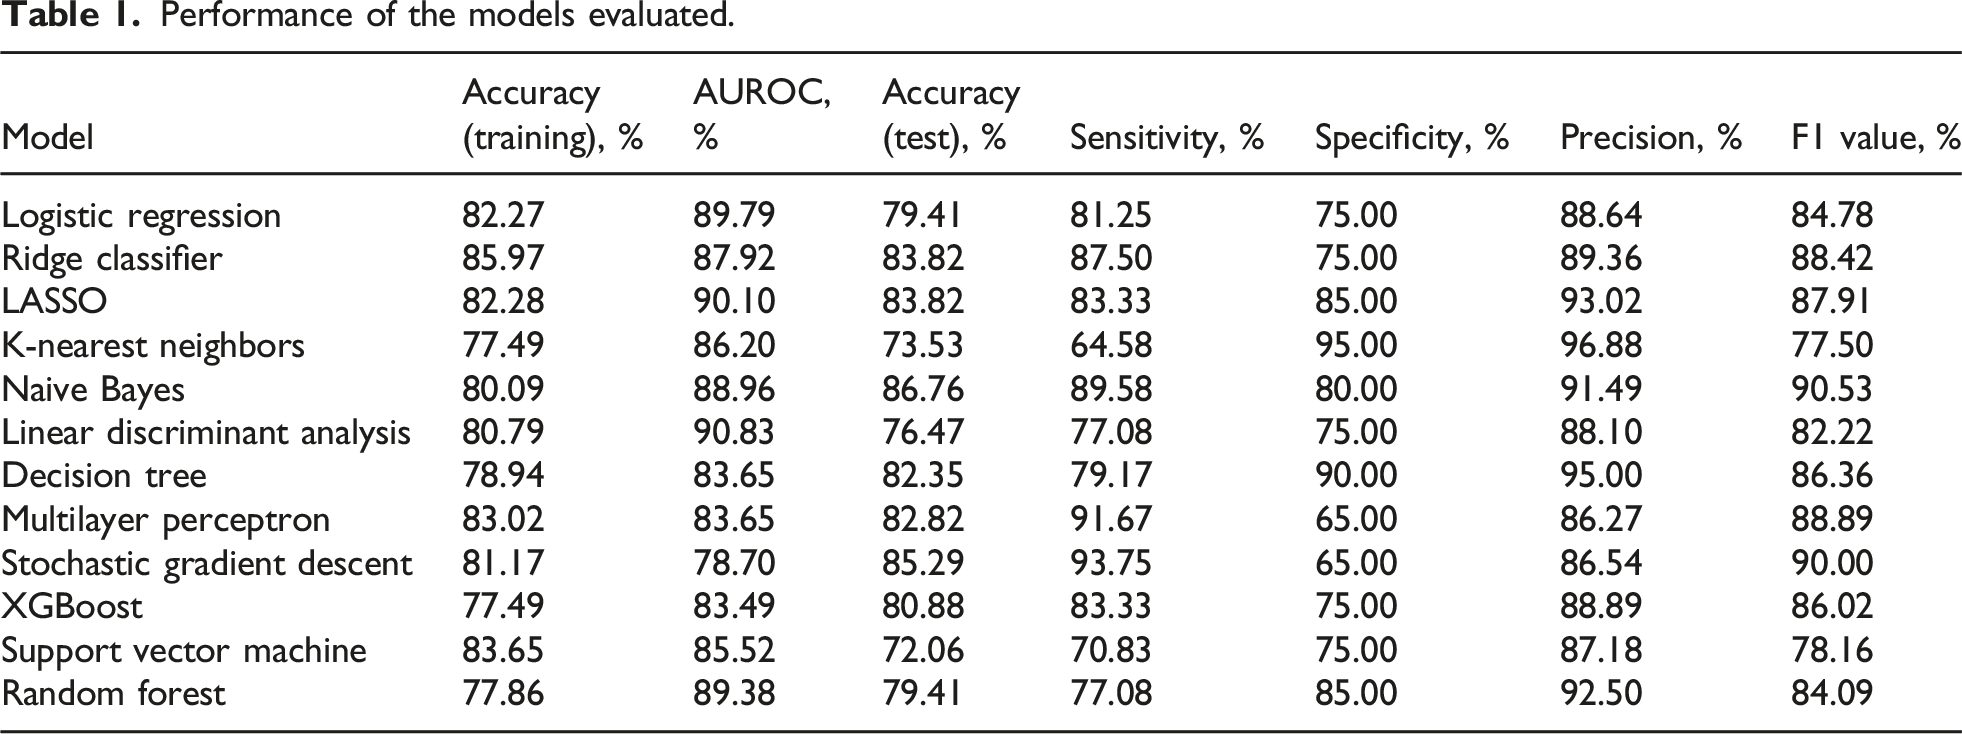
Performance of the models evaluated.
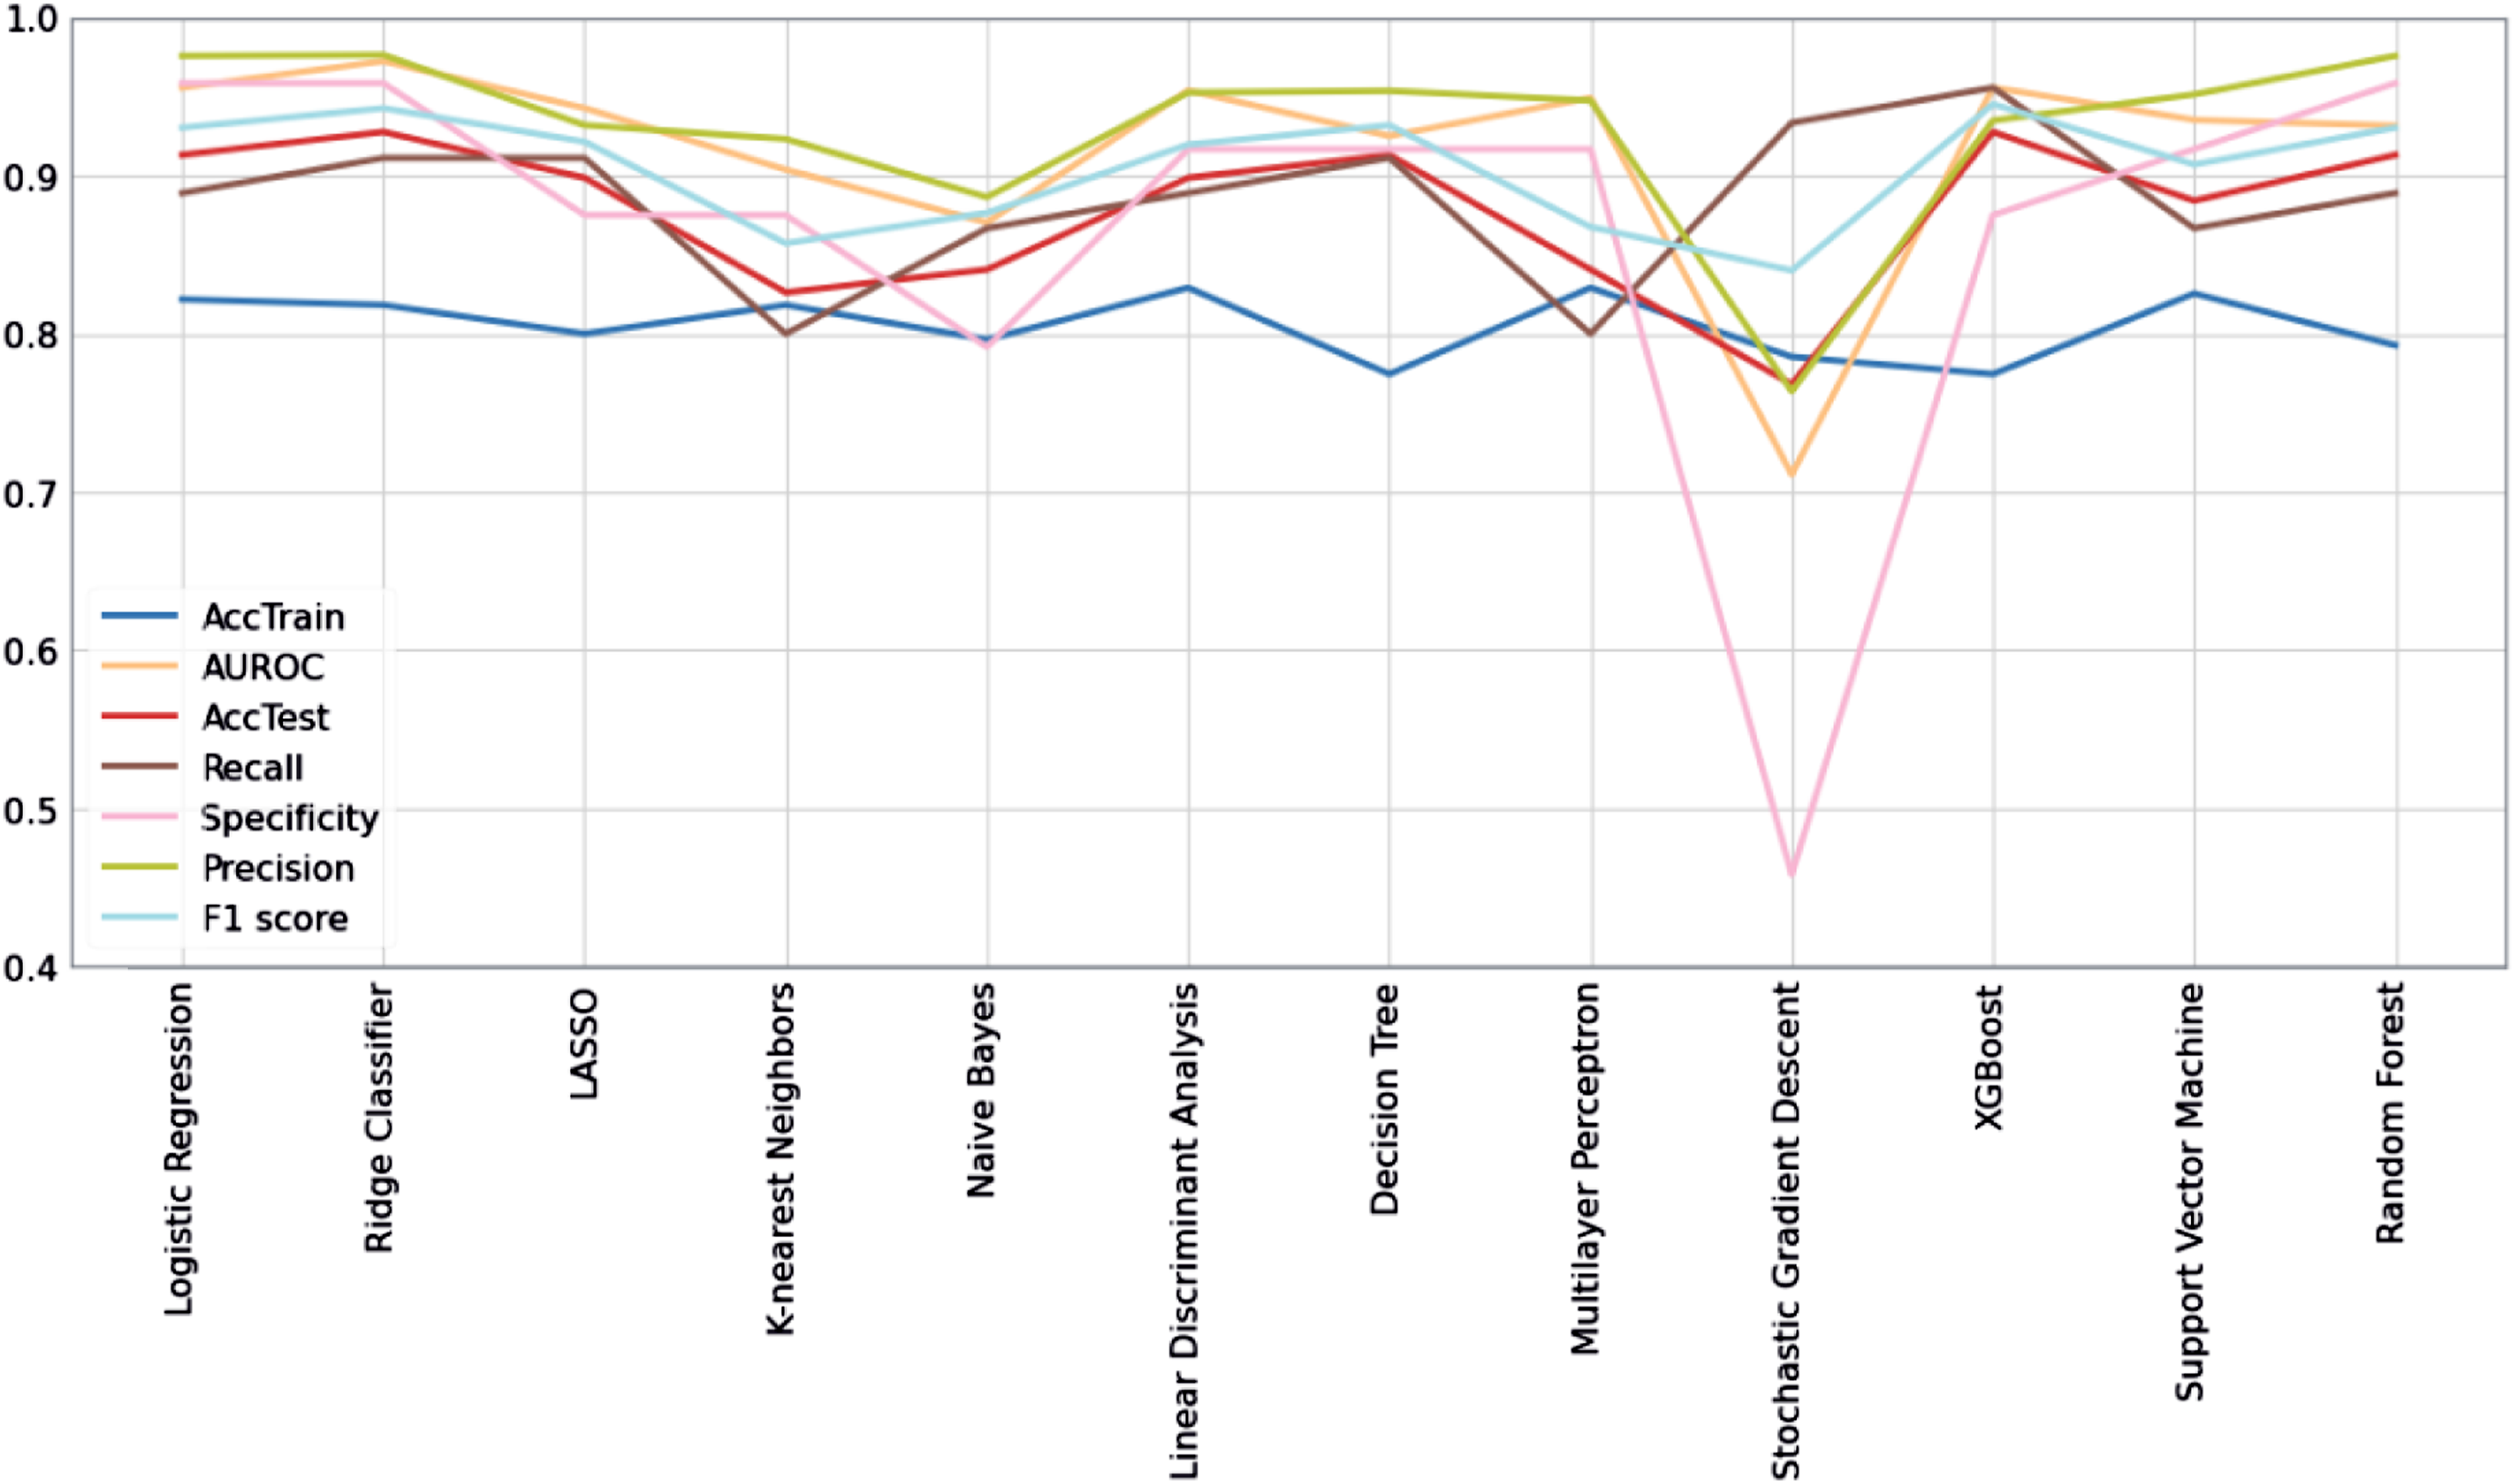
Performance of the models tested.
Variable importance
Principal variables for the models selected.
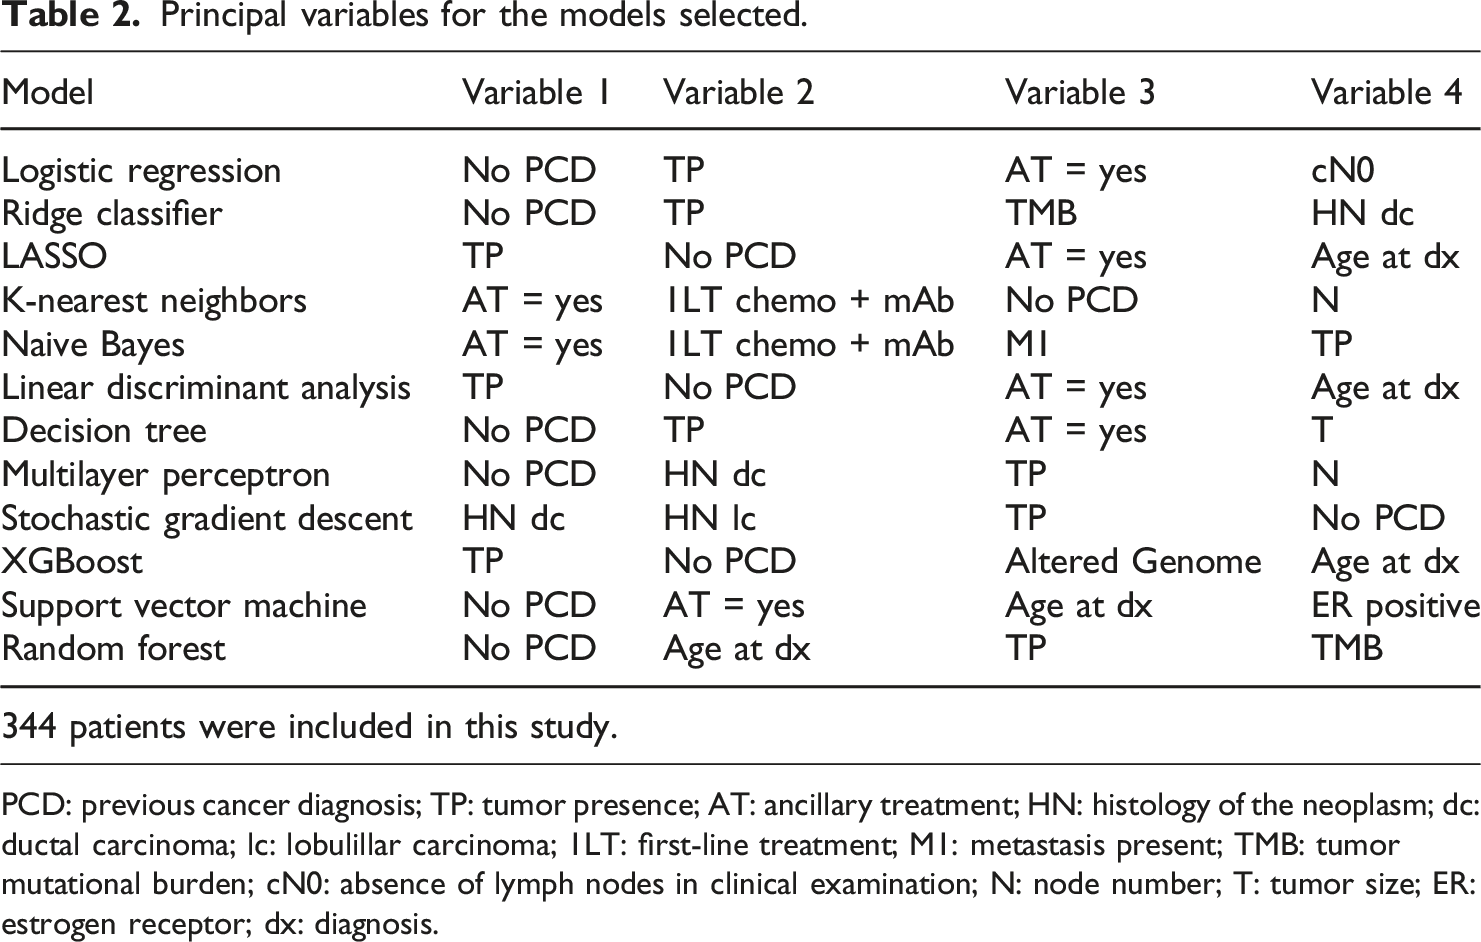
PCD: previous cancer diagnosis; TP: tumor presence; AT: ancillary treatment; HN: histology of the neoplasm; dc: ductal carcinoma; lc: lobulillar carcinoma; 1LT: first-line treatment; M1: metastasis present; TMB: tumor mutational burden; cN0: absence of lymph nodes in clinical examination; N: node number; T: tumor size; ER: estrogen receptor; dx: diagnosis.
Discussion
The use of AI in cancer diagnosis and prognosis, due to its highly predictive value, has expanded into sub-branches such as expert systems, evolutionary computing, fuzzy logic, computer vision, natural language processing, recommendation systems, and machine learning. 2 The value of machine learning lies in its ability to apply algorithms to large datasets to solve specific tasks. Since 1997, and especially over the last decade, various cancers such as prostate cancer, bladder cancer, lung cancer, and breast cancer have been studied using these AI sub-branches. 2 These approaches have demonstrated a remarkable ability to differentiate between malignant, cancerous, and normal tissues. 5
ML analysis is based on metrics such as the receiver operating characteristic (ROC), accuracy, sensitivity, specificity, principal components analysis, and the area under the curve (AUC).2,3 Cancer prediction by ML relies on the algorithm’s ability to classify and predict the course of the disease. Influential data algorithms used as data classifiers include SVM, RF, LR, DT, and KNN. 15 Conversely, the neural network architecture of DL enables models to scale exponentially with the growth of data quantity and dimensionality. 7
Based on accuracy obtained after the training phase, the models selected for the test phase of this study were RC (85.97%), MP (83.02%), SVM (82.65%), LASSO (82.28%), and LR (82.27%). However, in the testing phase, the models with the highest accuracy were NB (86.76%) and SGD (85.29%). The RC, LASSO, and MP models, which tied for third place, only achieved 83.82% accuracy. This indicates that even the best-performing models in training were not the most accurate when exposed to new data, highlighting the importance of evaluating models in new populations if they are to be integrated into daily medical practice. 16
It is useful to compare other evaluated metrics, as different problems may prioritize different aspects. For example, a diagnostic model should focus on having the highest possible specificity (true negative rate), while a screening tool should focus on better sensitivity (true positive rate). 17 Models with the highest sensitivity were SGD (93.75%), MP (91.67%), NB (89.89%), RC (87.50%), and LASSO and XGB (83.33%). In specificity, the best scores were achieved by KNN (95.00%), DT (90.00%), LASSO (85.00%), RF (85.00%), and NB (80.00%). In this study, patients alive at 60 months of follow-up were considered “positive,” and deceased patients were “negative.” Given that the problem evaluated is establishing a useful prognosis to optimize medical treatment and surveillance decisions, both values are of interest and must be improved for application in a real medical context.
Measuring AUROC simplifies sensitivity and specificity into a single metric and is invariant to scalability, making it essential for models intended for large populations. 18 In this study, the best-performing AUROC models were LDA (90.83%), LASSO (90.10%), LR (89.79%), RF (89.38%), and NB (88.96%). Several tests have shown that models with better sensitivity often have lower specificity and vice versa. 19 However, a model for this problem requires a good rate in both aspects. Although an AUROC close to 100% is ideal, the 90% achieved is quite promising given the sample size.
In addition to AUROC, the F value is widely used to evaluate binary classification model performance. In this study, the models with the highest F value were NB (90.53%), SGD (90.00%), MP (88.89%), RC (88.42%), and LASSO (87.91%). Like AUROC, the F value did not present large differences between models. Despite being a preferred metric for calculating model performance, 20 the F value prioritizes positive cases, while the problem in this study requires equal importance for positive and negative cases. Therefore, AUROC is a more useful evaluative parameter.
A previous study compared ML models for predicting breast cancer survival in the Iranian population. 21 They found RF to be the best model with 97% accuracy and 98% AUROC. However, the models were trained with only seven input variables and one output: sex, age, morphology, degree of differentiation, and treatment with surgery, radiotherapy, and/or chemotherapy. This limited variable selection might have led to bias in their results. In contrast, our study analyzed the relative importance of 31 variables, providing a more comprehensive view.
We evaluated the most important variables for each model. “No Previous Cancer Diagnosis” was the most important variable in six models (LR, RC, DT, MP, SVM, and RF) and was among the most important in five others (LASSO, LDA, XGB, KNN, and SGD). This makes sense, as up to 20% of cancer patients have a history of at least one previous cancer. 22 Interestingly, NB, which had the best precision and F value, did not consider this variable highly relevant, possibly due to its independent attribute analysis approach.
“Presence of Tumor: with Tumor” was the most relevant variable for three models (LASSO, LDA, and XGB) and among the most relevant for seven others (LR, RC, DT, MP, SGD, RF, and NB). This variable is associated with increased metastasis risk and decreased survival. 23 Models that did not find this variable relevant (KNN and SVM) had lower precision and F values, suggesting its importance in prognostic models.
Auxiliary therapy, which refers to any non-curative medication associated with cancer therapy, was another relevant variable.24,25 Despite the lack of specific auxiliary therapy details in the TCGA database, its relevance to the models was notable. “Auxiliary Therapy: Yes” was the most important for KNN and NB, and among the most important for SVM, LR, LASSO, LDA, and DT.
“Age at Diagnosis” was not the most relevant for any model but appeared in the top relevance spots for five models (RF, SVM, LASSO, LDA, and XGB). Previous studies suggest higher cancer-related mortality at the extremes of life (under 40 and over 80 years old).26,27 Our analysis indicates that age is a significant variable, particularly for models with high AUROC values.
“Histology of the Neoplasia” was relevant for three models (SGD, MP, and RC). The relationship between histological types and survival has been long studied, 28 but recent evidence suggests no major differences in survival between types. 29
First-line treatment based on chemotherapy with monoclonal antibodies was significant for KNN and NB. This regimen, particularly trastuzumab (Anti-HER2) with doxorubicin and cyclophosphamide, is crucial for patients with HER2-overexpressing tumors lacking hormone receptors (ER, PR). 30 The relevance of this regimen in predictions is notable due to its association with poorer prognosis, second only to triple-negative breast cancer (TNBC). 29
Some key prognostic variables in clinical practice were not as relevant in most models. Molecular patterns, such as hormone receptor status (ER, PR) and HER2 overexpression, are vital for treatment decisions but were not prominently highlighted, likely due to insufficient data in the database. Future studies should analyze these variables more comprehensively. 31
Clinical stage is another critical variable for survival prediction. 32 Advanced stages are associated with worse prognosis. 33 Our study found “T,” “N,” and “M” variables relevant for some models, with NB being the only model to consider “M,” the variable separating advanced from early stages.
The main limitations of this study were the missing data in the database and the small sample size. Although preprocessing eliminated variables with the most missing values, this issue cannot be entirely ignored.34,35 Small samples may not be representative of the population, leading to biases. 36 Retraining models with data from the target population and using multicenter study information can mitigate these issues. AI has its own limitations, such as data privacy concerns and the need for high-quality databases. Proper data normalization and handling complexity are crucial for effective ML models. 5
Although finding the best model for prediction is the goal, using multiple models can provide a better understanding of the problem. It is not feasible to use many models simultaneously; the best-performing ones should be selected. Our results suggest NB and LASSO as promising models for assessing patient prognosis.
Once the problem is defined, the optimal metric for model optimization must be chosen. We propose AUROC as the best metric for predictive forecast models. Different problems might require different metrics, such as sensitivity or specificity. Therefore, health tech development teams should include medical experts to guide and monitor the process, ensuring consistency with medical knowledge.
Integrating these technologies into daily medical practice is challenging. Many studies of applied models in oncology carry a high risk of bias. 37 Using information from multicenter studies can provide a starting point for predictions and help visualize global trends in patients. Clinician data collection tools can organize patient information, facilitating database creation and ongoing model retraining. This approach reduces reliance on public databases with missing information or single-center registries and provides real-time feedback to medical practice.
Conclusion
The use of machine learning models in breast cancer patients has been proposed as a novel technique to improve prognosis. In our study, NB and LASSO demonstrated good performance in determining the status of breast cancer patients. The most relevant variables in the analysis were “Previous Diagnosis of Cancer” and “Tumor Presence.” The metric that best evaluates the performance of prediction models for patient prognosis, and that should be used to optimize such models, is AUROC. To implement these technologies in medical practice, it would be beneficial to use a tool for information collection by physicians. This tool should capture not only the initial conditions of the patient but also their evolution over time.
Footnotes
Author contributions
Declaration of conflicting interests
The authors declared no potential conflicts of interest with respect to the research, authorship, and/or publication of this article.
Funding
The authors received no financial support for the research, authorship, and/or publication of this article.