
Abstract
Using the Health and Retirement Study (HRS), this article explores the association between military service and mortality among American men over age 50 between 1992 and 2020. Cox regressions show veterans who served during wartime have consistently higher mortality than nonveterans across major conflicts of the 20th century. Peacetime service does not increase mortality significantly, but Hispanic peacetime veterans have lower mortality than other Hispanic veterans and nonveterans. Using a much larger set of survey data than has been used previously, the findings here reveal a different age profile than found in some previous research. In particular, the 50s and 60s are particularly sensitive life stages for wartime veterans, especially for the Vietnam-era veterans. Finally, this analysis suggests some potential health benefits from military service—even in wartime—but, on balance, the negative consequences of warmaking are stronger and extend well into later life.
Keywords
Introduction
The purpose of this study is to assess the long-term mortality risks associated with veteran status in the United States, demonstrating how these risks arise from both military exposures and broader behaviors related to men’s health. A basic illustration of the complexity of this question can be seen in Table 1, which highlights two sets of mortality estimates published in recent years using U.S. government data on veterans and vital statistics. Panel A is from the National Center for Veterans Analysis and Statistics (NCVAS, 2017) and uses data from the US Veterans Eligibility Trends and Statistics (USVETS), which includes government and commercial data. Panel B comes from a very recent study by Sullivan-Baca and colleagues (2023) that uses data from the Veterans Health Administration. Both studies use age-specific mortality standardized to U.S. vital statistics data to compare mortality between veterans and nonveterans. And while both data sources have limitations, both are very large datasets striving to comprehensively capture the population of U.S. veterans.
Published Standardized Mortality Rate for U.S. Veterans.
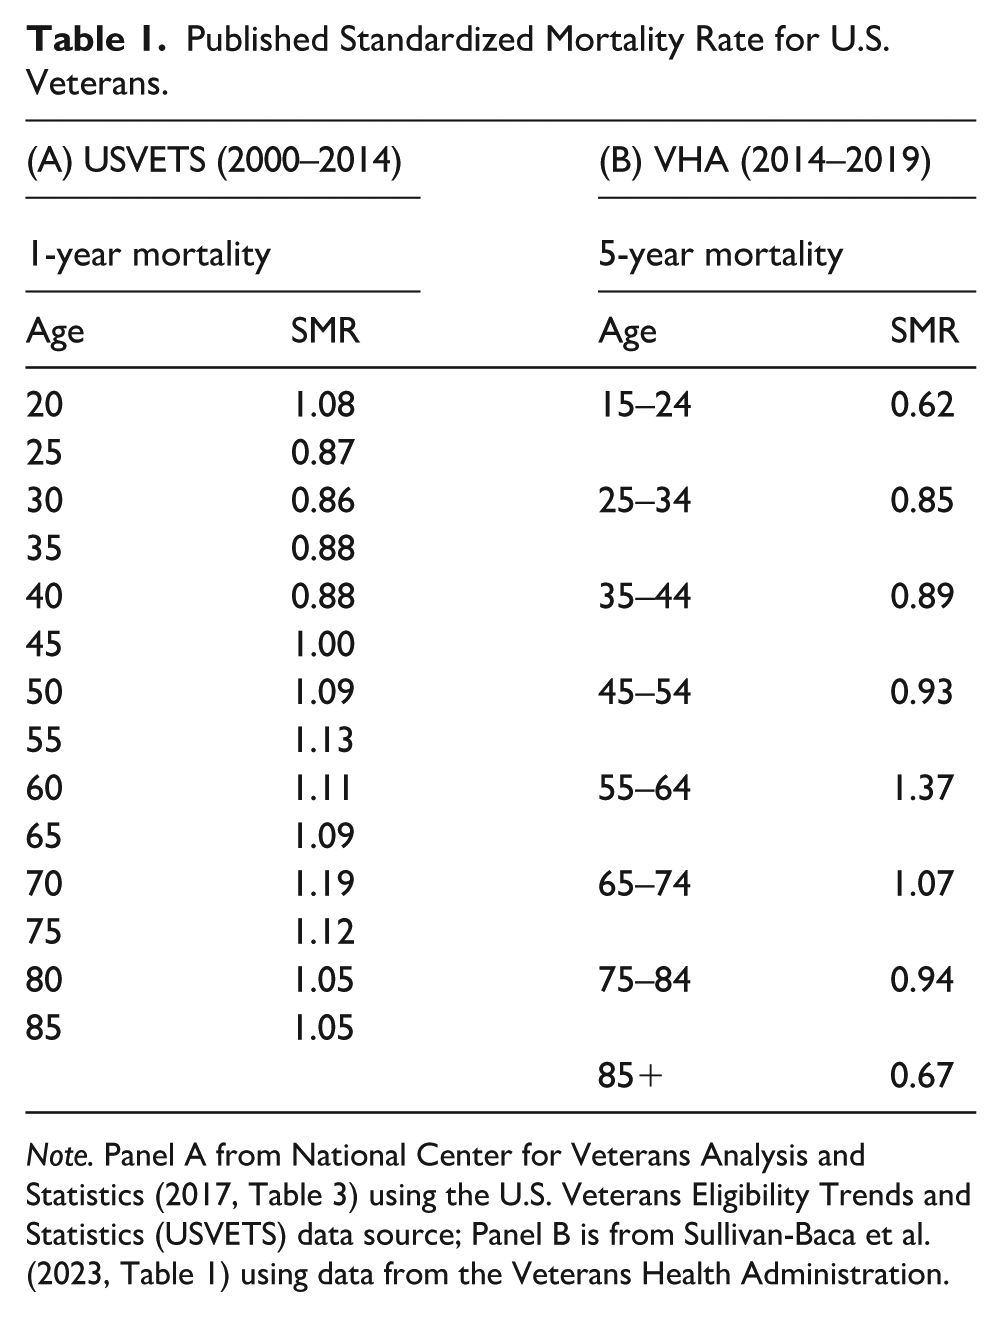
Note. Panel A from National Center for Veterans Analysis and Statistics (2017, Table 3) using the U.S. Veterans Eligibility Trends and Statistics (USVETS) data source; Panel B is from Sullivan-Baca et al. (2023, Table 1) using data from the Veterans Health Administration.
Both studies find that veterans, in general, have a mortality advantage over nonveterans, but they also show patterns that vary significantly by age. Both sets of estimates show that young adult veterans face a significant mortality advantage but that advantage dissolves near mid-life and transitions to a mortality disadvantage in the 50s and 60s. In later ages, the trend in relative advantage reverses course again, moving toward parity in the USVETS data and actually dropping well below parity at older ages in the VHA data. The timing in the life course in which the trends peak and reverse direction differs between the two studies, but both are characterized by a hill-shaped age profile.
Although the studies cited in Table 1 find very similar patterns for female veterans, military service in the 20th-century United States was overwhelmingly male. In WWII, for instance, only about 2% of service personnel were female (The National WWII Museum, 2025). Therefore, the health and mortality experiences of U.S. veterans is predominantly a men’s health issue. Courtenay (2000) argued that men’s poorer health outcomes are strongly shaped by cultural constructions of masculinity, which encourage risk-taking, stoicism, and avoidance of help-seeking as demonstrations of toughness and self-reliance and that these constructions are influenced by social institutions such as the military, corporations, and the justice system. Similarly, a systematic review by Mokhwelepa and Sumbane (2025) finds that traditional masculinity norms consistently deter men from seeking mental health support.
In many ways, military service may reinforce the constructions of masculinity that can erode men’s health and lead to earlier death; it both selects men who embrace these norms and reinforces them through institutional culture that valorizes toughness, sacrifice, and endurance. Such reinforcement is particularly likely to take the form of avoiding help-seeking. Silvestrini and Chen (2023) show that military veterans with posttraumatic stress disorder (PTSD) often view help-seeking as a sign of weakness, reflecting the military’s reinforcement of masculine ideals. Neilson and colleagues (2020) conduct a systematic review of the literature on PTSD among veterans and conclude that the emotional stoicism associated with traditional masculinity ideology leads to greater PTSD severity and difficulty with functioning.
The mortality ratios in Table 1 do not include controls for other important demographic factors, such as race, ethnicity, family background, education or socioeconomic status (SES), nor do they account for how veterans of a given age will have had very different experiences based on their birth cohort, including the nature of military conflicts that occurred. Yet the trends in the table still suggest an interplay of underlying forces that change over the life course. In early adulthood, we see a mortality advantage for veterans, certainly because unhealthy recruits are screened out of the military and possibly because healthier individuals are more likely to enlist in the first place. This selection into the military results in an extensively documented (see below) “healthy soldier effect,” which persists, at least for a while, after the soldiers leave the military.
Little controversy exists regarding how selection creates soldiers that are, on average, healthier than their civilian peers. But what happens after this initial selection? Military service—especially during wartime—contains risks that can significantly damage physical and mental health, sometimes for years to come. With age, negative health characteristics associated with prior military service become dominant, possibly because frail individuals die off in the nonveteran population (Liu et al., 2005), which is thought to lead to the “cross-over” in which the mortality risk for veterans switches from an advantage to a disadvantage.
Military service may also endow veterans with fortifying characteristics that reduce mortality risk. Veterans have received access to educational benefits through the GI Bill and other programs, and many veterans receive subsidized health care through the Veterans Administration. Furthermore, military service is a highly social activity, and veterans accumulate social capital that has positive health benefits.
Thus, three competing forces shape the mortality risk factors for veterans as they age compared with nonveterans. The first is that positive effect of selection into and out of military service. The second is a negative effect associated with both mental and physical health conditions that originate in service that raise mortality risk in later life. The third is that veterans are fortified by social programs and social networks resulting from military service that may reduce mortality risks. Wilmoth et al. (2019) refer to these latter two effects as the “military hazard effect” and the “military capital effect,” respectively. Empirically, these forces may be significant but difficult to identify because they may cancel each other out at both an individual and population level.
Close to two decades ago, two studies (Liu et al., 2005; London & Wilmoth, 2006) used the early HRS and the AHEAD (“Asset and Health Dynamics among the Oldest-Old”) cohorts to study veteran status and mortality. In 1998, the two cohorts were combined into one and a new cohort was sampled. The HRS/AHEAD study (hereafter, simply HRS) has added a new sample cohort every 6 years. My general conclusion using the HRS is not dissimilar to these early studies. Even though soldiers and young veterans are initially much healthier than civilians because of self-selection and health screening into the military, those veterans who served in wartime have significantly higher mortality in later life than nonveterans. This finding holds true for the WW2, Korean and (especially) Vietnam cohorts in the HRS. I also find, contrary to some of prominent research, that this effect is particularly potent at ages 50–69 (especially, again, for Vietnam veterans). If true, this analysis suggests a possible link to the “deaths of despair” that have received significant attention in recent years (e.g., Case & Deaton, 2015; Katz et al., 2020).
Literature Review
The Healthy Soldier Effect in Veteran Populations
Although the focus of this study is veteran mortality at older ages, it is useful to begin [REV: by noting] the documentation of the healthy soldier effect. Rothberg and colleagues (1990) compared the mortality of the entire U.S. army with the mortality of the U.S. population and found that all-cause mortality for male soldiers was only half the rate for the general population and about one-quarter the rate for disease-related mortality. In addition, the SMR for all-cause mortality among Black soldiers was less than half the ratio for Whites. Their study, however, reflected peacetime mortality rather than conditions of major conflict, so it did not capture the effects of war.
The study by Kang and Bullman (1996) found that the entire population of Persian Gulf War veterans had about 9% higher mortality than a control group of soldiers who were not deployed to the Gulf. Both groups of male veterans had less than half the standardized all-cause mortality of the civilian population. Together, these two comprehensive studies established the mortality advantage of soldiers and recent veterans compared with civilians and highlighted two important features: racial differences and the contrast between combat and noncombat service.
These two studies became part of a meta-analysis conducted by McLaughlin and colleagues (2008). Their analysis included data from 12 studies and found an SMR of 0.78 for veterans deployed to a conflict arena and 0.73 for other veterans. While their sample covered diverse populations and time periods across several countries, it was not representative of the U.S. (or any single) population.
U.S. Survey Data of Older Americans
Nationally representative survey data allow researchers to control for variables not captured in the studies summarized in Table 1. Liu et al. (2005), using a Weibull hazard model on the AHEAD cohort (age 70+ in 1993), found that veterans at age 70 had a slight mortality disadvantage that grew by age 85. They hypothesize that a mortality cross-over occurs at around age 70, although the AHEAD cohort does not include younger ages. London and Wilmoth (2006), analyzing both the original HRS and AHEAD cohorts, similarly found “very little evidence to support the notion that any mortality benefits accrue to men as a consequence of military service overall or enlistment at any particular age (p. 135).” They also report that Black veterans have marginally lower mortality than Black nonveterans, echoing Rothberg et al. (1990).
Using the National Health Interview Study (NHIS) linked to national mortality data, Landes et al. (2017) found that among men who turned 18 in nonwar eras, veterans experienced a mortality advantage in early life and a disadvantage later in life, with stronger effects for Black veterans. For men reaching adulthood in war eras, they found no significant veteran/nonveteran differences—contrasting with earlier studies that showed strong wartime effects. Sheehan and Haward (2019) argue that the Black/White mortality gap is larger for nonveterans than for veterans, due to higher SES among Black veterans. Landes et al. (2018) add that the mortality disadvantage is most pronounced among veterans who rely on VA health care.
Landes and Piazza (2023) summarize survey-based research as “consistently pointing to a veteran mortality disadvantage” (p. 907). They highlight a similar age cross-over to that suggested by Liu et al. (2005), with an estimated point at age 73. However, their use of a relatively small MIDUS sample (N = 2,024) required constraining predicted probabilities of death (ages 40–90) to a linear specification, limiting their ability to test potential nonlinear interactions between age and veteran status.
Military Hazard and Military Capital
In their review of the literature on veterans’ health, Wilmoth et al. (2019) highlight the heterogeneity in the offsetting effects of military hazard and military capital. They conclude that older veterans not “substantially harmed during military service” (p. 23) generally have health as good as or better than nonveterans, but those who served in combat theaters face worse health and higher mortality. Maclean and Edwards (2017) similarly found that combat veterans surveyed in the HRS are less healthy than both nonveterans and noncombat veterans. A meta-analysis of 11 studies by Williamson and colleagues (2018) partially counters the cultural narrative of veterans’ poor mental health, showing that while veterans have higher prevalence of alcohol and substance abuse, they do not have higher prevalence of mental health disorders, including PTSD and depression.
By contrast, the positive effects of military capital have received less scholarly attention. Educational attainment is a strong predictor of mortality, but disentangling the relationship between military service and education remains difficult, even though the GI Bill is often credited with expanding educational opportunities. Xie (1992) found higher education levels among veterans, and Angrist and Chen (2011) used the draft lottery as an instrument to identify a causal effect of Vietnam service on higher educational attainment, though not on income.
Social capital obtained through military service may also influence mortality. Wilson and Ruger (2021) showed that veterans participate in civic groups at higher rates than nonveterans, including but not limited to veteran organizations. Looking further back, Costa et al. (2018) found that U.S. Civil War veterans often co-located with men from the same companies, even decades after the war. Veterans who lived near fellow veterans had significantly lower mortality risk than those who did not co-locate, demonstrating long-term health effects of social capital.
Endogeneity of Military Service
Just as the medical screening that eliminates unhealthy recruits from military service leads to the healthy soldier effect, self-selection into the military may be correlated with nonrandom factors (such as an inclination to engage in risky or unhealthy behaviors) that directly affect mortality in later life. This endogeneity has been explored using the Vietnam draft lottery which was determined by birth date. An early study by Hearst et al. (1986) used deaths in California and Pennsylvania and found that draft-eligible men had a higher mortality than those who were not draft-eligible. But in a more recent and much larger study of all deaths in the United States between 1989 and 2002, Conley and Heerwig (2012) found that draft exposure through the lottery was not associated with higher mortality.
These studies were limited in two important ways, however. First, both were limited to Vietnam veterans born between 1950 and 1952 and therefore could say nothing about mortality after age 52—which is essentially the point in the life course where our analysis begins. Second, neither study had information on whether the individuals actually served in the military, thus limiting the conclusions to those who were merely draft-eligible (in causal-inference terms, the “intent to treat effect”).
Research Design
Approach
This study is a prospective cohort analysis using data from the HRS, 1992–2020. The HRS enrolls nationally representative cohorts of Americans over age 50 and follows them biennially until death or censoring. Mortality is determined through exit interviews with next of king and National Death Index searches. I use Cox proportional hazards models (Cox, 1972), following precendents in veteran mortality research (e.g., Liu et al., 2005). To estimate hazard ratios for veteran status. Statistical significance is reported using exact p-values, and statistical tests are assessed at the 95% significance level. Because this study uses de-identified public data, it is exempt from Institutional Review Board review under U.S. federal guidelines.
Data Source
The HRS began in 1992 with a random sample of individuals born between 1931 and 1941. In 1998 it merged with AHEAD (a study begun in 1993 of Americans aged 70 and over). In 1998, 2004, 2010, and 2016, the combined study added a new age cohort to refresh the sample and weights are derived to make it representative of the population 50 and older. HRS undertakes detailed follow-up on all observations who were not present for the interview to determine date of death for respondents who die between survey waves and oversamples Blacks and Hispanics.
This study uses the harmonized version of the data created by RAND and uses data through the 2020 wave, though the 2020 wave is used only to obtain the date of death for respondents who died between the 2018 and 2020 survey waves. The main analysis sample used here has 17,852 men for a total of 95,971 observations (person-waves); 6,066 respondents die prior to the 2020 survey wave.
Measures
The dependent variable in this study is age at death. In the HRS, this variable is limited because some survey respondents are lost to follow-up and, of course, because many respondents are still alive. Date of death is determined either through exit interviews with surviving next of kin or through searching in the national death index. The RAND file contains only the month and year of birth and death, thus the exact age at death is measured with some imprecision and with some loss of observations.
Veteran status is present in each wave of data in the RAND file. Dates of service, however, are not in the RAND file but are taken directly from the HRS files for each wave. Combat experience was not captured until 2008 and is not consistently measured across the survey waves, so is not used in this analysis. Based on the findings of previous research, I divide veterans into two groups: those whose service overlaps a period of conflict and those serving entirely outside of those years. The conflict dates used here are 1917–1918 (WW1), 1941–1945 (WW2), 1950–1953 (Korea), 1964–1973 (Vietnam), and 1991 (Gulf War).
Demographic controls include marital status, a time-varying indicator of whether the respondent is married at the time of interview, and race/ethnicity. Respondents are asked their race and whether they identify as Hispanic, leading to four mutually exclusive race/ethnicity categories: non-Hispanic Whites, non-Hispanic Blacks, non-Hispanic other, and Hispanic. Hispanic identity is dominant in that anyone who identifies as Hispanic falls in that category, regardless of racial identification.
Four main variables determine SES. The first is educational attainment, and the second is total household wealth, which varies across time. Wealth is scaled by the Consumer Price Index to put all values in constant US$2000, and all regressions use the natural log of real wealth. Childhood SES is captured by the educational level of the respondent’s mother and father. Key characteristics of the analysis sample are given in Table 2.
Key Sample Characteristics.

Note. Estimates incorporate all waves of data (individuals appear more than once), 1992–2018. HRS sample-weights are applied. Standard deviations are in parentheses.
Although the three veteran status groups (nonveterans, peacetime veterans, and wartime veterans) are quite similar in most ways, a few differences are noteworthy. The two groups of veterans are more likely to be White than nonveterans. Compared to veterans, nonveterans are more likely to have less than a high school education but more likely to be a college graduate, indicating a lower variance in educational outcomes among veteran groups than the general population. A similar pattern is found for household wealth: the variance in wealth is lower among veterans and they have higher median wealth and considerably lower mean wealth.
Perhaps most notable for our purposes is that the wartime veterans are 4–5 years older and much more likely to be in the older part of the age distribution than peacetime veterans and nonveterans. Much of this difference is because newer cohorts (drawn when they are in their 50s) are less likely to be veterans, especially wartime veterans, and the newer cohorts have not yet entered older ages.
Primary Analysis
This analysis employs continuous-time survival analysis. Many studies using longitudinal survey data conduct survival analysis with analysis time measured as the passage of time past the beginning of the survey; they then include age as a co-variate. For studies of human mortality, however, this specification is generally inappropriate—especially over periods of the life cycle where the hazard function is highly nonlinear in age. In studying human mortality, analysis time should be measured in age units and adjustments for cohort effects can be made by running stratified regressions or including birth cohorts as covariates that shift the baseline hazard.
The smooth line in Figure 1 is taken from the U.S. life table for men in 2006 (the center point of the HRS sample) and shows the probability of dying over the subsequent 1-year period at each age, which is the discrete hazard rate (the qx column in the life table). The other line is the age-specific annual death rates from the HRS analysis sample used here. The figure shows close agreement between the HRS and the life table but also shows that at older ages, measured mortality in the HRS falls somewhat short of life table values. The noisiness at the oldest ages reflects the natural depletion of the sample size at oldest ages.

One-Year Mortality by Age, Males.
In the stratified Cox proportional hazard implementation, the hazard rate for birth cohort i is:

where h0i(a) is the “baseline” hazard for the cohort. The baseline hazard is shifted proportionally by a linear combination of the k covariates x and coefficients b.
In all analyses below, analysis time is calculated as the duration of time past age 50 and the baseline hazard is stratified by birth year cohorts. The Cox framework does not impose any functional form restrictions on the baseline hazard rate though regression coefficients are assumed to be constant across all strata.
The initial analysis below estimates four models using successively increasing number of covariates, group together by how they change over the life course: Model 1 contains only veteran status; Model 2 adds in the early life demographics of race/ethnicity and parental education, which are fixed over time. Model 3 adds the important variable of education, which is determined, in most cases, in the same general period of the life course as military service. Model 4 adds the potentially time-varying covariates of marital status, and household wealth. Although wealth does vary over time, it also represents a cumulative measure of the economic status of the individual over the life course and does not fluctuate as widely as income. Since there is not a common baseline in this sample, it is not appropriate to fix wealth or marital status at baseline levels.
Identification
Contemporaneous health status is an obviously strong predictor of mortality for the simple reason that most people have a period of serious illness before they die. But including such a strong mediating variable would result in an overcontrolled model where the effects of demographic variables are partly or mostly drowned out. The approach taken here is in the spirit of Liu et al. (2005) analysis which sought to estimate the reduced form as a function of early life and mid-life covariates. Maclean and Edwards (2017) have used the HRS to show that combat experience is associated with worse health outcomes among veterans.
The “full” model here (Model 4) is parsimonious to reduce the problem of endogeneity, but I do not argue that all included variables are strictly exogenous. The variables included here, though, are “mostly determined” if not “pre-determined” prior to old age. I use the terms “effect” and “impact” for ease of exposition. The reader should not take these terms to imply that I have identified the full causal effect of military service.
Subsample Analyses
Prior research suggests that the association between veteran status and mortality is moderated by race and age (Landes & Piazza, 2023). To this end, I estimate Model 4 on three different subsamples of the data: first, by race/ethnicity; second, by age category; third, by birth cohort. Although cutting the data into these subsamples reduces precision of estimation, it can point toward important patterns in the data by allowing the veteran status effects to be unconstrained across the different groups.
Empirical Results
Table 3 contains estimates of the primary regression models discussed above. In Model 1 we see that without additional controls, veteran status has only a small and insignificant effect, raising the mortality hazard by 4.5% (HR = 1.045, p = .137) for wartime service. Adding race and parental education in Model 2 causes the wartime veteran status effect to rise only marginally, and the model shows the significant racial differences that are well known in the U.S. population: the mortality disadvantage faced by Blacks (HR = 1.389, p < .001) and the advantage held by Hispanics (HR = .855, p = .002).
Cox Regression Results.

Note. All regressions are stratified by birth cohort. Robust standard errors are in parentheses and account for complex sample design with 80 strata and 160 PSUs as well as individual-level sampling weights.
p < .1. **p < .05. ***p < .01.
Adding own education in Model 3 increases the hazard ratio for wartime service to a highly significant 1.108 (p = .001), and the education variables are also strong predictors of mortality in this specification. Model 4 adds wealth and marital status, which are both very strong predictors of mortality. Interestingly, adding these potentially mediating variables results in higher hazard ratios for veterans rather than causing attenuation, which often occurs with this type of exercise. Wartime service has a significant hazard ratio of 1.140 (p < .001), while peacetime service has an insignificant hazard ratio of 1.058 (p = .414).
Also notable from Model 4 is that the additional control variables have important consequences for the race/ethnicity variables. The well known “Hispanic Paradox” (Mehta et al., 2016; Shor et al., 2017) is even more evident, as the Hispanic indicator becomes even stronger (Hispanics have a hazard ratio of only .660 [p < .001]). However, the racial disparity between Whites and Blacks completely disappears in this specification (HR = 1.015, p = .690). A substantial attenuation in the Black–White racial gap when controlling for SES has been observed in mortality studies for some time (Behrman et al., 1991; McDonogh et al., 1997; Rodgers, 1992).
Differences by Race/Ethnicity
As noted above, prior research has suggested that Black veterans face different mortality risk than Whites, perhaps because “military capital” disproportionately raises the SES of Blacks. Figure 2 shows hazard ratios for Whites, Blacks, and Hispanics that are obtained from separate regressions of Model 4 (full results are in Online Technical Appendix). Because the “other” category is an amalgamation of other disparate groups such as Asians, Native Americans, and Pacific Islanders (and is a much smaller portion of the sample), separate regressions for the “other non-Hispanic” category are not conducted.
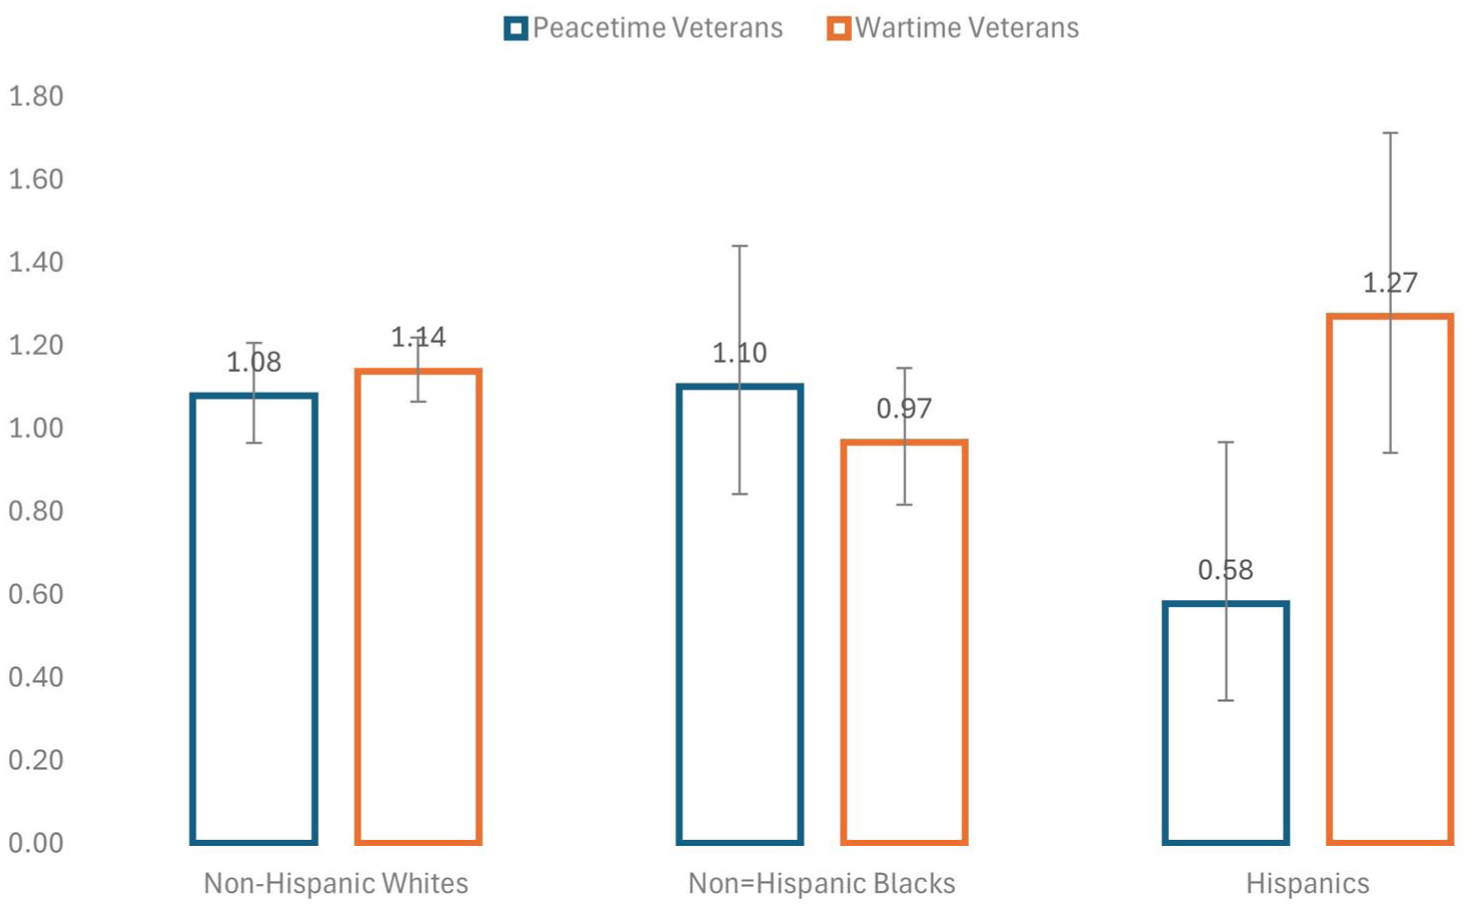
Veteran Status Hazard Ratios by Race/Ethnicity.
Since Whites make up a large share of the total sample, it is not surprising that the estimated hazard ratios for Whites (HR = 1.139, p < .001) are similar to the full sample, and wartime service remains a significant predictor of mortality for Whites. This effect is not found for Blacks, however, and the estimated hazard ratio for wartime service is actually below unity (HR = 0.967, p = .695). What has not been highlighted in previous scholarship, though, is the pattern among Hispanics. In this case, peacetime Hispanic veterans significantly lower mortality relative to Hispanic nonveterans (HR = 0.578, p = .037), and wartime mortality has a larger (HR = 1.27, p = .117) effect than it does for Whites, though it is not quite significant. A test of the coefficients for Hispanics shows that the wartime service hazard ratio is significantly higher (χ2 = 7.73, p = .005) than the hazard ratio for peacetime service.
Differences by Age
Figure 3 shows the results of estimating Model 4 separately by age category. For each regression, individuals contribute data to the analysis only during the period when they are in the designated age range at the time of the survey wave. The same people, thus, often appear in more than one regression as they move across age categories.

Veteran Status Hazard Ratios by Age.
Because of imprecision in the estimates, I cannot argue conclusively for a given pattern. One thing is clear, though: an increasing association between veteran status and age hypothesized by other research from age 50–100 is not consistent with the estimates. If anything, the wartime veteran effect starts high at age 50 and then declines (though the higher rate in the 80s does not fit this pattern).
Cohort Differences
Table 4 provides extensive information about the differences between birth cohorts and shows the results (the final two columns) from estimating the model separately by birth cohort. Not surprisingly, the three cohorts with the most observations (AHEAD, HRS, Early Baby Boomers) are the ones with significant hazard rates for wartime veterans. The AHEAD and HRS cohorts have estimates very similar to the full sample, while the Early Baby Boomers (those who came of age in the most intense years of fighting and were subject to the draft lottery) have a much higher hazard ratio (HR = 1.369, p = .043). Only the very last cohort in which there are hardly any wartime veterans show a mortality advantage, but the estimates have very high standard errors. Full results are in Online Technical Appendix.
Cox Regression Results by Sample Birth Cohort.

Note. Cohort sizes are number of observations (person-waves) used and are unweighted. Hazard ratios are from Cox regressions of Model 4 estimated separately by birth cohort, and robust standard errors are in parentheses and incorporate individual-level sampling weights. Complete regression results are in Online Technical Appendix.
p < .1. **p < .05. ***p < .01.
Age-Cohort Interactions
In this study, the highest effect from wartime service occurs in ages 50–69, and the cohort with the highest mortality of wartime veterans is the Early Baby Boom. If this middle age period is particularly important, what is happening to this age group across successive cohorts? To examine this, I estimated the model from HRS cohort restricted to those 50–69 and compared it to the men of the same age from the Early Baby Boom cohort (results are in Online Technical Appendix). In both groups, we see a strong wartime service effect that appears to have grown over time. In the HRS cohort, the hazard ratio is 1.252 (p = .010), which rises to 1.419 (p = .024) in the Early Baby Boom cohort. Of course, it is not possible to determine whether this increase is a period or a cohort effect.
Robustness Checks
The Online Appendix also shows estimates for Model 4 using three alternative estimation approaches. These are the following:
Model 4 is estimated with birth cohorts used as regressors rather than as strata. The estimated coefficients follow a strongly diminishing mortality of successive cohorts consistent with increasing life expectancy of the elderly in the past several decades. The wartime veteran hazard ratio is 1.148 (p < .001).
A parametric survival model using the Gompertz distribution finds, in general, very similar coefficient estimates to the Cox model. The wartime veteran hazard ratio is 1.132 (p < .001).
A discrete time survival model is estimated, which is implemented in the conventional way by doing a logit regression in which the dependent variable is failure between the waves and in which the baseline hazard function is captured by the inclusion of age dummy variables. The wartime veteran hazard ratio is 1.132 (p < .001).
In sum, each of these three estimation approaches yield estimates for wartime veterans that are highly significant and strikingly close to the Cox regression estimates in Table 3.
Discussion
These results are in-step with the previous research findings showing a general mortality disadvantage for veterans (Landes & Piazza, 2023). The results also show that military service during wartime has a much stronger long-term effect than peacetime service. An interesting feature of these results is that the mortality disadvantage for wartime veterans only shows up as I add demographic controls to the model. As covariates are added in successive models, the hazard ratio changes from small and insignificant to highly significant (HR = 1.140, p = .000). This pattern suggests a direct, independent effect of wartime military service. A plausible explanation for the pattern shown in Table 3 is that the positive and negative effects of military service tend, on balance, to cancel each other out. To the extent that “military capital effect” raises education, wealth, and the probability of being married (or influences unobserved variables that are correlated with those variables), adding these variables captures at least some of the beneficial indirect consequences of military service. What remains reflected in Model 4, therefore, are the negative consequences—the “military hazard effect” (Wilmoth et al., 2019).
The results also reveal important differences (and puzzles) across racial groups. As found in previous research the negative effect of wartime military service is not found for Black veterans (HR = .966). What has not received attention in prior literature is the effect of military service among Hispanic veterans. Figure 2 shows that Hispanic veterans have a significantly lower effect of peacetime service compared with nonveterans. Although not significant (HR = 1.270, p = .117), the hazard ratio associated with wartime service is even greater than it is for Whites. And for Hispanics, not only is the effect of peacetime service significant, but the difference between wartime and peacetime service is highly significant (χ2 = 7.73, p = .005). This suggests that Hispanics are poised to gain significant advantages from military capital that occurs in peacetime. Why this sharp dichotomy exists for Hispanics but not Whites or Blacks deserves future attention.
The changing relationship between veteran status and mortality over the life course discussed earlier re points to a “cross-over,” with veterans starting at an advantage at earlier ages (the “healthy soldier” effect) and then transitioning to a disadvantage. Since the evidence for a mortality advantage at younger ages (20–40) is strong, some point of cross-over must logically exist to explain the emergence of a mortality disadvantage later in life.
In contrast to some existing research, however, this analysis shows that the wartime service effect is highest in the 50s (HR = 1.31, p = .037), somewhat lower in the 60s (HR = 1.22, p = .013), and then mostly disappears in the 70s. This pattern would be roughly consistent with the hill-shaped relationship between age and mortality among veterans that is shown in Table 1 were it not for the increase in the 80s (HR = 1.16, p = .005) also shown in Figure 3. The findings here, though, are consistent with the increase between 70s and 80s found by Liu et al. (2005) with an early version of the AHEAD cohort a couple of decades ago. That study was not able to actually estimate the mortality prior to age 70, so their conclusion of a crossover at that point was a theoretical conjecture rather than an empirical finding.
The results related to the life course agree with the studies based on millions of veterans in Table 1 rather than with the survey-based research cited above. The Sullivan-Baca et al. (2023) study, for instance, shows a very striking hill-shaped pattern where the gap between veterans and the general population peaks at age 55–64. It bears noting, however, that their data on veterans is drawn from the Veterans Health Administration, and research has shown that veterans treated by the VHA have worse mortality outcomes than veterans treated outside that system (Landes et al., 2018). Additional evidence presented here points to the importance of late middle age (50–69). As reported above, wartime veterans age 50–69 have a significant mortality hazard of 1.25 in the HRS cohort and 1.42 in the Early Baby Boom cohort.
If the hill-shaped age profile is accurate, that would suggest a more complex story than the argument based on early exit of frail individuals from the population that is used to motivate the cross-over conjecture (Liu & Witten, 1995; Vaupel et al., 1979). The emergence of deaths of despair among middle-aged Americans in recent decades (Case & Deaton, 2015; Katz et al., 2020), for example, may be relevant to this story, and the high mortality among the Early Baby Boomers may be an early indicator of this phenomenon. We know that veterans today are at much greater risk of suicide and are roughly twice as likely to live in rural areas where social isolation is higher and employment opportunities are lower (Denneson et al., 2024). It is also very possible that both patterns (increased risks at middle age and then a compositional change in later life) are occurring because we would not expect a compositional effect to occur until older age when the mortality hazard is much higher.
Looking at the pattern of estimates across the cohorts in Table 4, we can also identify a rough pattern associated with the major conflicts of the 20th century. Three of the cohorts in this analysis have a statistically significant effect of wartime military service: WW2 veterans in the AHEAD cohort (HR = 1.11); Korean War veterans in the first HRS cohort (HR = 1.13l) and Vietnam War veterans from the Early Baby Boomer cohort (HR = 1.37). Other cohorts have relatively more men who are of military age between the major conflicts and do not show significant effects for wartime service. The higher estimate mortality among Vietnam veterans is also consistent with the deaths of despair account.
The mortality disadvantage observed among wartime veterans should be interpreted not only as the consequence of military exposures but also as part of the broader health trajectory of men. Military service is a gendered institution: during the 20th century, service was overwhelmingly male and reinforced masculine ideals of toughness, stoicism, and risk-taking. Courtenay (2000) has argued that such cultural constructions of masculinity increase men’s morbidity and mortality by discouraging help-seeking and valorizing health-risking behaviors. In this sense, the elevated mortality risk of veterans reflects both the hazards of combat and the reinforcement of masculine norms that extend well beyond the military context. The broader social vulnerabilities of men, such as higher rates of deaths of despair noted above, suggest that veteran mortality is part of a wider pattern in men’s health.
This study has several limitations. First, veteran status is self-reported, which may introduce misclassification error. Second, the available survey data provided no measures of combat exposure, preventing me from distinguishing between degrees of wartime intensity or theater-specific risk. Third, although I have drawn connections between the literature on veteran health and identified reasons why masculinity, in particular, may be a causal force in shaping the mortality profile of veterans, I do not have direct evidence on the mechanisms that might link the features of wartime service with men’s behavioral health and, eventually, with mortality risk.
Conclusions and Future Directions
Much remains unknown about the complete pathway between military service and mortality—including how experiences in the military affect both the incidence of specific physical and mental health conditions and the accumulation of protective military capital. Wilmoth et al. (2019) point to both the “substantial heterogeneity” of the physical and mental health experiences of veterans as well as their “resilience and posttraumatic growth” (p. 23). They argue for more research on specific war-era cohorts to identify specific mechanisms. The findings here suggest more attention to specific cohorts is warranted. In particular, those young men who served in the tumultuous last years of the Vietnam War and entered the 1990s in their 40s and 50s may have been especially prone to long-term harm, and they deserve continued attention as they age. It also seems likely that deaths of despair are an important part of their story.
This study demonstrates that wartime military service is associated with a significant mortality disadvantage for men, especially during midlife. These findings underscore the need for health policies that targe male veterans with interventions in their 50s and 60s, a period of heightened vulnerability. Resources should be directed toward suicide prevention, substance abuse treatment, and chronic disease management tailored to veteran populations.
As discussed earlier, it may be the case that cultural factors linked to masculinity influence veteran mortality. This may occur through discouragement of preventive care and help-seeking. Practical efforts to reduce these risks should include health programs that frame care-seeking as a demonstration of resilience rather than weakness.
Finally, these results suggest that veteran mortality should be considered a men’s health issue more broadly. Public health strategies should leverage the positive aspects of military service, such as the strong correlation between military service and participation in civic activities such as sports and veteran groups found by Wilson and Ruger (2021), to build protective factors against premature death.
Supplemental Material
sj-docx-1-jmh-10.1177_15579883251397903 – Supplemental material for The Demography of Mortality Disadvantage Among Male U.S. Veterans in Later Life: New Evidence From the Health and Retirement Study
Supplemental material, sj-docx-1-jmh-10.1177_15579883251397903 for The Demography of Mortality Disadvantage Among Male U.S. Veterans in Later Life: New Evidence From the Health and Retirement Study by Sven E. Wilson in American Journal of Men's Health
Footnotes
Ethics Statement
This research involves only analysis of secondary data and did not require IRB or other legal approval.
Funding
The author received no financial support for the research, authorship, and/or publication of this article.
Declaration of Conflicting Interests
The author declared no potential conflicts of interest with respect to the research, authorship, and/or publication of this article.
Data Availability Statement
All data used in this research is publicly available from sources indicated in the manuscript.
Supplemental Material
Supplemental material for this article is available online.
References
Supplementary Material
Please find the following supplemental material available below.
For Open Access articles published under a Creative Commons License, all supplemental material carries the same license as the article it is associated with.
For non-Open Access articles published, all supplemental material carries a non-exclusive license, and permission requests for re-use of supplemental material or any part of supplemental material shall be sent directly to the copyright owner as specified in the copyright notice associated with the article.