
Abstract
Obesity is a significant public health problem globally and within the United States. It varies by multiple factors, including but not limited to income. The literature indicates little evidence of the association between income and obesity. We examined the association between income and obesity in U.S. adult men ages 20 years and older and tested racial and ethnic differences. We used data from the 1999 to 2016 National Health and Nutrition Examination Surveys for analyses. Obesity was determined using body mass index ≥30 kg/m2. We used poverty income ratio (PIR) as a proxy for income and calculated the Gini coefficient (GC) to measure income inequality. We then categorized low-, medium-, and high PIR to examine the relationship between income inequality and obesity. We used Modified Poisson regression in a sample of 17,238 adult men, including 9,511 White Non-Hispanic White (NHW), 4,166 Non-Hispanic Black (NHB), and 3,561 Mexican Americans (MA). We controlled the models for age category, racial and ethnic groups, marital status, education, health behaviors, health insurance coverage, self-reported health, comorbidity, and household structure. Results of our adjusted models suggested a positive and significant association between PIR and obesity among NHWs and NHBs in medium and high PIR; this association was not significant in MAs. Results of our analyses using GC in obese men indicate that compared with NHWs (GC: 0.306, SE: 0.004), MAs (GC: 0.368, SE: 0.005), and NHBs (GC: 0.328, SE: 0.005) had experienced higher-income inequality. In treating obesity, policymakers should consider race/ethnicity strategies to reduce inequality in income.
Introduction
In the United States, income inequality has peaked in recent years (Salazar et al., 2019). Gini coefficient, a measure intended to represent income inequality, has increased almost from 0.394 in 1974 to 0.489 in 2017 (Hales et al., 2020). Since 1970, the annual earnings for the top 1% increased by 158%, but for the bottom 90%, earnings increased only 24% (Khullar & Chokshi, 2018; Zumbrun, 2014). As inequality grows, the resulting division leads to divergent experiences and access to opportunities (Trump, 2018). This divide between society’s wealthiest and poorest citizens threatens communities and public health.
Income Inequality and Race/Ethnicity
Almost all socioeconomic factors, including income, are influenced by race and ethnicity. Substantial research has confirmed a significant association between income inequality and race/ethnicity (Casey et al., 2017; Salazar et al., 2019; Zare et al., 2021). The National Academies of Sciences, Engineering, and Medicine (NASEM, 2017) reports that African Americans and the poor consistently exhibit higher rates of multiple diseases, physical and mental impairment, functional limitation, and disability (NASEM, 2017). Unfortunately, many public health and policy interventions fail to recognize the role of race and ethnicity, further exacerbating existing disparities (Manduca, 2018). Moreover, low-income communities with large proportions of racial and ethnic minorities are the most vulnerable to the manifestation of these inequities.
Income Distribution and Obesity
Income influences health outcomes on numerous levels. It decreases the barriers to accessing care and living in healthier neighborhoods—additionally, income moderates environmental factors and shapes health behaviors (Kirby & Kaneda, 2005; Pampel et al., 2010). Studies have reported a negative association between income inequality and poor health outcomes (Marmot, 2002; Subramanian & Kawachi, 2004). Specifically, higher-income people live in neighborhoods with better access to health care, higher educational attainment, and more social capital (Kirby & Kaneda, 2005). Income has direct and indirect effects on health by facilitating an opportunity to control life circumstances and promoting social participation (Marmot, 2002). Thus, individuals living in communities with unequal distributions of income have experienced a higher rate of obesity (Casey et al., 2017; Marmot & Wilkinson, 2001).
Cost of Obesity
Obesity has become a national public health concern, increasing by 42.4% between 1999 and 2018 (Hales et al., 2020). Obesity-related medical care costs Americans up to US$210 billion annually (The George Washington University [GWU], 2013; Trogdon et al., 2008). Furthermore, research has highlighted that obesity is associated with an increased risk for chronic medical conditions linked with higher medical costs (Hales et al., 2020; Hruby et al., 2015). Health care costs are significantly associated with increased body mass index (BMI) and weight class (Cawley et al., 2021). A meta-analysis reported that direct medical costs of obesity were more than six times higher per person than those classified as overweight (Tsai et al., 2011).
Obesity and Access to Healthy Foods
Due to residential segregation or redlining, racial and ethnic minorities often have decreased access to healthy foods, neighborhoods, and social environments (Casey et al., 2017). One study reported that racial inequality in median income was associated with fewer grocery stores and more fast-food restaurants (Bell et al., 2019). Structural racism proliferates risk factors associated with obesity and obesogenic environments (Bell et al., 2019). Physical activity and access to healthy foods are crucial protective factors in preventing obesity (Wolfenden et al., 2020).
Despite robust studies on the association between health outcomes and income distribution (Deaton & Lubotsky, 2003; Haithcoat et al., 2019; Mackenbach, 2002; Matthew & Brodersen, 2018), few studies on its impact on health outcomes, especially obesity (Matthew & Brodersen, 2018; Pabayo et al., 2018). This study investigated the relationship between obesity and income among racial/ethnic adult men ages 20 and older and tested whether this relationship differs by race and ethnicity.
Materials and Methods
Data Set
We used data from the 1999 to 2016 National Health and Nutrition Examination Surveys (NHANES, 2020). As a cross-sectional survey, the NHANES provides nationally representative health and nutritional status estimates for the U.S. population, with a 73.2 response rate between 1999 and 2016 (NHANES, 2018; Zipf et al., 2013). In addition, the NHANES is representative of each of the four regions of the U.S. (Zipf et al., 2013). For this study, we included men participants who were 20 years old and older. We excluded the population under 20 years old because most control variables have not been reported for the younger population under 20 years old, including smoking, drinking, exercise, etc. From 22,176 men 20 years and above, we excluded 3,489 because of other race/ethnicity groups. We also removed 1,449 missing observations for poverty income ratio (PIR) in the analysis or BMI; this yielded an analytic sample of 17,238, including 9,511 Non-Hispanic White (NHW), 4,166 Non-Hispanic Black (NHB), and 3,561 Mexican Americans (MA). Race and ethnicity are self-reported by respondents.
Outcome Variable
Using BMI—derived by dividing weight in kilograms by height in meters squared (kg/m2)—we created a binary variable to identify participants who were obese (if BMI ≥30) as the outcome variable (National Institute of Health [NIH], 2020). Also, following the Centers for Disease Control Prevention (CDC) approach (Centers for Disease Control Prevention [CDC], 2021; Flegal & Graubard, 2009; Wohlfahrt-Veje et al., 2014), we created three classes of obesity: class 1 if BMI of 30 to <35, class 2 if BMI of 35 to <40, and class 3 if BMI of 40 or higher. The CDC categorized class 3 as “severe” obesity.
Main Independent Variable
Poverty Income Ratio
The primary independent variable of interest was the PIR—the ratio of family income to the poverty threshold. For the regression models, we defined our population in three main PIR categories, for example, low PIR (PIR<0.1.16), middle PIR (1.17–2.81), and high PIR (2.82–5.00).
Gini Coefficient
Gini coefficient (GC) measures income inequality and allows us to compute income inequality. The GC is defined as A/(A+B). A is the area between the line of perfect equality (45° line) and the Lorenz Curve, and B is the area between Lorenz Curve X and Y-axis. If “A” equals zero, then GC will be zero, which means perfect equality. However, if “B” is zero, the GC will be one, which means complete inequality (Haughton & Khandker, 2009). Lorenz Curve represents the actual income distribution in a given society (Matthew & Brodersen, 2018), greater distance from the line of perfect equality represents that a small percent of the population receives most of the wealth and that the income distribution is uneven.
Covariates
For the demographic variables, we included age categories (0 = 20–24, 1 = 25–44; 2 = 45–64; 3 = 65+), a binary variable for marital status (1 = married, 0 = otherwise), educational attainment (less than high school graduate; high school graduate, or general equivalency diploma [GED]; more than high school education or some college, or college graduate and above). Health-related characteristics included having health insurance (1 = yes; 0 = no) and self-reported health (1 = fair, and poor, 0 = excellent, very good, and good). We used smoking (never smoked, a former smoker, or current smoker), drinking (never drink, former drinker, or current drinker), and physical activity (a binary variable indicated that an individual had not participated in vigorous activities [1 = yes; 0 = no] during a typical week) to measure health behavior. We also controlled models for comorbidity (any type of chronic disease including emphysema, thyroid problem, chronic bronchitis, chronic obstructive pulmonary disease (COPD), asthma, arthritis, malignancy, stroke, diabetes, coronary heart failure, angina pectoris, heart attack, and liver problem (1 = yes; 0 = no). An essential element in predicting individual/household income is household structure. (Deaton, 1997); We used a binary variable to present living alone (1 = yes; 0 = no) and family size to control household structure.
We used descriptive analysis to compare mean and proportional differences for obesity, demographics, health-related characteristics, and health behaviors between NHW, NHB, and MA. We used the chi-square test for categorical variables and ANOVA for the continuous variables, e.g., age and comorbidity. Because the prevalence of obesity (BMI ≥ 30) was greater than 10%, we used a weighted modified Poisson regression analysis that produced prevalence ratio (PR) and corresponding 95% confidence intervals (CI) (McNutt et al., 2003; Thorpe et al., 2017; Zou, 2004). We ran sets of weighted modified Poisson regression analyses. Model 1 was an unadjusted model examining the relationship between income level and obesity in men. In Model 2, we adjusted the model for race/ethnicity and was a Model 3 controlled model for all sociodemographic, comorbidity, and family size. In Model 4, we repeated Model 3, adding the interaction between PIR categories and race/ethnicity. We stratified the analyses by race because the interaction between the income quintile and the race was significant (p < .001).
All analyses were weighted using the NHANES individual-level sampling weights for 1999 to 2016 (eight waves of data) (CDC, 2018) to make our estimates representative of the U.S. civilian non-institutionalized population. We used STATA statistical software, version 16, to perform all analyses.
Ethics
The study has been approved by the Institutional Review Board Office of the Johns Hopkins Bloomberg School of Public Health. We used all publicly available data, and our study does not qualify as human subjects research as defined by DHHS regulations 45 CFR 46.102.
Results
Association Between Income Level and Obesity
Study Population Characteristics
Table 1 compares the distribution of the sample’s characteristics. Overall, the sample age was 46.0 ± 14.0 years, the majority of men (58.0%) had more than a high school education, 24.5% of the population were current smokers, and 85.2% were current drinkers, 38.5% were physically inactive. About 16% of the population reported fair/poor health, with 0.8 comorbidities and average household size of 3.0.
Distribution of Selected Characteristics of U.S. Adults Men Over 20 Years of Age in 1999–2016; National Health and Nutrition Examination Survey.

Note. NH = Non-Hispanic; BMI = body mass index; PIR = poverty income ratio; SD = standard deviation; M = mean..
Comparing sociodemographic variables by race and ethnicity identified that the NHW population was older with an average age of 48.0 years (SD:11.4) and the MA population was younger (39.1 years [±17.0]), NHBs stayed between these two groups with an average age of 43.5 years (±18.9). NHW men were more likely to have higher education (63.2%) than NHBs (46.1%) and MAs (27.7%). The highest smoking rate belonged to NHBs (31.8%), and then MAs and NHWs with 24.2% and 23.6%, respectively. 87.6% of MAs were current drinkers, with a similar rate for NHW and the lowest rate (77.2%) for NHBs. NHBs and MAs were more likely to be physically inactive than NHWs. NHBS reported the highest rate for living alone, compared with 12.0% of the sample population. The largest household size was for MAs with 4. See Table 1 for detailed information and race/ethnicity groups.
A Gap in Income and the Highest Income Inequality in Communities of Color
Considering obesity (BMI≥30), 67% of the sample population were obese. Stratified by race, the highest proportion for NHWs (66.7%), then NHBs (64.8%) and MAs (64.1%). The results of the BMI class have identified that, on average, 43.4% of men had experienced severe obesity, with the highest proportion (6.6%) in NHB, followed by MA (4.8%) and then NHW (4.1%).
There is a massive gap between the PIR between 1999 and 2016. Figure 1 compares obesity and PIR trends between NHWs, NHBs, and MAs men. Between 1999 and 2016, NHBs experienced the highest obesity increase, from 18.6% to 45.9%. MAs experienced a 19.5%-point increase in obesity from 17.4% to 36.9%. The lowest increase is for the NHWs by 11.3 percentage points from 21.3% to 32.6%. (Panel A). As presented in panel B, there is a massive gap between the PIR between 1999 and 2016. The distribution of PIR categories indicated that NHWs were more likely to be on high PIR (62.9%) than NHBs (38.4%), followed by MAs (23.5%).
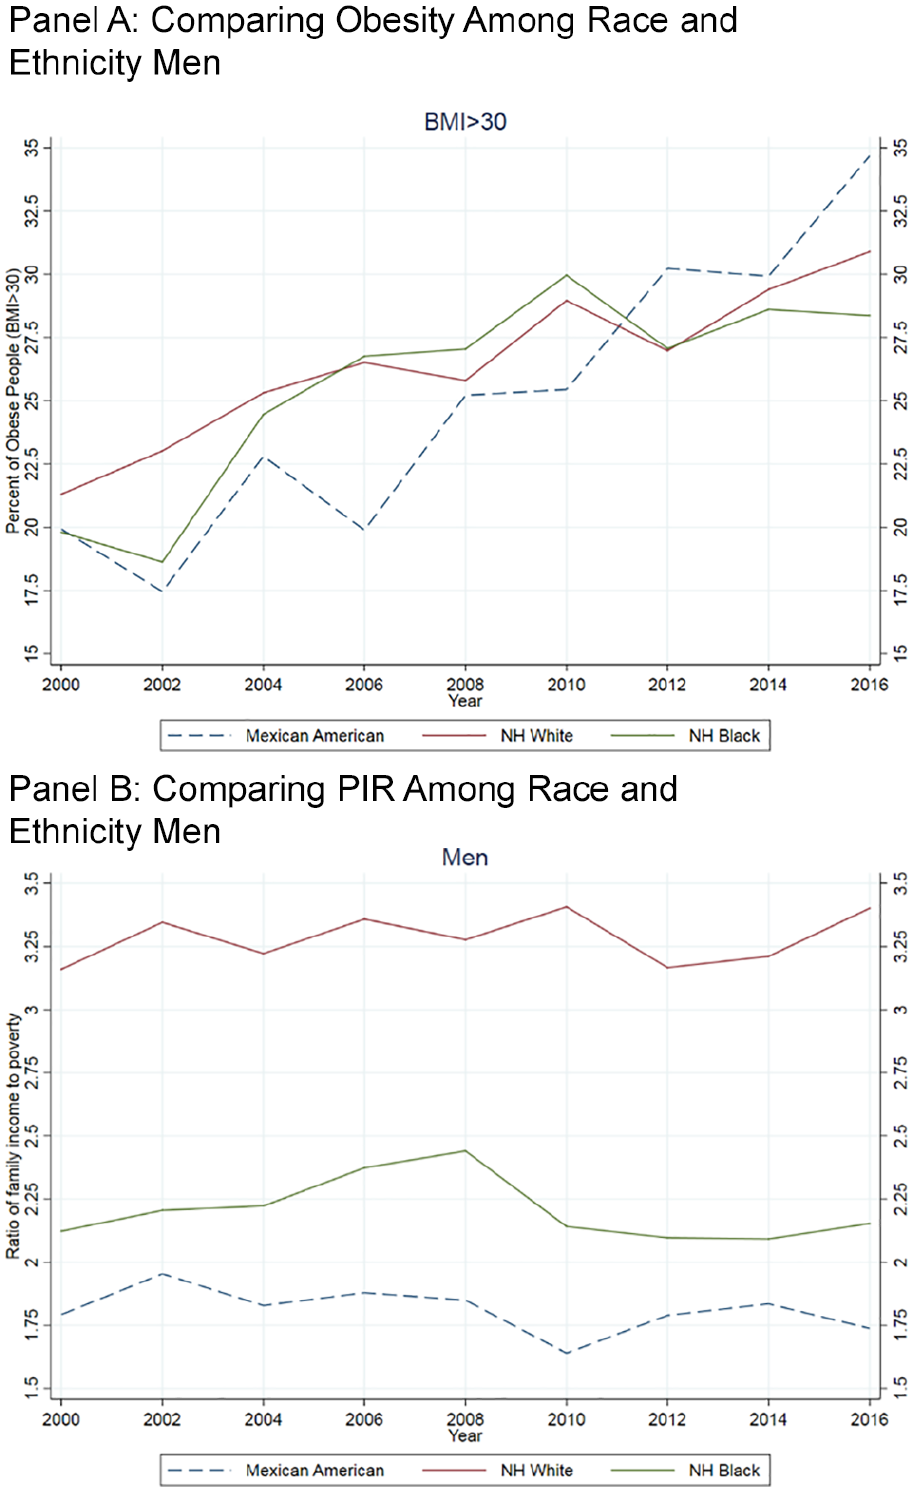
Comparing Obesity and PIR Trends in U.S. Adult Men 20 Years Old and Above Between 1999 and 2016. Panel A: Comparing Obesity Among Race and Ethnicity Men. Panel B: Comparing PIR Among Race and Ethnicity Men.
Figure 2—Lorenz curves—identifies the GC for PIR in NHWs, NHBs, and MAs men in the United States between 1999 and 2016. To plot these curves, we used average GC with jackknife standard errors. This figure compares GC between obesity classes in men by race/ethnicity (Figure 2).

The Lorenz Curves and Gini Coefficients in Men, 1999 to 2016.
In Figure 2 panel A, the solid blue line plots the income distribution in NHW obese men with a BMI between 30 and 35 kg/m; the dash-red line highlights the distribution in NHBs, and the green dash-dot line presents the distribution in MAs. The blue line stays closer to the 45-degree (perfect equality line). These results reveal smaller income inequality within obese NHW men (GC: 0.306) and greater inequality within NHB (GC: 0.330) and MAs (GC: 0.368).
The Association Between Income and Obesity in Pooled Data
Table 2 reports the association between PIR and obesity in pooled samples. There was a positive association between middle PIR (PR: 1.14, CI: 1.06–1.23) and high PIR (PR: 1.18, CI: 1.08–1.29) and obesity. Compared with NHWs, NHBs (PR: 1.12, CI: 1.05–1.19) and MAs (PR: 1.15, CI: 1.05–1.26) had a higher PR of being obese (See Model 3). After interacting with PIR and race/ethnicity, we learned that NHBs with high PIR had a higher PR of being obese (PR: 1.15, CI: 1.01–1.17). (Results have not been reported).
Association Between Obesity and PIR in U.S. Adults’ Men 20 Years and Older:1999 to 2016.
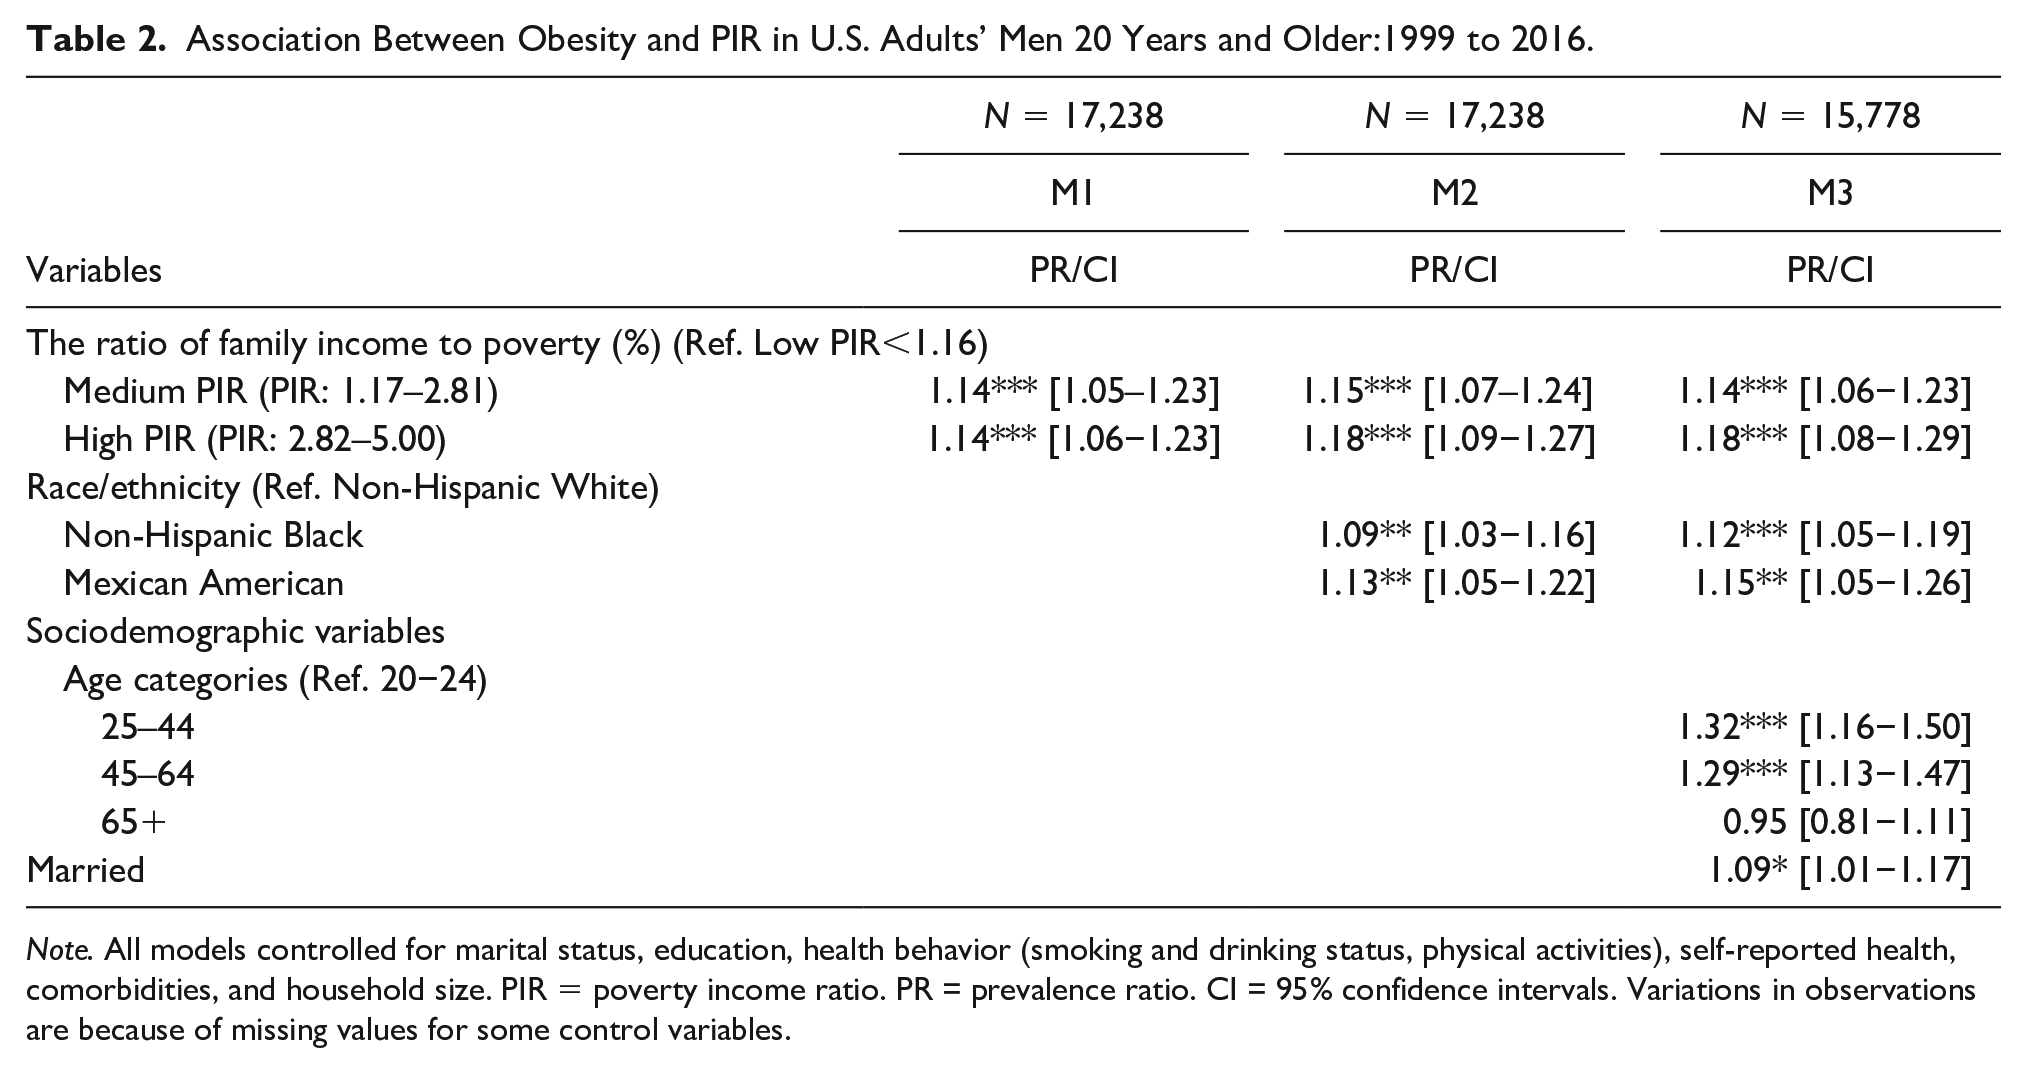
Note. All models controlled for marital status, education, health behavior (smoking and drinking status, physical activities), self-reported health, comorbidities, and household size. PIR = poverty income ratio. PR = prevalence ratio. CI = 95% confidence intervals. Variations in observations are because of missing values for some control variables.
Compared with the reference groups, 25 to 44- and 45- to 64-year-old people had a higher PR of being obese. Married people, smokers, former drinkers, people with poor health and comorbidity, and those with no rigorous activities had a higher PR associated with being obese. We have not identified education as a protective component of being obese.
The Effect of Race and Ethnicity on the Association Between Income and Obesity
Table 3 reports the association between PIR and obesity in stratified models by NHWs, NHBs, and MAs. As presented, there is a positive and significant association between obesity and income in the middle PIR and high PIR. NHWs in the middle PIR and high PIR suffered 13% and 16% times more than the NHWs in the low PIR quartile. The same trend appears for the NHBs in the middle PIR and high PIR with 16.0% and 27.0%, respectively. We did not find a significant association in MAs.
Association Between PIR and Obesity Across Racial/Ethnical Groups in U.S. Adults’ Men 20 Years and Older, 1999 to 2016.
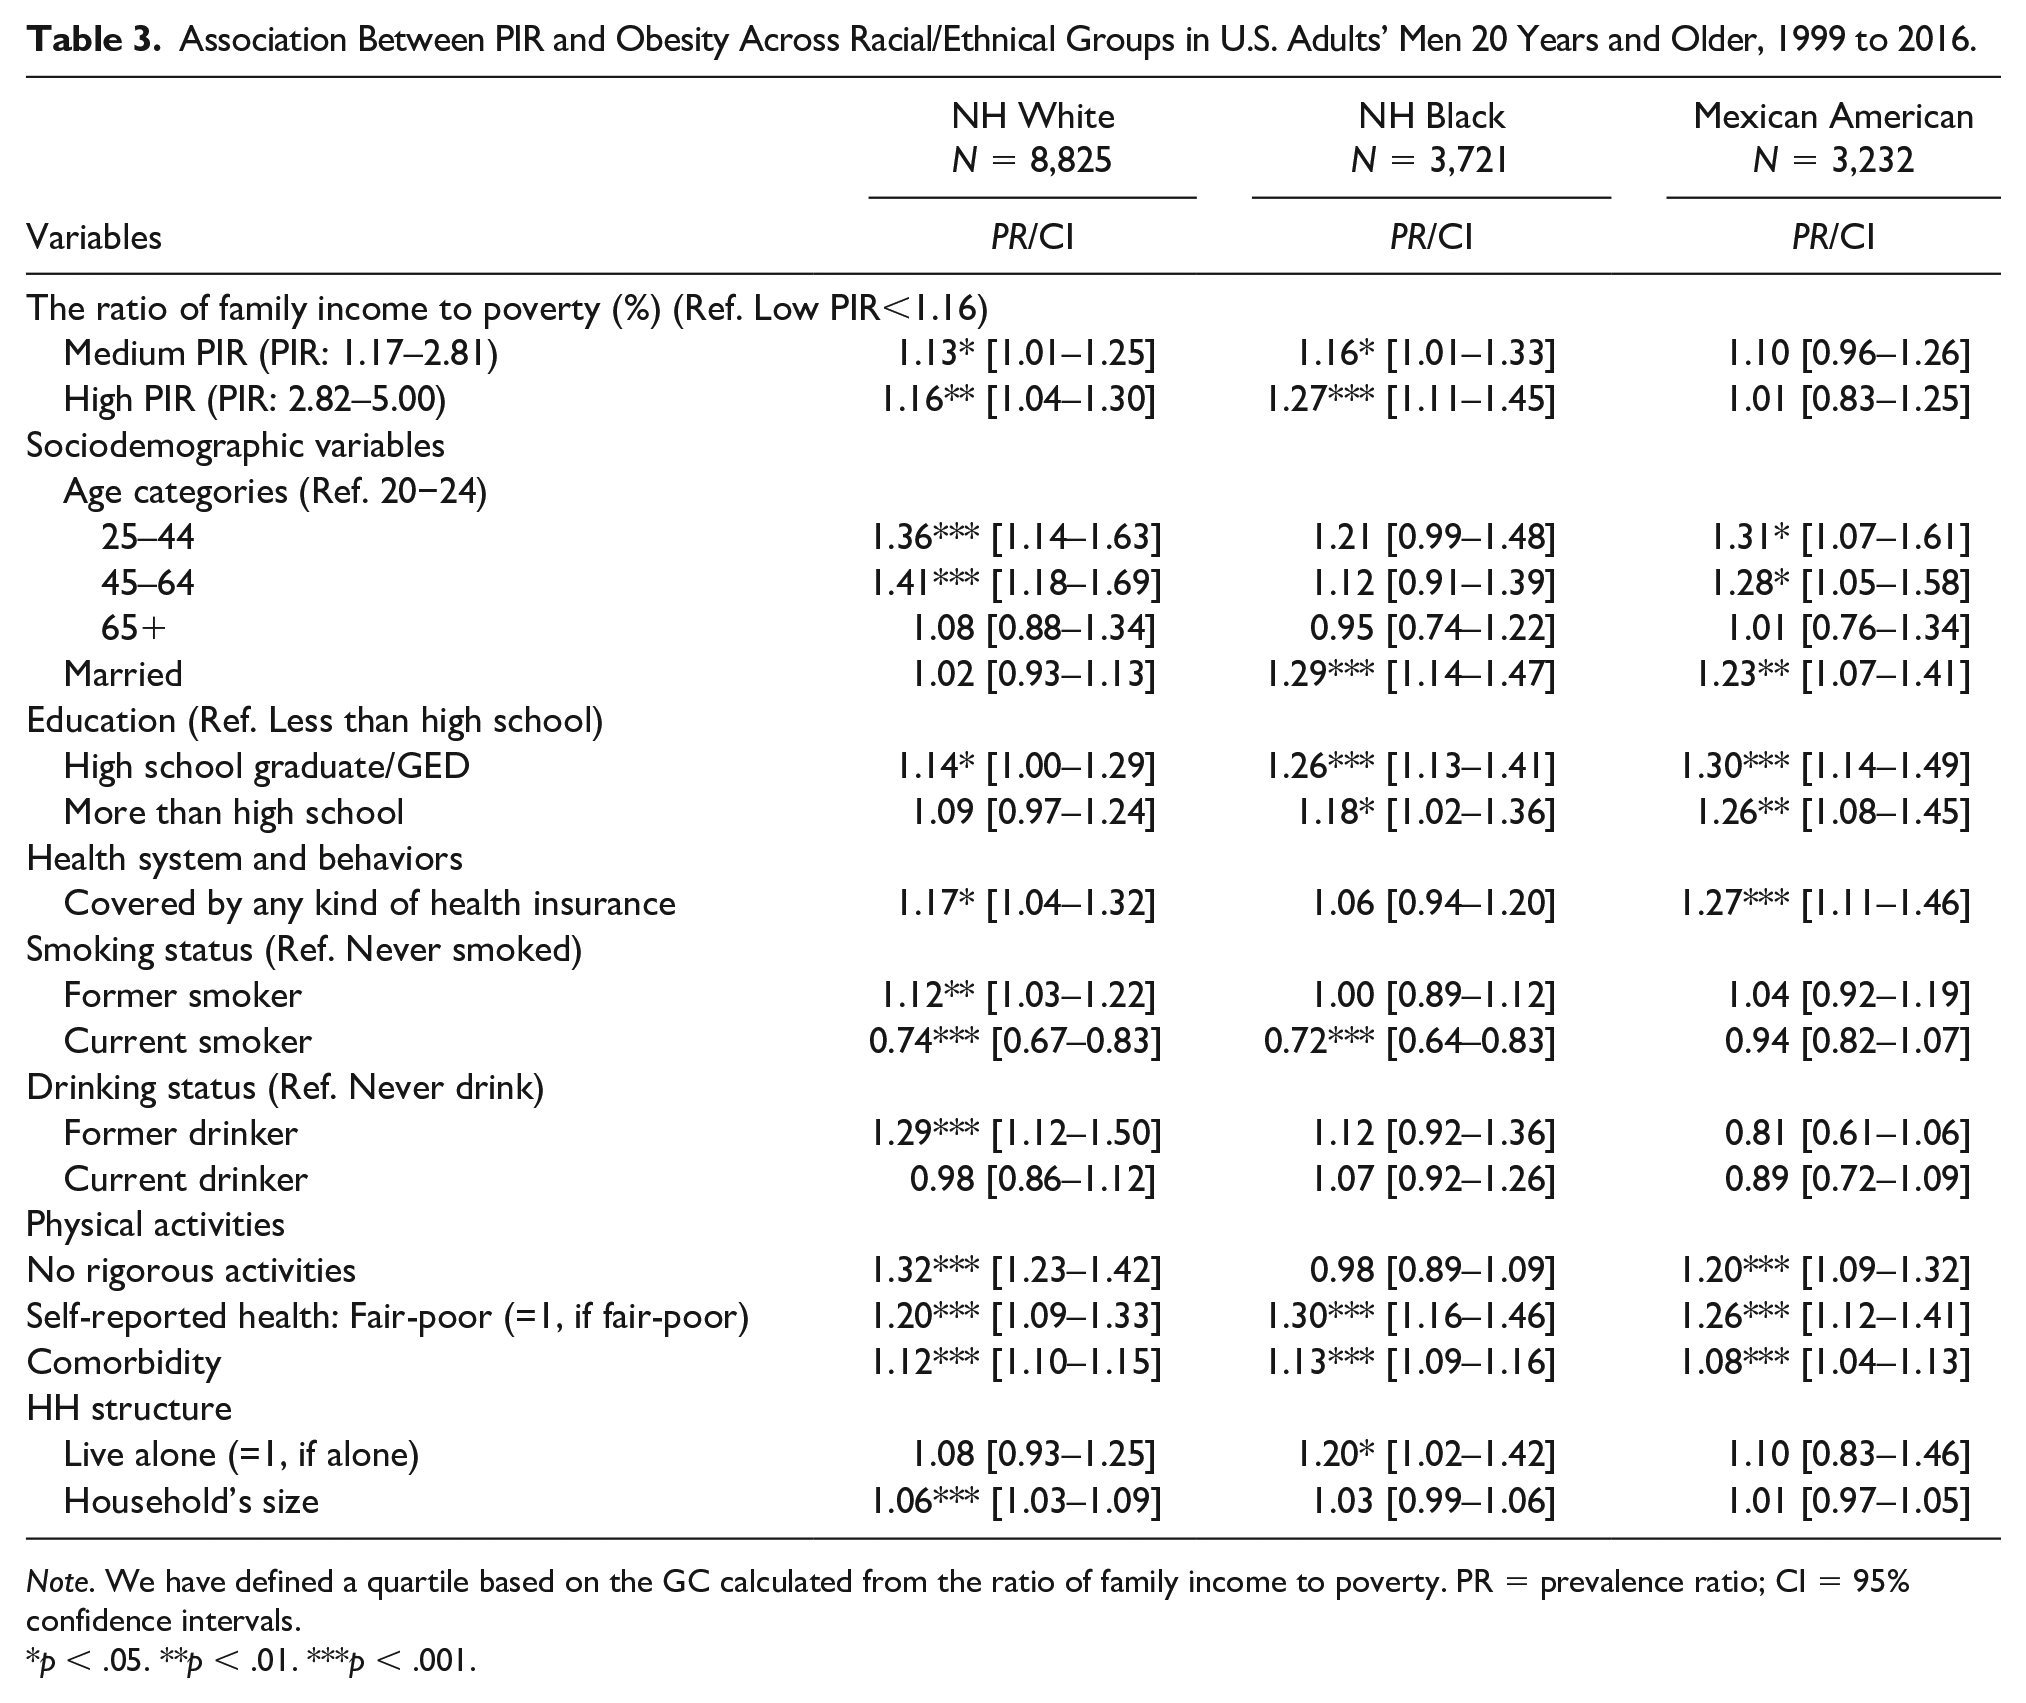
Note. We have defined a quartile based on the GC calculated from the ratio of family income to poverty. PR = prevalence ratio; CI = 95% confidence intervals.
p < .05. **p < .01. ***p < .001.
The Effect of Sociodemographic and Other Variables on the Association Between Income and Obesity
Comparing the association between sociodemographic variables and obesity highlighted that the NHW population between 25 and 44 and 45 and 64 years old suffered more from obesity by 36% and 41% more than individuals between 20 and 24 years old. As presented in Table 3, the NHWs with less than high school who were former smokers and drinkers with no rigorous activities suffered more from obesity. Also, having poor health and comorbidity increases the chance of being obese in NHWs. Finally, family size is another predictor. We see a similar pattern in NHBs.
Interestingly, education is not protective, which may be due to lower income in NHBs because of income inequality and wage differences between NHW and NHB of an equal degree. Similarly, young and middle-aged MAs adults were more likely to be obese than 20 to 24 years old adults. Not being physically active, having poor health, and comorbidity were other predictors in MAs. We also did not find a protective impact on education in MAs.
The adjusted models indicate that in all race/ethnic groups, the obese population was more women, high school graduates, and former drinkers with poor or fair health. There are some differences between NHWs, NHBs, and MAs. For example, being married has been positively associated with obesity in NHBs and MAs but not in NHWs. Being physically inactive was positively associated with obesity in NHWs and MAs but not NHBs. For MAs, having health insurance coverage was associated with obesity, but not in NHWs and NHBs. Finally, obesity was positively associated with the size of a household in NHWs.
Discussion
This study investigated the relationship between obesity and PIR and how this association varied among NHW, NHB, and MA men 20 years and older in the U.S. between 1999 and 2016. Our findings suggest that for NHW and NHB men, higher income was positively associated with a higher prevalence of obesity (BMI ≥30) but not in MA men.
Despite a fair amount of prior research regarding income inequality and health (Haithcoat et al., 2019; Lochner et al., 2001; Lovasi et al., 2013; Muller, 2002; Soobader & LeClere, 1999; Subramanian et al., 2001), little is known about the impact of income inequality and obesity in men, specifically, men who belong to racial/ethnic minority groups. Specifically, the association between income inequality and race and ethnicity reports variations in obesity severity between NHWs, NHBs, and MAs (Bilger et al., 2017; Zhang & Wang, 2004). However, looking at the severity of obesity, our results reveal that NHBs and MAs men need more help to manage their weight.
Income Distribution and Men
Research reports that, among men, differences in income increase with social class even after controlling for socioeconomic status, education, occupation, and other variables related to socioeconomic status (Thomas & Moye, 2015). The racial income gap among men has remained pervasive, despite increases in income and social class (Semyonov & Lewin-Epstein, 2009; Thomas & Moye, 2015). On average, African American and Mexican American men still earn less than White Men (Thomas & Moye, 2015). Thomas and Moye note, “common explanations for African American and white income differentials have focused on racial discrimination, racial differences in human capital, and spatial mismatch (p. 490)” (Thomas & Moye, 2015). However, redlining and racial segregation also play a crucial role (Casey et al., 2017; Semyonov & Lewin-Epstein, 2009; Thomas & Moye, 2015). We cannot ignore the influence of fundamental inequality such as wage differences, studies have reported that NHBs and MAs are more likely to have lower incomes than NHWs at the same level of education and employment (Assari & Zare, 2021; Manduca, 2018; Salazar et al., 2019; Zare & Assari, 2021; Zare et al., 2021; Zhang & Wang, 2004). Our findings showed that NHW men had higher PIR (M: 2.78, CI:2.76–2.80), than NHB (M:1.96, CI: 1.94–1.98) and MA (M:1.68, CI: 1.66–1.69), p<.001. At the same time, NHBs (GC:0.355) and MAs (GC: 0.377) experienced higher-income inequality than NHWs (GC: 0.310). See Panel C, Figure 2.
What Is the Impact of Racial Composition and Income Inequality on Health Outcomes?
Studies have reported that racial composition significantly affects health outcomes—even more than income inequality. Income inequality and racial disparities can create psychosocial stress directly harmful to health (Deaton & Lubotsky, 2003). For example, a study reported that NHBs and MAs received lower incomes with equal degrees than NHWs (Zare & Assari, 2021). Pickett and Wilkson (2015) confirmed a causal link between societal income inequality and adverse health using a causal epidemiological framework to conduct a comprehensive review on income inequality and health (Pickett & Wilkinson, 2015). Working to close the gap between high- and low-SES groups is a critical step in improving population health, especially among racial/ethnic minorities (Matthew & Brodersen, 2018; Mode et al., 2016; Pickett & Wilkinson, 2015; Subramanian & Kawachi, 2003).
Literature has identified both direct and indirect mechanisms in which income inequality affects health. Directly, individual-level income is significantly associated with health outcomes (Bor et al., 2017). Low-income individuals suffer poorer health outcomes due to poor access to resources (Graves, 2008), and preventive care, food insecurity (Ross et al., 2007), and housing insecurity (Stahre et al., 2015). Indirectly, income inequality introduces a power dynamic that influences policy priorities to serve the interest of the wealthy (Bor et al., 2017). However, income inequality is not limited to the direct or indirect impacts outlined above. Public health policies, programs, and regulations also play a significant role (Deaton, 2014). Higher levels of income inequality inhibit policy reforms that could address access to health care, environmental regulations, or child health laws (Matthew & Brodersen, 2018).
Differences between men—partially—can be explained by lower physical activities. Our findings followed similar trends of prior literature. For example, Campbell and Baker (2019) reported that income was negatively associated with highly socially integrated men’s weight status but was positively associated with weight status among lower social integration men (Campbell & Baker, 2019).
Healthy Behavior and Obesity
Research has reported that the relationship between income and higher weight status operates differently for men and women (Campbell & Baker, 2019; Zare et al., 2021). Explanations have posited this is due to differences in drinking behavior (Matthew & Brodersen, 2018), engagement in exercise (Pabayo et al., 2018), consumption of healthy foods, and probability of visiting a health care provider (Oksuzyan et al., 2008; Westenhoefer, 2005; Zellner et al., 2007). There are also significant differences in health behaviors by socioeconomic status (SES). Low-SES groups are more likely to smoke, less likely to exercise, and have worse diets (Pampel et al., 2010). Among low-SES groups, adverse health behaviors may represent pleasurable activities to deal with stress (Layte & Whelan, 2009). We found a positive association between obesity and no rigorous or moderate activities in NHW (PR: 1.32, CI: 1.23–1.42) and MA (PR: 1.20, CI: 1.09–1.32). Moreover, poor access to resources hinders the ability to adopt healthy behaviors. Distance to a grocery store is positively associated with higher BMI (Inagami et al., 2006).
There are aspects of the study that deserve comment. For example, this is cross-sectional data; we could not check the possibility of reverse causation or establish temporality. Research reports that extent bias because of reverse causation is mainly indirect (Mehta & Chang, 2012). In addition, there are some limitations with NHANES data to report income variable as a continuous variable but as a categorical variable; otherwise, by using household income as a continuous variable, we could find the impact of income differences instead of a proxy variable PIR. Finally, for this study, we used the NHANES public available data, and we could not control our models for neighborhoods and geo-level analysis. This is the next step in our study.
There are also strengths to this study. To our knowledge, it is the first study to examine the relationship between income inequality and obesity in men based on their race/ethnicity with a wide range of NHANES data (1999–2016). We have used weighted models to make our findings nationally representative estimates.
Conclusions
There is a positive association between PIR and obesity for NHW and NHB men. MAs men have no association between PIR and obesity (BMI ≥30). Our findings contribute to literature which reports that income inequality plays different roles in racial/ethnic groups among men. It highlights the importance of treatment and prevention programs for all men, prioritizing NHBs and MAs in higher obesity classes. Treatment of obesity needs multifunctional teams and interventions to reduce income inequality by reducing racism disparities in payments. It also needs improvements in environments and neighborhoods, easy access to healthy foods, and behavioral changes by doing more exercise and targeting NHBs and MAs.
Footnotes
Acknowledgements
Martin F. Blair provided a great edit to the manuscript.
Author Contributions
Conceptualization: Hossein Zare, Roland J. Thorpe, Jr., Data curation: Hossein Zare; Formal analysis: Hossein Zare; Funding acquisition: Hossein Zare, Roland J. Thorpe, Jr; Methodology: Hossein Zare, Roland J. Thorpe, Jr., Software: Hossein Zare. Validation: Hossein Zare, Roland J. Thorpe, Jr., Writing—original draft: Hossein Zare, Nicholas S. Meyerson, Danielle R. Gilmore, Edit and review the final products; Hossein Zare, Nicholas S. Meyerson, Danielle R. Gilmore, Roland J. Thorpe, Jr.
Declaration of Conflicting Interests
The author(s) declared no potential conflicts of interest with respect to the research, authorship, and/or publication of this article.
Funding
The author(s) disclosed receipt of the following financial support for the research, authorship, and/or publication of this article: This work was supported by the NIMHD U54MD000214, NHLBI 1R25HL126145, and NIA K02AG059140.