
Abstract
Low energy availability (EA) can impair physiological function in athletes. The purpose of this study was to investigate EA status, metabolic status, and bone metabolism with biochemical analysis in Korean male soccer players. Twelve male athletes (18–20 years) completed the study. Body composition and bone mineral density were measured using dual energy X-ray absorptiometry (DXA), while VO2 max was determined by an incremental exercise test. Blood samples were taken for bone marker and hormone analyses. Resting energy expenditure (REE) was measured using the Douglas bag method and predicted using the DXA method. Food diaries and heart rates (HR) during training were recorded, and the Profile of Mood States 2 and Eating Attitude Test 26 were completed. Group differences between low EA (LEA <30 kcal/kg FFM/d, n = 5) and high EA (HEA ≥30 kcal/kg FFM/d, n = 7) were evaluated. The mean EA of the all participants was 31.9 ± 9.8 kcal/kg FFM/d with only two participants having an EA above 45 kcal/kg FFM/d. LEA showed suppressed REE (LEA: 26.0 ± 1.7 kcal/kg/d, HEA: 28.8 ± 1.4 kcal/kg/d, p = .011) with a lower REEratio (LEA: 0.91 ± 0.06, HEA: 1.01 ± 0.05, p = .008) as well as a lower insulin-like growth factor 1 (IGF-1) level (LEA: 248.6 ± 51.2 ng/mL, HEA: 318.9 ± 43.4 ng/mL, p = .028) compared to HEA. There were no group differences in bone markers or other hormone levels. Korean male athletes exhibited low EA status with suppressed metabolism, but there was limited evidence on the effect of EA on bone metabolism, endocrine system, and psychological parameters.
Energy availability (EA) is defined as the amount of energy remaining after exercise for physiological functions. The fundamental physiological functions for cellular maintenance, thermoregulation, growth, and reproduction can be suppressed because of insufficient EA, which can result in health issues (Nattiv et al., 2007).The International Olympic Committee (IOC) published a consensus statement on relative energy deficiency in sport (RED-S) using this etiological background, and it promoted interest and research on the effects of EA in various athletic populations, including male athletes with a high risk of low EA (Mountjoy et al., 2018).Most of the previous studies of EA, however, have been conducted on female, weight-class, and endurance athletes of Caucasian descent, with only a limited number of studies involving subjects of male, different ethnicities, and other sports population. In male, alterations in hypothalamic-pituitary-testicular axis reported in the subjects who had intensive and chronic exercise training (Hackney, 2008). This condition was termed “Exercise Hypogonadal Male Condition (EHMC)” and has been studying in exercising male. Hackney (2020) suggests that the mechanisms of physiological alterations by low EA in female can support the development of EHMC. EA study in male presented the effects of low EA on the alteration of endocrine system, and there were similar responses of low EA in bone turnover markers in female and male (Koehler et al., 2016; Papageorgiou et al., 2017). A previous study on Japanese male runners (19–21 years) has identified that a high risk of having low EA in this populations exists, leading to metabolic suppression and increased bone resorption (Taguchi et al., 2020). Studies on professional female and male soccer players during training period provided the evidences that energy deficiency and low EA can be found in the different sports (Moss et al., 2020; Reed et al., 2014;Russell & Pennock, 2011). These studies can support the IOC consensus statement on RED-S in male athletes with different ethnicities and sports background. However, it still requires more evidences, and there have been no studies on EA status and physiological factors of Korean male soccer players. The purpose of this study was to evaluate the EA status of Korean collegiate male soccer players during training period and to investigate its association with metabolic status, bone metabolism, and hormonal status.
Methods
Participants
Fifteen male Korean collegiate soccer players aged 18–21 years were recruited from a local university team competing in a national university league. During the assessment period, three participants were excluded because of injury and personal reason. Twelve participants (age: 19.1 ± 0.7 years, height: 175.8 ± 5.1 cm, body mass: 69.61 ± 5.79 kg) completed the study. All participants were non-smokers without any health issues and have been exercising for 7–12 years. Each participant was informed of the study design and the risks of the experiment procedures and provided written informed consent. This study was approved by the Human Research Ethics Committee of Waseda University for use of human subjects in accordance with the Declaration of Helsinki (2018-082).
Study Design
This study was a 1-month follow-up observational study during the pre-competition training period. During the initial visit, height, body mass (after first voiding in the morning), medical history, and exercise information (position, exercise history, and current condition) were recorded. Participants visited the laboratory twice for body composition measurement, maximal cardiopulmonary exercise testing, and resting energy expenditure (REE) measurement with blood sampling. After the measurements, participants were asked to record their food diaries and HR during training using a heart rate sensor. Participants filled out questionnaires for assessment of mood status, disordered eating (DE), and eating disorders (ED), and they were interviewed by a registered dietitian for their food diary.
Anthropometric and VO2 max Measurements
Height was measured to the nearest 0.1 cm using a digital stadiometer (BSM 330, Biospace, Seoul, Korea), and body mass was measured to the nearest 50 g using a digital scale (UC-321, A&D Medical, Tokyo, Japan). Total bone mineral density (BMD), percent body fat, fat mass, and fat-free mass (FFM) were assessed using a DXA scanner (Lunar Prodigy Advance with enCORE software version 16, General Electric, Madison, Wisconsin, USA) by a certified technician.
Maximal oxygen uptake (VO2 max) was determined by an incremental test using a bicycle ergometer (Ergomedic 828E, Monark, Varberg, Sweden). After a 3-min rest on the ergometer, participants started exercising, and intensity was increased every 2 min by 30 W until exhaustion. During the exercise, expired air was monitored, and oxygen uptake (VO2), carbon dioxide production (VCO2), and respiratory exchange ratio were measured using a breath-by-breath gas analyzer (Quark b version 10.0, Cosmed, Rome, Italy). HR was monitored by a heart rate sensor and a fitness tracker (H7 and A300 fitness tracker, Polar Electro Oy, Kempele, Finland).
Resting Energy Expenditure
REE was measured by indirect calorimetry using the Douglas Bag method. Participants were asked to restrain from caffeine and alcohol intake, and strenuous exercise 24 hr before the measurement, and they arrived at the laboratory at 7:00 am after an overnight fast. After laying for 20 min in the supine position for acclimatization to room temperature, participants rested while wearing a mask (Hans Rudolph, Kansas, Missouri, USA). Resting HR and body temperature were measured to confirm a resting status. After the confirmation of the resting status, 10 min expired gas sample collections were continued until less than 5% of REE difference between the two samples, and the mean value of two samples was used for analysis (coefficient of variation = 4.2%). VO2 and VCO2 were analyzed using a gas analyzer (AE-100i, Minato Medical Science Co. Ltd, Osaka, Japan), and the volume of expired air was determined using a dry gas volume meter (DC-5A, Shinagawa, Tokyo, Japan). Measured REE (REEm) was determined using the Weir equation: 3.94 × (VO2) + 1.1 (VCO2) (Weir, 1949). Predicted REE (REEp) was calculated using the DXA-predicted method: REEp = 240 × brain + 13 × skeletal muscle + 4.5 × adipose tissue + 2.3 × bone + 43 × residual mass (Hayes et al., 2002). The ratio between REEm and REEp (REEratio = REEm/REEp) was calculated to evaluate energy metabolism status, and participants were considered to have metabolic suppression when the REEratio was less than 0.94 (Staal et al., 2018; Strock et al., 2020).
Blood Analysis
Blood samples were drawn after REE measurements via the antecubital vein in a sitting position by a certified nurse. Serum C-terminal telopeptide of type 1 collagen (s-CTx), follicle stimulating hormone (FSH), luteinizing hormone (LH), estradiol, triiodothyronine (T3), and cortisol were assessed via an electrochemiluminescence immunoassay method, and serum bone alkaline phosphatase (s-BAP), IGF-1, and growth hormone (GH) were assessed via a chemiluminescent immunoassay method. Leptin was assessed via a radioimmunoassay, and testosterone was assessed via a chemiluminescent microparticle immunoassay. All blood sample analyses were conducted in the clinical laboratory (GC Labs, Yongin, Korea). Reference values were provided from the analysis laboratory.
Exercise Energy Expenditure
Exercise energy expenditure (EEE) was determined by the FLEX-HR method (Leonard, 2003). The same HR monitors and fitness trackers used for VO2 max measurements were used for minute-by-minute HR records during training. VO2 and VCO2 were estimated by applying the mean HR per minute to an individual HR-VO2 and HR-VCO2 regression equation from the VO2 max measurement, and energy expenditure was calculated using the Weir equation (Weir, 1949). The net EEE was calculated by subtracting REE during exercise.
Energy Intake
Energy intake (EI) was assessed from 7-day food records with digital photography and nutrition information on food packets. Participants were instructed to record all consumed foods and beverages using the provided cooking scale (SD-004, Tanita, Tokyo, Japan), as well as including time of day, location, and meal type. Photographs of consumed foods and beverages were taken with a 15-cm ruler. The dietary records and photos were checked through an interview and analyzed by a registered dietitian, who is one of the authors of this paper (SL), using the Computer Aided Nutritional Analysis Program (CAN-Pro 5.0, The Korean Nutrition Society, Seoul, Korea).
Energy Availability
EA was determined as EI minus EEE relative to FFM in kilograms: (EI kcal/d – net EEE kcal/d)/FFM kg (Taguchi et al., 2020). Participants who exhibited <30 kcal/kg FFM/d of average EA were considered to have low EA. Participants were then categorized into two groups with low EA (LEA, n = 5) and high EA (HEA, n = 7).
Questionnaires
During their last visit to the laboratory, participants answered the Profile of Mood States 2 (POMS-2) and Eating Attitude Test 26 (EAT-26) for the evaluation of mood disturbances, ED, and DE (Mountjoy et al., 2018). The total mood disturbance score and subscale scores were assessed to analyze mood disturbances. EAT-26, which was translated and validated for Korean, was used to screen the ED and DE of participants (Kang et al., 2006; Logue et al., 2018). A total score of 19 or above was considered to be DE, while a score from 15 to 18 was considered to be at risk for early stage of DE (Rhee et al., 1998).
Statistical Analysis
IBM SPSS statistics (Version 26, IBM, Somers, New York, USA) was used for statistical data analysis. Normally distributed data were presented as mean ± SD, while non-normally distributed data were presented as medians and interquartile ranges (IQ 25 and 75). An independent t-test (normally distributed data) and Mann-Whitney U test (non-normally distributed data) were used to evaluate the differences between LEA and HEA groups. For all tests, statistical significance was set at p < .05.
Results
The descriptive characteristics of the 12 participants who completed the study are presented in Table 1. There were no differences in age, height, body mass, BMI, BMD, body fat, and VO2 max between LEA and HEA. LEA showed a significantly higher FFM than HEA (LEA 63.2 ± 4.5 kg, HEA 57.9 ± 3.2 kg, p = .037).
Descriptive Characteristics of the Participants.

Note. Normally distributed data were presented as mean ± SD, and non-normally distributed data were reported by median (interquartile range). BMI = body mass index, FFM = fat-free mass, BMD = bone mineral density.
The mean EA and REE-related parameters are presented in Table 2. The mean EA of all participants (31.9 ± 9.8 kcal/kg FFM/d) was above the cut-off value (30 kcal/kg FFM/d), but LEA showed a significantly lower EA than HEA (LEA 22.4 ± 2.9 kcal/kg FFM/d, HEA 38.7 ± 6.6 kcal/kg FFM/d, p = .000). There were only two participants who had an EA above 45 kcal/kg FFM/d in HEA. HEA showed a significantly higher EI (LEA 3,114 ± 297 kcal/d, HEA 3,701 ± 348 kcal/d, p = .012), REE/FFM (LEA 26.0 ± 1.7 kcal/kg/d, HEA 28.8 ± 1.4 kcal/kg/d, p = .011), and REEratio (LEA 0.91 ± 0.06, HEA 1.01 ± 0.05, p = .008) than LEA. The participant with the lowest REEratio (0.84) had the lowest EA (18.7 kcal/kg FFM/d). There was no difference in EEE between the groups.
EA and REE-Related Parameters of the Participants.
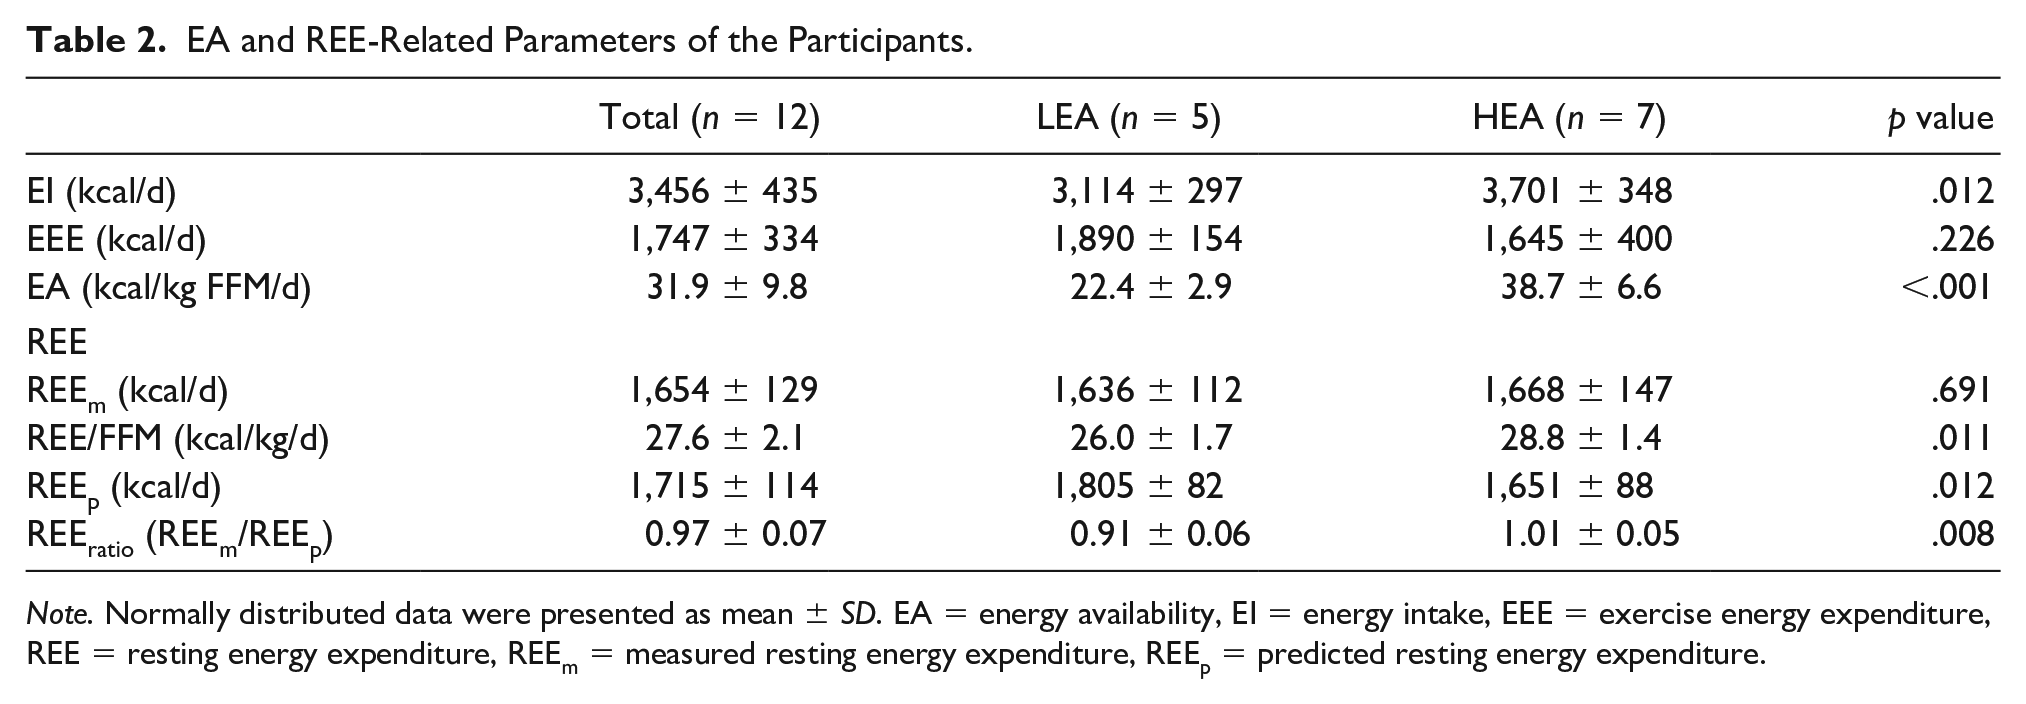
Note. Normally distributed data were presented as mean ± SD. EA = energy availability, EI = energy intake, EEE = exercise energy expenditure, REE = resting energy expenditure, REEm = measured resting energy expenditure, REEp = predicted resting energy expenditure.
The blood analysis results are presented in Table 3. Both groups showed increased bone turnover markers compared to the reference values, but there was no significant difference between groups. LEA had higher FSH levels than HEA (LEA 5.50 ± 1.01 mIU/mL, HEA 3.64 ± 1.41 mIU/mL, p = .031), but there was no significant difference in LH levels between groups. Both groups showed increased testosterone and GH levels without any difference between groups. LEA had lower IGF-1 levels than HEA (LEA 248.6 ± 51.2 ng/mL, HEA 318.9 ± 43.4 ng/mL, p = .028). There were no significant differences in cortisol, T3, and leptin levels between groups.
Bone Turnover Markers and Hormone Levels of the Participants.

Note. Normally distributed data were presented as mean ± SD, and non-normally distributed data were reported by median (interquartile range). s-BAP = serum bone alkaline phosphatase, s-CTx = serum C-terminal telopeptide of type 1 collagen, FSH = follicle stimulating hormone, LH = luteinizing hormone, GH = growth hormone, IGF-1 = insulin-like growth factor 1, T3 = triiodothyronine.
The POMS-2 and EAT-26 results are presented in Table 4. No significant difference was presented in the total scores of the POMS-2 result between the groups as well as in the subscales except friendliness. None of the participants showed ED and DE according to EAT-26 results, and there was no significant difference between groups.
POMS-2 and EAT-26 Scores of the Participants.

Note. Normally distributed data were presented as mean ± SD, and non-normally distributed data were reported by median (interquartile range). POMS-2 = profile of mood states 2, EAT-26 = eating attitude test 26.
Discussion
To the best of our knowledge, this study is the first study to investigate EA status and related parameters in Korean male soccer players. In this study, the mean EA of all participants was 31.9 ± 9.8 kcal/kg FFM/d, with 5 out of 12 participants (41.7%) showing <30 kcal/kg FFM/d and only 2 participants showing an EA higher than 45 kcal/kg FFM/d. Participants with low EA exhibited metabolic suppression, and lower REEratio (<0.94) as well as REE/FFM. The presence of metabolic suppression and low EA status can affect bone metabolism and hormonal status, especially in endurance, weight category, and aesthetic athletes. However, the current study shows that the effects of low EA can vary depending on the sport and population group.
Energy Availability Status
In this study, 83% of the participants had an EA lower than 45 kcal/kg FFM/d, with more than 40% having an EA lower than 30 kcal/kg FFM/d. Although the prevalence of low EA was high, the mean EA of all the participants was 31.9 kcal/kg FFM/d, which was higher than 30 kcal/kg FFM/d. Previous studies have reported that endurance athletes were identified to have a higher prevalence (63%) of low/reduced EA (<45 kcal/kg FFM/d) than other athletes in different sports (36%) (Melin et al., 2015). The participants of the current study were team sport (soccer) players and the prevalence of low EA was 83%, which was higher than the previous study. Studies on male athletes with a high risk of low EA reported that the mean EA of male cyclists were 8 and 20 kcal/kg FFM/d while that of jockeys was 12 kcal/kg FFM/d (Dolan et al., 2011; Viner et al., 2015; Vogt et al., 2005). A comparison study among various sport groups has reported that the mean EA of male athletes in ball sports was 27.5 kcal/kg FFM/d, but there was no difference compared to endurance sports (26.9 kcal/kg FFM/d) and weight-class sports (24.9 kcal/kg FFM/d) (Koehler et al., 2013). The mean EA of the current study was 31.9 kcal/kg FFM/d, which was relatively higher EA than the previous studies involving male athletes. All the participants stayed in the University dormitory and had the same food menus and training schedules. Individual differences may have been due to the participants’ additional individual training and snack consumption. The high prevalence of low EA can be explained by the high amounts of scheduled team training. On the other hand, the low severity of reduced EA can be explained by the scheduled meals with the additional intakes from 24/7 delivery foods and a convenience store in the dormitory which could increase the accessibility of snacks. Athletes’ energy intakes and expenditures are largely affected by their environments (Mountjoy et al., 2018). These environmental factors should be taken into consideration when monitoring and/or controlling the energy status of athletes in free-living conditions.
Energy Availability and Metabolic Suppression
The IOC consensus statement on RED-S introduced the risks of low EA in athletes, with many studies presenting dysfunction of physiological systems due to metabolic suppression by low EA (Mountjoy et al., 2018). In this study, LEA showed lower REE/FFM (26.0 kcal/kg/d vs 28.8 kcal/kg/d) and REEratio (0.91 vs 1.01) than HEA. Many studies on metabolic suppression in athletes have reported its relationship with insufficient energy intake and excessive exercise. In female athletes, the participants with low EA (19.1 kcal/kg FFM/d) exhibited suppressed metabolisms compared to the participants with optimal EA (51.7 kcal/kg FFM/d); having an RMRratio 0.87 vs 0.93, respectively (Melin et al., 2015). Research on male cyclists reported a reduction of absolute (kJ/d) and relative RMR (kJ/kg FFM) after 6-week of being in an energy deficit status (Woods et al., 2018), while the previous study on Japanese male endurance runners reported low EA (18.9 kcal/kg FFM/d) with suppressed REE/FFM (26.4 kg/FFM/d) (Taguchi et al., 2020). These studies support the association between low EA and metabolic suppression, which was also presented in the current study. Metabolic suppression resulting from low EA can be explained by adaptive mechanisms for preserving essential energy, with these possibly resulting in various physiological dysfunctions which can increase risks of negative health and performance consequences in athletes (De Souza et al., 2019a; Mountjoy et al., 2018). Monitoring and diagnosis of athletes’ metabolic status using REE and EA are important to prevent the physiological dysfunctions. For the evaluation of metabolic suppression, De Souza et al. (2007) was the first to present the concept of REEratio in athletes and calculated predicted REE using the Harris-Benedict equation (Harris & Benedict, 1918). Other studies, however, assessed REEratio using different methods, such as organ tissue assessment or the Cunningham equation (Taguchi et al., 2020; Torstveit et al., 2018), with the accuracy and validity of the methods differing depending on the population groups (Kim et al., 2015; Taguchi et al., 2011). Study on exercising women suggested that RMRratio can be an alternative method to assess the energy status (Strock et al., 2020). Since there are limited studies on metabolic suppression and REEratio in Asian male athletes, further research on the precise monitoring and assessment of metabolic status are needed.
Energy Availability and Bone Markers
In this study, the participants showed high bone absorption (s-CTx 0.93 ng/mL) and bone formation markers (s-BAP 23.9 μg/L) without low BMD (1.384 g/cm2), and there was no association between bone markers and EA. Previous studies on athletes reported decreased bone metabolism and BMD related to low EA. In exercising women, energy deficiency was associated with decreased osteocalcin (De Souza et al., 2008), while a study on male athletes reported a 15% decrease in N-terminal pro-peptide of type 1 collagen levels after 3-day of 50% energy restriction (Zanker & Swaine, 2000). Prolonged energy deficiency can result in hypothalamic and/or hypogonadal status as well as altered hormonal levels, which can increase abnormal bone remodeling (Hackney, 1996; Nattiv et al., 2007). Bone quality and structure, however, are can vary according to the type of exercise done by athletes (De Souza et al., 2019b). In a comparison study between different sports groups, skiers and soccer players exposed to loading environments showed 28%–38% higher failure load indicating stronger bone at the distal tibia than swimmers (Schipilow et al., 2013), which identified that osteogenic stimuli such as weight-bearing activity can have protective effects on bone. This may explain the results of the current study, which found that high BMD co-occurred with low EA in male soccer players. A high prevalence of bone stress injuries in male athletes has been reported (De Souza et al., 2019b), but the effects of energy deficiency on bone metabolism can be clearly understood with consideration of continuous and complex nature of bone remodeling.
Energy Availability and Endocrine Markers
In this study, there was no suppression of reproductive hormone levels regardless of EA status, and among the metabolic hormones, only IGF-1 levels were lower in LEA than in HEA. Previous studies in men and women reported that an energy deficit could result in a suppressed endocrine system, leading to suppressed hypogonadal conditions and metabolic hormone levels (Geesmann et al., 2017; Hackney, 2008; Kraemer et al., 2008; Loucks & Thuma, 2003; Loucks et al., 1998). A cross-over study, involving male using EA of 15 and 40 kcal/kg FFM/d for interventions, reported that there were no differences in reproductive and metabolic hormones between groups except for leptin (Koehler et al., 2016). A similar study using EA of 15 and 45 kcal/kg FFM/d did not identify any differences in the hormone levels of male participants (Papageorgiou et al., 2017). The present study found that low EA had no effects on endocrine system. The participants with low EA had lower IGF-1 levels in this study. Other studies have reported male athletes to be at a high risk for endocrine system suppression (De Souza et al., 2019a). Notably, male athletes have different reproductive mechanisms and susceptibilities to energy deficiency and thus, the current cut-off value (<30 kcal/kg FFM/d) may not be appropriate to identify the clinical signs of reproductive suppression as well as the symptoms of suppressed metabolic status due to low EA and/or excessive training (De Souza et al., 2019a; Hackney, 2020). Further studies are required to identify the cut-off value for male and assess the effects of energy deficiency on hormonal status to prevent reproductive dysfunction and metabolic suppression in male athletes.
This study is the first study to investigate the EA status of male athletes in Korea using recognized methodologies and biochemical analysis, but there are several limitations. The study involved a small number of participants given that it was an observational research. The limited experimental period restricted the frequency of biochemical analysis, and the lack of evidence for validation of POMS-2 in Korean could affect the results. Estimation of EI was relied on the analysis of food records which can have under- and over-reporting of the participants, and the complexity and variety of food ingredients in Asian culture make it difficult to access the EI of the free-living participant. To reduce the error in EI estimation, we implemented the weighed dietary records with photo records using smart phone. Despite the limitations, this study can provide evidence to understand low EA in male athletes and help promote heightened interest in EA research in Asian countries.
The main finding of this study was a high prevalence of low EA and inadequate mean EA levels, which were associated with metabolic suppression in Korean male athletes. However, EA had no effect on bone metabolism, reproductive hormones, or psychological parameters. In conclusion, low EA can cause metabolic suppression without leading to changes in bone metabolism and hormonal status in Korean male soccer players. For future studies, inclusion of larger number of participants involving different population groups and the developments in various methodologies for assessment and longitudinal monitoring of the EA of male athletes involved in various sports types, are recommended.
Footnotes
Acknowledgments and Credits
We thank to the participants, coaches, and staffs of Yongin University for being supportive on this study. In addition, we acknowledge Mizuki Kato and Okumura Koichiro for their assistance in data collection. All authors contributed to the edits and revisions of this article with the outline and majority of the article shared between SL and MT. Initial study was designed by MT, MK, and SL. SH and TO conducted recruitment and arrangement of laboratory. SL, MK, and SH carried out the study implementation and SL analyzed the data.
Declaration of Conflicting Interests
The author(s) declared no potential conflicts of interest with respect to the research, authorship, and/or publication of this article.
Funding
The author(s) disclosed receipt of the following financial support for the research, authorship, and/or publication of this article: This study was funded by Waseda University Grants for Special Research Projects (“Tokutei Kadai”) in 2018.