
Abstract
The average life expectancy has increased and despite a distinct feminization of aging, the number of older males continues to grow. Physical activity has a positive effect on health and helps to slow down the negative consequences of aging. The aim of the study was to evaluate possible relationships between physical fitness, physical activity and type of work during occupational activity among retired men (aged ≥65 years), no longer professionally active. The study included 104 men (aged from 65 to 90 years), further stratified into blue- and white-collar groups (66 and 38 subjects, respectively). The International Physical Activity Questionnaire (IPAQ) was used to assess their physical activity levels. Physical performance was assessed using the Short Physical Performance Battery test (SPPB) and handgrip strength (HGS) measurement. Geriatric Depression Scale (GDS) was used to identify the risk for depression. Mean physical activity in the study population was moderate in almost 70%, high in 19% and low in 11% of the subjects. Men with high physical activity levels had better SPPB and GDS scores (p = .01 and p = .001, respectively). In the blue-collar group, the IPAQ scores were lower than in the white-collar group, although the differences were statistically insignificant. The SPPB scores and mean HGS for the dominant hand were similar in both groups. Occupational physical activity should not substitute other forms of physical activity. Regardless of the type of work performed before retirement, the men obtained similar results in terms of their physical activity.
Demographic changes all over the world are the reason why recent years have seen a notable increase in the attention paid to geriatrics. Older adults constitute the largest part of the society both in Europe and North America. It has been estimated that people over the age of 65 will make up 29.1% of the entire European Union population by 2080, as compared to 19.4% in 2017 (Eurostat. Statistics Explained). In light of the fact that the average life expectancy has increased and despite distinct feminization of aging, which is described as a tendency for women to outlive men (Davidson et al., 2011), the number of older males continues to grow. Moreover, the number of older women and men is projected to become equal. In 2017, men aged ≥60 and ≥80 years constituted 46% and 39% of the general population, respectively, whereas in 2050 they are expected to make up 47% and 42% of the general population, respectively (United Nations, Department of Economic and Social Affairs, Population Division, 2017).
The process of aging is associated with inevitable changes in the physical, mental and social spheres. The locomotor system is adversely affected, which often hinders the independent daily functioning. Limited motor functioning among older adults is frequently associated with sarcopenia, which is defined as loss of muscle mass and strength and deteriorated muscle function (Santilli et al., 2014). A decrease in muscle mass is observed already in the third decade of life, but the process rapidly increases over the age of 50 (Janssen et al., 2000). According to the European Working Group on Sarcopenia in Older People, sarcopenia is diagnosed in 10% of people between the ages of 60 and 70, and as many as 50% over the age of 80 (Cruz-Jentoft et al., 2010). The diagnosis is confirmed when low muscle quantity or quality is detected using physical performance tests, with the Short Physical Performance Battery (SPPB) test being recommended to measure gait speed, as well as lower extremity strength and endurance (Cruz-Jentoft et al., 2010). The hand grip strength (HGS) may be evaluated using the hand grip hydraulic dynamometer to measure the loss of muscle strength. HGS depends on patient age, sex, nutritional status, concomitant diseases and mental condition. Among older adults, it may be useful to assess the risk for limited functioning dexterity, postoperative complications, repeat hospitalization and even premature death (Bohannon, 2001, 2008; Norman et al., 2011). The test is easy-to-use, inexpensive and noninvasive, as well as reliable and applicable, which makes it a popular screening tool (Massy-Westropp et al., 2011).
The process of aging is irreversible and much attention has been paid to ways of preventing its negative consequences. Initiatives aimed at maintaining both independence for as long as possible and the highest achievable quality of patient life are crucial. The quality of patient life among older adults, regardless of sex, is significantly associated with the preservation of functioning dexterity (Lyu & Wolinsky, 2017), mental health and the socio-economic status (Knurowski et al., 2005).
Physical activity has a positive effect on the health and quality of life of older people (Galloza et al., 2017). It helps to maintain normal body weight, reduces the risk for cardiovascular diseases, type II diabetes (Reiner et al., 2013), sarcopenia (Steffl et al., 2017) and protects against the onset of depression (Harvey et al., 2018), and positively affects cognitive functions (Sofi et al., 2011). It is also considered to be a factor reducing the risk of death in that age group (Fox et al., 2015). Mijnarends et al. (2016) investigated the relationship between physical activity and the prevalence of sarcopenia over a 5-year period. Their study included 2,309 people at the age of 66–93 years. The prevalence of sarcopenia was 7.3% at the beginning of the observational period and 16.8% during the observation. The prevalence of sarcopenia over a 5-year period was 14.8% among the least and 9.0% among the most active subjects. These authors demonstrated that higher moderate–vigorous physical activity (MVPA) prevents the development of sarcopenia.
According to the World Health Organization (2018), people aged ≥65 years should undertake 75 min of vigorous-intensity aerobic physical activity throughout the week, or 150 min of moderate-intensity aerobic physical activity throughout the week, or an equivalent of a combination of both types of these activities. WHO also recommends muscle-strengthening activities twice a week and balance exercises at least three times a week for people with reduced mobility. If, however, personal health poses some limitations, physical activity should be adjusted individually, but done at the highest level possible for a given person. Physical activity includes not only physical exercise or targeted sports activities but also any locomotor activity associated with occupation, home or hobby. To the best of our knowledge, only a few authors investigated the link between occupational activity and physical activity, both during the years of occupational activity and after retirement. Some sources reported an increase in physical activity within the first few years of the retirement (Evenson et al., 2002). Fukushima et al. (2018) assessed physical activity in a group of white- (n = 54) and blue-collar (n = 48) workers in a Japanese manufacturing plant. In order to measure their physical activity levels, the workers were asked to carry an accelerometer for five working days. Accelerometer-measured activity levels were categorized as sedentary behavior (SB) (≤1.5 (Metabolic Equivalent of Work MET), light-intensity physical activity (LPA) (1.6-2.9 MET) and MVPA (≥3.0 MET). A sedentary bout was defined as consecutive minutes during which the accelerometer registered less than ≤1.5 METs. During the working hours, white-collar workers spent significantly more timer in SB and less time in LPA than blue-collar subjects. No statistically significant differences were found with regard to MVPA during the working hours. In turn, leisure time SP, MPVA and LPA were similar in both groups, which demonstrate that white-collar workers do not undertake additional physical activity to compensate for SB during the working hours.
Objectives
The aim of the study was to evaluate the possible relationship between physical fitness, physical activity and type of work during occupational activity among retired men (aged ≥65 years), no longer professionally active.
Material and Methods
The study was conducted in Poland among 104 male city-dwellers, aged from 65 to 90 years. The inclusion criteria are presented in Figure 1. Cognitive functioning was assessed with the Mini-Cog test (Seitz et al., 2018). The test involves asking patients to recall three words after drawing a picture of a clock. The maximum number of points is 5 (3 for the memory task and 2 for a correct drawing of the clock, with an hour marked). Permission to use the Mini-Cog test was obtained. The type of the occupational activity before retirement was determined using direct interviewing. The subjects were classified into the blue- and the white-collar groups (n = 66 and n = 38, respectively) according to the International Standardized Classification of Occupations (ISCO-08) (Fukushima et al., 2018). The blue-collar group included men who had worked as mechanics, farmers, builders and electricians, whereas the white-collar group comprised office workers, accountants, physicians, engineers and academics. Additionally, the parameters were analyzed in two different age groups: <75 and ≥75 years. Each participant was examined by the same investigator. Written informed consent was obtained from all participants. The study was conducted between November 2018 and June 2019, in accordance with the Declaration of Helsinki. The Ethics Committee of the Poznan University of Medical Sciences in Poznań approved the study protocol (No. 995/18).

Study design.
The short Polish version of the International Physical Activity Questionnaire (IPAQ) was used to assess the levels of physical activity (Biernat et al., 2007). IPAQ, being a self-report tool, is an inexpensive, fast and easy method of measuring physical activity. The questionnaire includes seven questions regarding all types of physical activity lasting at least 10 min at a time, as well as sedentary time. The subjects report the number of days in the last week and the amount of time a day they engaged in physical activity. In the questionnaire, physical activity is divided into three types: high, moderate and low. High physical activity includes vigorous-intensity activities – that is causing very fast breathing and very fast heartbeat, moderate physical activity – moderate-intensity activities described as the ones causing a slightly faster breathing and speeding up the heartbeat and low physical activity – that is activity related to walking. The IPAQ scores are expressed in MET/minute/week. Different types of physical activity are assigned different MET values: 3.3 for “walking,” 4 for “moderate” and 8 for “vigorous” activity. Expressing a given activity in MET/minute/week, the value of the coefficient is multiplied by the number of days in which it is performed and by its average duration. The weekly score for a given patient is presented by summing the scores of each type of activity. Based on that, the respondents can be classified into three groups according to their level of physical activity, as presented in Table 1.
Interpretation of the SPPB Results.

Physical performance was assessed using the SPPB test. The test consists of three tasks: rising from a chair and sitting down with five repetitions, a hierarchical test of balance and a short walk at usual pace. Each SPPB component is scored from 0 to 4, with 0 representing the inability to perform the test and 4 representing the highest category of performance (SPPB scoring is presented in Tables 2 and 3). The maximum number of points is 12 and indicates the best body function (Gómez et al., 2013).
Performance Classification Based on the SPPB Score.

Classification of Physical Activity Levels Based on the Weekly Scores of the International Physical Activity Assessment Questionnaire expressed in MET/min/week.

The HGS was tested using the JAMAR hydraulic dynamometer. The measurements were performed in accordance with the recommendations of the American Society of Hand Therapists (ASHT) (Roberts et al., 2011). During the measurements, the subject was sitting in a chair without a backrest and armrests, with feet resting on the floor, parallel to each other, hip and knee joints set at right angles, arms adducted and touching the torso, elbow joint bent to 90o, forearm in a neutral position, wrist straightened in the range of 0o to 30o. The subject performed a maximum handgrip and held it for 6 s. Each of the hands was tested three times, with a 1-min break between each measurement. The best result was used for further analysis. The result of ≥27 kg was considered as the reference value, in accordance with the European Working Group on Sarcopenia in Older People 2 guidelines (Cruz-Jentoft et al., 2019).
The short form (15 questions) of the Geriatric Depression Scale (GDS) was employed to identify the risk for depression. A threshold score of 5 points indicates an increased risk for depression (Yesavage et al., 1982).
The body mass index (BMI) value was calculated based on the height and weight measurements. Interpretation of the index was made after taking into account the correction for age. For the subjects aged ≥65 years, BMI of 23–28 was accepted as the norm (National Research Council Committee on Diet and Health, 1989).
Statistica 12 was used for statistical analysis. The Shapiro–Wilk test was applied to check normality of the distribution. For nonnormal distribution, the results were presented as mean (m), standard deviation (SD), media (M) and range of the evaluated parameters (R). ANOVA rang Kruskal–Wallis test was used to check the differences in age, BMI, SPPB, GDS and HGS among men with low, moderate and high physical activity. The difference between the type of work was calculated using the chi-square test. The Mann–Whitney test for independent variables was used to test for differences between the white- and the blue-collar scores for HGS, SPPB, GDS, IPAQ and BMI. Spearman’s nonparametric correlation was used to determine the relationship (correlation) between IPAQ and HGS scores, SPPB test, GDS, age and BMI. The p-value of <.05 was considered as statistically significant.
Results
Patient characteristics and the results for the groups, stratified on the basis of the IPAQ scores, are presented in Table 4. Mean physical activity in the entire study population was 1983 ± 1227 MET: moderate in almost 70% (n = 72), high in 19% (n = 20) and low in 11% (n = 12) of the subjects. Mean BMI was higher in men who reported low physical activity. BMI among the men with high physical activity was statistically significantly lower as compared to those with low physical activity (p = .012). Men with high physical activity obtained statistically significantly better results in the SPPB test, in each of the three components (p = .01). Similarly, the lowest GDS scores for the risk of depression were observed among the subjects with high physical activity (p = .001). The differences in the HGS scores among the men with low, moderate and high physical activity were not statistically significant.
Characteristics of the Study Population .

Note. m, mean; SD, standard deviation; M, media; BMI, body mass index; SPPB, Short Physical Performance Battery; S, chair stand test; B, balance test; W- walk test; GDS, Geriatric Depression Scale; IPAQ, International Physical Activity Questionnaire; HGS, hand grip strength.
Comparison of moderate physical activity group and low physical activity group.
Comparison of moderate physical activity group and high physical activity group.
Comparison of high physical activity group and low physical activity group.
Chi-square test for comparison of many groups of nominal variables.
The study population was divided into white- and blue-collar workers, depending on the type of occupation reported during interviewing. Blue-collar workers constituted the majority of the study population and their IPAQ scores (1865 ± 1190 MET) were not statistically significantly different as compared to the white-collar workers (2189 ± 1279MET). The SPPB scores (median 11, range 1–12) and mean HGS for the dominant hand were similar in both groups (34 ± 7 kG and 32 ± 9 kG, respectively). The results for both age groups among the white- and the blue-collar workers are presented in Table 5. Risk for depression was higher in the older group as compared to their younger peers (p = .013). The groups also differed with regard to physical activity, with the younger group demonstrating higher IPAQ scores (p = 0). In the younger group, the HGS scores for the nondominant hand were statistically significantly higher among the blue-collar workers (p = .013), and the GDS scores were statistically significantly higher among the white-collar workers (p = .044). In the older group, statistically significant differences were observed for the IPAQ scores, with higher scores for the white-collar group (p = .040). The HGS scores were lower in 18% (19 subjects; 8 from the white- and 11 from the blue-collar workers) of the respondents. In the group with normal HGS, the IPAQ scores were significantly higher as compared to the lowered HGS (p = .009).
Results of the White- and Blue-Collar Workers in Different Age Groups.
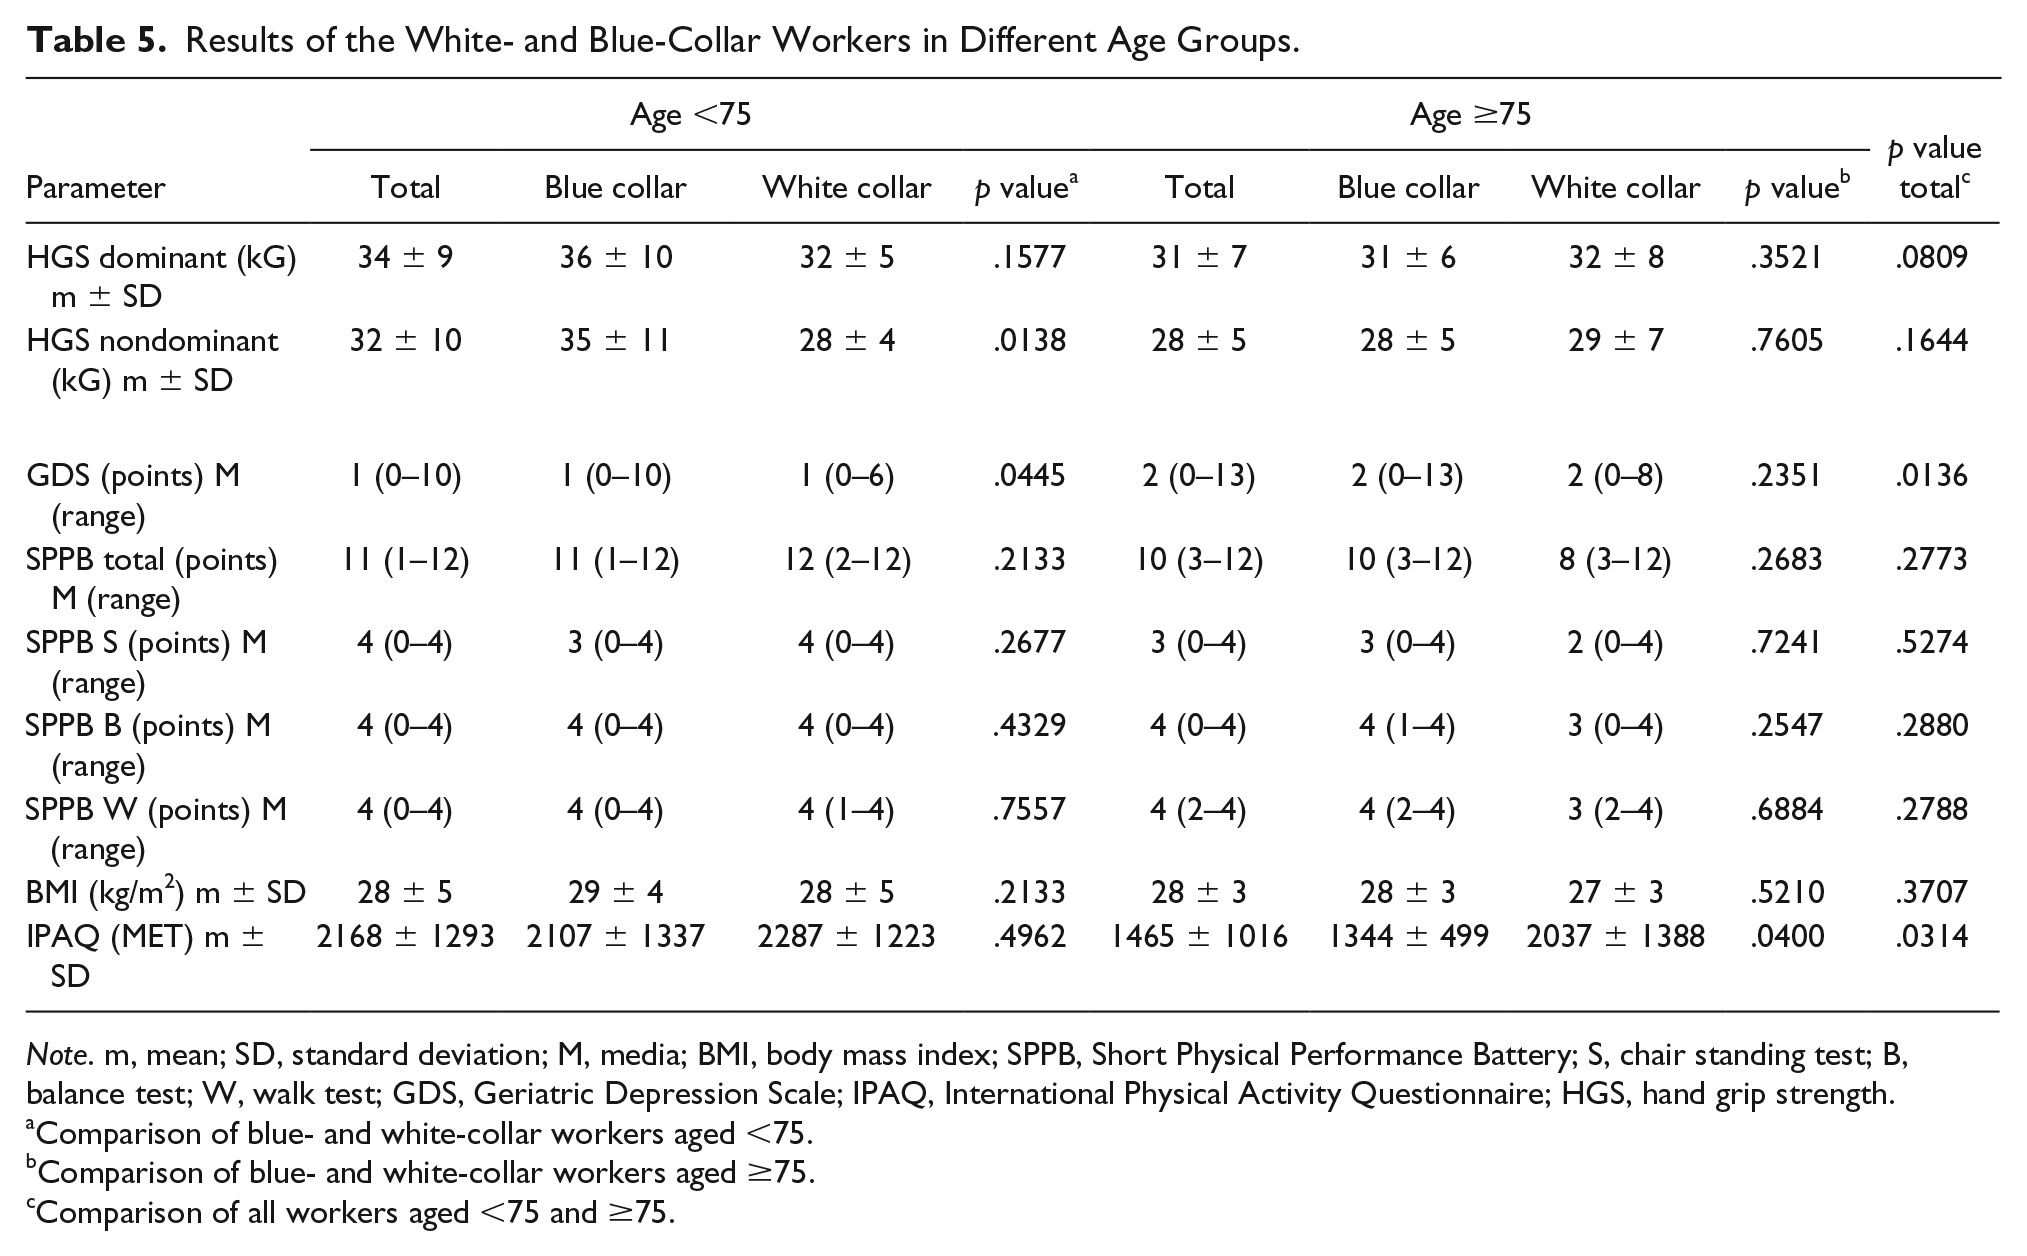
Note. m, mean; SD, standard deviation; M, media; BMI, body mass index; SPPB, Short Physical Performance Battery; S, chair standing test; B, balance test; W, walk test; GDS, Geriatric Depression Scale; IPAQ, International Physical Activity Questionnaire; HGS, hand grip strength.
Comparison of blue- and white-collar workers aged <75.
Comparison of blue- and white-collar workers aged ≥75.
Comparison of all workers aged <75 and ≥75.
A positive correlation was found between the IPAQ scores and the nondominant and dominant HGS, as well as the scores for each of the SPPB components. A negative correlation was found between the IPAQ scores and GDS. The observed correlations are presented in Table 6.
Correlations of the IPAQ Scores with the Investigated Variables.
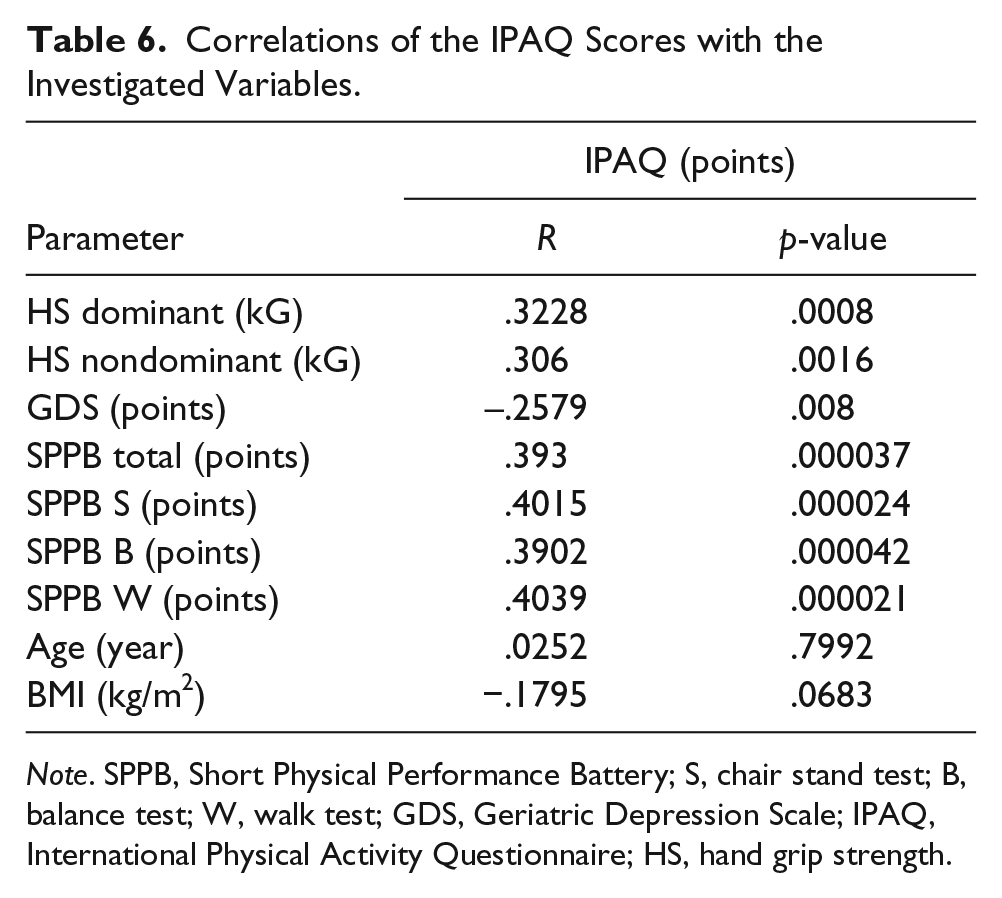
Note. SPPB, Short Physical Performance Battery; S, chair stand test; B, balance test; W, walk test; GDS, Geriatric Depression Scale; IPAQ, International Physical Activity Questionnaire; HS, hand grip strength.
A positive correlation was detected between HGS and lower limb strength, measured with the SPPB five-time sit-to-stand from the chair test (dominant hand p = .0033, R = .2852; nondominant hand p = .0027, R = .2916).
Discussion
The literature offers numerous studies on the effects of physical activity on health and quality of life, especially among women (Caputo & Costa, 2014; Carrasco Poyatos et al., 2016; Ogwumike et al., 2016). Only a very limited number of authors have analysed the relationship between the type of occupational activity and health condition among the retired men. This study investigated male retirees, no longer professionally active, and identified that most subjects achieved the norms for physical activity levels recommended by the WHO. No statistically significant differences were reported between white- and blue-collar workers in terms of lower limb strength, balance, gait speed and HGS.
Mein et al. (2005) in phase 5 of the Whitehall II longitudinal study analyzed the relationship between occupational activity and physical activity among 6224 healthy retired civil servants, aged 45–69, who continued working part-time. The participants completed a questionnaire and the results were calculated in MET units. These authors reported that working full-time was associated with lower than recommended physical activity levels among middle-aged subjects from the white-collar group and that retirement or part-time employment had a positive effect on physical activity by increasing physical activity levels. In the present study, mean physical activity level (IPAQ) was moderate for most retirees and high for one-fifth of the respondents. No differences in the IPAQ scores were found between white- and blue-collar workers. The physical activity level in the entire group of retirees <75 years of age was higher than in their older peers, regardless of their employment history. As far as the group of retirees ≥75 years of age is concerned, higher physical activity was detected among the white-collar workers.
Dodds et al. (2013) investigated the relationship between muscle strength and physical activity, especially leisure-time physical activity (LTPA). These authors found that higher levels of LTPA in midlife were associated with higher HGS at the age of 60–64, both among women and men. As these relationships emerge at the age of ≥53 years, they suggested that LTPA initiated in adulthood may prevent deteriorating HGS among older people. As no statistically significant differences in HGS of white- and blue-collar groups were observed in the present study, men should be educated about the necessity of engaging in LTPA, regardless of their professional background. In this study, retirees aged <75 years who were no longer professionally active demonstrate higher physical activity as compared to their older peers. No statistically significant differences in HGS scores were observed between the subjects aged <75 and ≥75 years.
HGS allows to evaluate the general health status and mobility among older adults (Bohannon, 2008). Lower HGS is typically associated with limited mobility as well as the ability to perform daily activities. Sternäng et al. (2014) investigated the relationship between risk factors during certain phases of life (e.g., in early midlife, in late midlife and in old adulthood) and HGS, separately for men and women. Their study demonstrated that HGS as well as lower limb strength correlate with physical activity among older males. In the case of men, age, marital status, mean arterial pressure, physical activity at work and chronic diseases affected HGS. The findings of Sternäng et al. (2014) are consistent with the positive correlation between physical activity levels and lower extremity strength which was observed in the present study, as well as HGS of the nondominant hand in the younger blue-collar group, which was statistically significantly higher as compared to the white-collar group.
Chan et al. (2014) investigated a group of 764 older adults (68.2 % women, median age 83) and compared lower limb quadriceps strength and HGS versus the risk for hospitalization, deteriorated quality of life and disability. Their results are similar to the findings of this study. Both studies demonstrated a slight, although statistically significant, correlation between HGS and lower extremity strength, measured with the SPPB five-time sit-to-stand from the chair test in this study. Also, Chan et al. (2014) indicated that the combined weakness of the quadriceps and handgrip identified a subpopulation of older adults who present with the poorest health scores, which might be predictive of negative health-related incidents among those populations.
The prevalence of sarcopenia increases with age. HGS and SPPB are the recommended tools to assess sarcopenia. In this study, both HGS and all components of the SPPB test correlated with physical activity among men. Physical activity may slow down the speed of muscle loss, and, in consequence, the development of sarcopenia. Mijnarends et al. (2016) demonstrated that in order to delay the onset and progression of sarcopenia and its potential adverse effects, more attention should be paid to increasing physical activity levels among older populations.
It seemed safe to assume that blue-collar workers, due to the physical nature of their occupation, would demonstrate lower BMI values as compared to white-collar workers. In this study, no statistically significant differences between these groups and BMI were observed. Similar BMI scores between the groups might result from lack of statistically significant differences in physical activity (IPAQ) scores. Differences in BMI which were related to the type of work during the years of occupational activity might have disappeared after occupational activity ceased. Similarly, Tudor-Locke et al. (2014), in their study among professionally active subjects aged 20–64, found no statistically significant differences between sedentary and nonsedentary occupation and BMI. However, these authors emphasized the limitation of their study, that is the possibility that time spent in sedentary behavior may have been miscalculated in case of professions with highly diversified types of work.
In this study, the analysis of the risk for depression revealed that in the younger group, blue-collar workers tended to have a higher risk for depression as compared to white-collar subjects. Additionally, a comparison of the age groups revealed that the older retirees were at a higher risk for depression. Also, a negative correlation between the risk for depression and muscle strength and physical activity levels was identified. Despite statistically significant differences in risk for depression scores (GDS) among the groups with varying levels of physical activity, none of the groups exceeded the cut-off point (5 points) which would indicate depression. The differences between the moderate/low-level physical activity groups and the high physical activity group might be indicative of the beneficial effect of physical activity on lowering the risk for depression. These findings are similar to the results of Kvam et al. (2016), who conducted a meta-analysis of 23 randomized controlled trials and demonstrated the effectiveness of exercise, both as the primary and secondary therapy combined with pharmacotherapy to treat depression. Other authors also claim that physical activity might be considered as an element of a multidimensional therapy of depression (Joshi et al., 2016; Ledochowski et al., 2017). Stessman et al. (2017) analyzed the relationship between HGS and mood, functional status and mortality. These authors observed a link between low HGS and weak functional status (aged 70–90 years), lower education and financial status, smoking and diabetes (aged 78–90 years). The survival rates were significantly lower in subjects with low HGS as compared to people with normal HGS.
It seems that physical work performed during the years of occupational activity, being one of the components of physical activity, should have a beneficial effect on the HGS scores and physical dexterity evaluated with SPPB in the old age. In fact, the findings of this study did not prove that hypothesis. The type of work performed during the years of occupational activity had no effect on the physical dexterity after retiring. Based on that, it seems safe to conclude that physical activity associated with the occupational activity cannot substitute other forms of physical activity and does not translate into physical activity in the older age. Regardless of the type of occupational activity, older retired men, owing to the undertaken physical activity, achieved comparable results during physical dexterity tests.
Study Limitations
This study has a number of limitations that need to be acknowledged, chief among them the method of evaluating physical activity. The IPAQ questionnaire was used because the tool is easily applicable. Kowalski et al. (2012) indicated that the risk for underestimation or overestimation is higher in case of self-reported measurements as compared to the direct methods, for example accelerometer. These authors reported that indirect methods such as IPAQ allow for a speedy evaluation of physical activity of large populations. They concluded that neither method (indirect – e.g., IPAQ or direct – e.g., accelerometry) may be perceived as superior to the other. Another limitation of this study is a relatively small sample size (104 subjects), so large-scale further research is necessary.
Footnotes
Declaration of Conflicting Interests
The author(s) declared no potential conflicts of interest with respect to the research, authorship, and/or publication of this article.
Funding
The author(s) received no financial support for the research, authorship, and/or publication of this article.