
Abstract
The aim of this study was to evaluate the effect of long-term running training on muscle strength of men aged 50 and above. The study involved two groups of men aged 50 and above: physically active (E, n = 34) and inactive (NE, n = 20). Body composition was assessed with the electrical bioimpedance method. The isometric maximum voluntary contraction (MVC) was the main measurement. The value of muscle torque achieved by a group of synergists (operating in the given joint) during a short isometric contraction was evaluated. Ten groups of flexor and extensor muscles of the elbow, shoulder, hip, knee, and torso joints were measured. In addition, a 3 s measurement of grip strength of the right (Fr) and left (Fl) hand was taken using a hand dynamometer. The obtained values enabled to calculate the symmetry index (SI).
Men who had been running regularly were characterized by a significantly lower strength level (p < .05). Results in the NE group were determined to a great extent by significantly different body weights (p < .001) and a significantly higher body fat mass (FAT) content (p < .001). SI was statistically higher in the reference group (p < .05).
Long-distance run training reduces FAT while maintaining a high level of muscle strength. These studies indirectly confirm the effect of strengthening slow-twitch motor units in men aged 50 (Doherty & Brown 1993; Kanda & Hashizume 1989). In addition, stimulating the body through physical effort helps it also to maintain a high level of strength symmetry, which is a preventive factor in reducing the number of injuries.
Quantitative changes that take place as the body ages and their causes are continually the subject of numerous studies and discussions. One of the most visible structural changes that occurs in the neuromuscular system with age is the loss of muscle mass (Power, Dalton, & Rice, 2013). It is believed that muscle mass starts decreasing after the age of 30 (Keller & Engelhardt, 2014; Roubenoff, 2003), and after reaching the age of 50 it reduces at the mean rate of 6% per decade (Janssen, 2010). Other authors claim that muscle mass lowers by an average of 10% to 20% in the seventh decade of life and is reduced by 20% in the eighth decade (Vandervoort, 2002). The consequence of this process is decreased muscle strength (Fleg & Lakata, 1988) and a lower level of physical fitness. It has been proved that between the age of 50 and 60 strength lowers at the rate of 1.5% per year (i.e., 15% per decade), and after the age of 60 even faster (by 3% per year on average; Manini & Clark 2012; Von Haehling, Morey, & Anker, 2010). Using the isometric strength measurement method, Bemben, Massey, Bemben, Boileau, and Misner (1991) demonstrated significant age-related differences in the development of maximum voluntary contraction (MVC) in men. The results of the study using participants aged 20 to 74 (divided into age groups), which were analyzed both including and excluding body composition, showed significance in both cases. Many authors report that the observed age-related sarcopenia defined as age-related general and progressive condition of skeletal muscles (Canepari, Pellegrino, D’Antona, & Bottinelli, 2010; Manini, Hong, & Clark, 2013; Narici & Maffulli, 2010) and the related decrease in strength are associated with the loss of motor units (Lexell, Taylor, & Sjostrom, 1988), especially fast twitch (FT) fibers (Lexell, 1995). Petrigrew and Noble (1991) reported that it is mainly associated with a change in the ratio of slow twitch (ST) fibers to FT fibers, which is related to a greater activity of reinnervation processes in the motor neurons of ST units (Doherty & Brown, 1993; Kanda & Hashizume, 1989). It means that FT fibers whose motoneurons have been lost do not disappear or become nonfunctional because they are reinnervated via nerve sprouts from adjacent intact functional motoneuron axons, which consequently results in their increase (Manini & Clark, 2012; von Haehling Morley & Anker, 2010). Adach (2002) reported that qualitative age-related changes can also be observed in connection to the processes of neuromuscular stimulation, as well as the pattern of stimulation of muscle fibers (Doherty & Brown, 1993; Gordon, Hegedus, & Tam, 2004). Another symptom of aging in men is decreasing levels of biologically active testosterone and growth hormone (Bemben, Massey, Bemben, Bioleau, & Misner, 1995). Isidori et al. (2005) conducted a systematic evaluation of the effects of decreasing with age levels of testosterone on body composition, strength capabilities, and bone density in the studied men. Nicklas et al. (1995) studied growth hormone (hGH) and insulin-like growth factor I (IGF-I) levels, in addition to testosterone (T) concentration, in response to brief high-intensity exercise and a 16-week progressive training in elderly persons (60 ± 4 years of age). This study showed a significant response only for hGH to brief, high-intensity exercise. Long-term progressive training did not influence anabolic hormone concentration. However, results of the study did demonstrate that an active lifestyle may significantly delay, or even reverse, the process of changes occurring with age, significantly affecting the activity of muscle enzymes (Nicklas et al., 1995). This depends on individual capacities, which are also conditioned by genetic factors, and the level and type of physical activity (Adach, 2002). It is extremely important to explain sarcopenia and reduce its effects for many reasons, such as increasing the average life expectancy and looking for opportunities to improve the quality of life of elderly people. The article does not explain the causes of sarcopenia, but constitutes an attempt to evaluate the effects of long-term running training on the maintenance of muscle strength the decrease of which, together with muscle loss, are the two negative effects of this process. Research overview shows that changes taking place in muscle structures assist in long-term efforts. Therefore, it seems important to undertake activities during which high intensity of effort can be replaced by its duration which, in turn, will be a stimulus slowing down the body aging process. Those activities should also be suitable for middle-aged and elderly people. The aim of this study was to evaluate the effect of long-term training in the activity of running on muscle strength of men aged 50 and above.
Material and Methods
The research was preceded by a medical examination of the study participants conducted by a cardiologist who also completed a questionnaire for each subject including questions concerning smoking, past diseases, family medical history, and medications taken. The level of physical activity was assessed during the interview. Healthy men aged 56 ± 4.8 had been actively practicing long-distance running (E, n = 34) for a minimum of 5 years, on average four times per week, for 1.4 ± 0.42 h and they had also been actively participating in competitions for at least 4 years. Males who passed their medical examination and who did not undertake any form of physical activity, even recreational, qualified for the physically inactive group (NE, n = 20) aged 54 ± 4.3. Economic status of the study subjects was not considered. All the people designated by the doctor provided their written consent to participate in the research. Study participants in group E were characterized by a mean body weight of 76.1 ± 8.18 kg (95% CI [73.1, 79.0]), which was 19% lower (p < .001) than that of group NE (90.8 ± 12.43 kg; 95% CI [85.1, 96.4]). The groups also differed significantly (p < .05) with respect to body height; however, this difference was not as large (h = 175 ± 4.99 cm in group E, 179 ± 5.59 cm in group NE).
Research Methods
Muscle Torque Measurement Methods
The study was conducted in the laboratory of the Department of Biomechanics of the University of Physical Education in Warsaw using the standard method of measuring the isometric MVC using a device manufactured by JBA Z. Staniak company. Measurements were taken in static conditions and appropriate body stabilization was provided while observing the principles of statics. Static conditions were ensured through the stabilization and appropriate pre-tensioning of the involved tendons or supports. The value of muscle torque achieved by a group of synergists (operating in the given joint) during a short (lasting 3 s) isometric contraction was measured. During the measurement, the same angle for all joints was established at

The measurement position for torque of the knee extensors in which the balance conditions of the bone lever (lower leg) were preserved. D = dynamometer, F = external force (reaction force of imposed constraints), r = arm of external force (Dziewiecki, 2002 adapted by Iwańska, Karczewska, Madej, & Urbanik, 2015).
In addition, a 3 s measurement of grip strength of the right (Fr) and left (Fl) hand was taken using a mechanical hand dynamometer by JBA Z. Staniak company. The study subjects were evaluated in a standard position of the upper limb held along the torso while standing. The width of the clamps of the dynamometer was adjusted to the height of the heel of the palm. The measurement was taken with feedback. The study participants were able to watch on display screen the value and change of strength which they developed during the measurement. Measurement accuracy amounted to 0.5 [N]
Body Composition Assessment Method
Body composition was assessed with the electrical bioimpedance method using a Tanita device, model BC 41 MA, by Tanita Co. The measurement was taken barefoot in an erect position. While standing motionless on the platform of the device, participants had their body weight measured to the nearest 100 (g); then, while grasping electrodes with hands and holding them motionless for a few seconds, a resistance measurement was performed to determine body composition. Variables for the whole body were taken into account, including adipose tissue, fat-free mass (FFM), fat mass (FAT), and total body water (TBW).
Statistical Analysis Methods
Statistical analysis was done on real and relative values with reference to body weight. STATISTICA 10 software was used for calculations. Mean values, standard deviation, and 95% confidence intervals of the analyzed parameters, and percentage differences between the results were calculated. The analysis was carried out in two stages. In the first stage, the comparison of variables between the groups was conducted using analysis of variance (ANOVA). In addition, an analysis of dependences between the anthropometric variables and strength capabilities of the participants was performed.
The results of the hand grip strength measurement were subjected to symmetry analysis. The symmetry index (SI) was calculated by standardizing the differences between the values of the parameters for the left and right limb with respect to the value adopted for the dominant limb (Zifchock, Dawiv, Higginson, & Royer, 2008). This method, which was also used by Iwańska, Karczewska, Madej, and Urbanik (2015), is the most frequently used method for symmetry assessment:

where:
SI = symmetry index,
XR = value obtained for the right limb, and
XL = value obtained for the left limb.
Symmetry is assumed with the value of the index at SI = 0, while negative values in the numerator indicate asymmetry.
Results
Body Composition Assessment
On the basis of the conducted analyses, significant differences were demonstrated in the body composition of the physically active (E) and inactive (NE) groups. The NE group was characterized by higher values for adiposity. The percentage difference between mean values of FAT (kg) in the analyzed groups equaled 60% and was statistically significant (p < .001). Similarly, for FFM (kg), it amounted to 10% and despite being smaller, it was also significantly significant (p < .001). Table 1 presents the mean values of body composition for each group.
Mean ± SD Values and 95% Confidence Intervals of the Analyzed Body Composition Variables in the Physically Active (E) and Inactive (NE) Groups.

Note. FFM = fat-free mass, FAT = fat mass, TBW = total body water, ns = nonsignificant.
p < .05. **p < .01. ***p < .001.
The mean absolute value of the FFM to FAT ratio was 5.1 ± 2.11 (95% CI [4.3, 5.8]) in the active group and 3.4 ± 1.1 (95% CI [2.9, 3.9]) in the inactive one. The difference between the obtained values equaled 34% (p < .001). In addition, the physically active group was characterized by a significantly higher percentage of TBW (p < .001) relative to the inactive group and to the standard for this age group (40%–50%). The study participants are located within the upper limit of this percentage (Musiał & Lipert 2017).
Muscle Torque Measurement
Further analysis concerned the results of muscle torque measurements. The Table 2 presents mean ± SD values of the torques of individual muscle groups developed in the analyzed groups, and the percentage differences in which the results of the group of runners was assumed to be 100%.
Mean ± SD values of the Analyzed Variables of Torques (MVC) of Individual Muscle Groups (Fl-Flexors, Ex-Extensors of the Joints: Elbow, Shoulder, Knee, Hip, Trunk) in the Physically Active (E) and Inactive (NE) Groups.

Note. ns = nonsignificant. The group of runners was assumed to be 100%.
In all the tested muscle groups, significant differences were observed between the torques of the lower limb extensor muscles in the hip joint and extensor and flexor muscles in the knee joint. The greatest difference was observed for the muscle groups of the hip joint (18%), but in all cases it was at the level of p < .05. The smallest differences were observed for muscle groups of the upper limb. The differences did not exceed 8%.
Human torque values depend to a large extent on muscle mass, which, on average, accounts for one third of total weight. In the present study, body composition—including FAT, FFM, and TBW—was assessed in addition to body weight. Muscle mass is included as fat-free body mass; therefore, further analysis concerned relative values with reference to body composition variables. Taking into account the significant dependence observed between total body mass (bw) and sum of muscle torques (sMVC), further analysis provides comparison of relative values referring to body mass sMVC/bw. The correlation was positive at r = 0.589 (95% CI [0.598, 0.685]) and p < .01 in group E and r = 0.491 (95% CI [0.076, 0.761]) and p < .01 in group NE. Table 3 presents mean ± SD absolute and relative values of sMVC obtained in the group of physically active group (E) and inactive men (NE), and the differences between the groups are illustrated in Figure 2.
Mean ± SD Absolute [N m] and Relative Values [N m/kg] of the Sum of Muscle Torques (sMVC) in the Physically Active (E) and Inactive (NE) Groups.

Note. ns = nonsignificant
p < .05. ***p < .001.

The correlation between body weight (bw) and sum of muscle torques (sMVC) in the physically active (E) and inactive (NE) group.
In a global assessment (sMVC) based on absolute values, people who had been running regularly were characterized by a significantly lower strength level (1633 ± 218 [N m] p < .05). However, the results in group NE were determined to a great extent by significantly different body weights (p < .001) and a significantly higher FAT (p < .001).
It was concluded that the main determinant of the strength level achieved by study groups among the considered variables was higher FAT. People practicing long-distance running were characterized by significantly higher relative values of muscle strength with reference to FAT (sMVC/FAT [N m/kg]), as is illustrated in Figure 3. Differences exceeded 30% and were statistically significant in favor of men in the physically active group (p < .01).
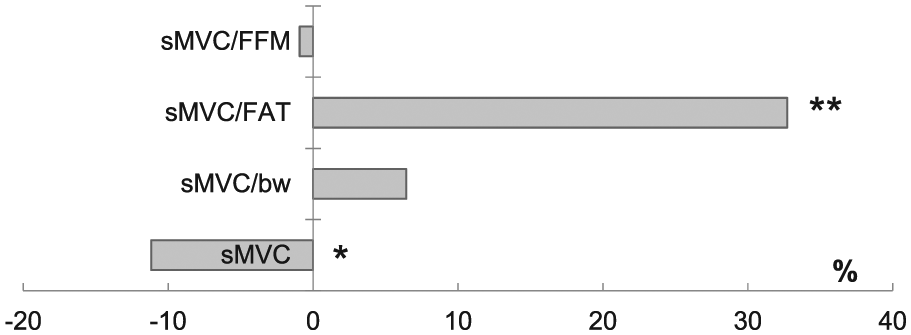
Mean absolute and relative differences in values of the sum of MVC in the physically active (E) and inactive (NE) group.
Grip Strength Measurement Results
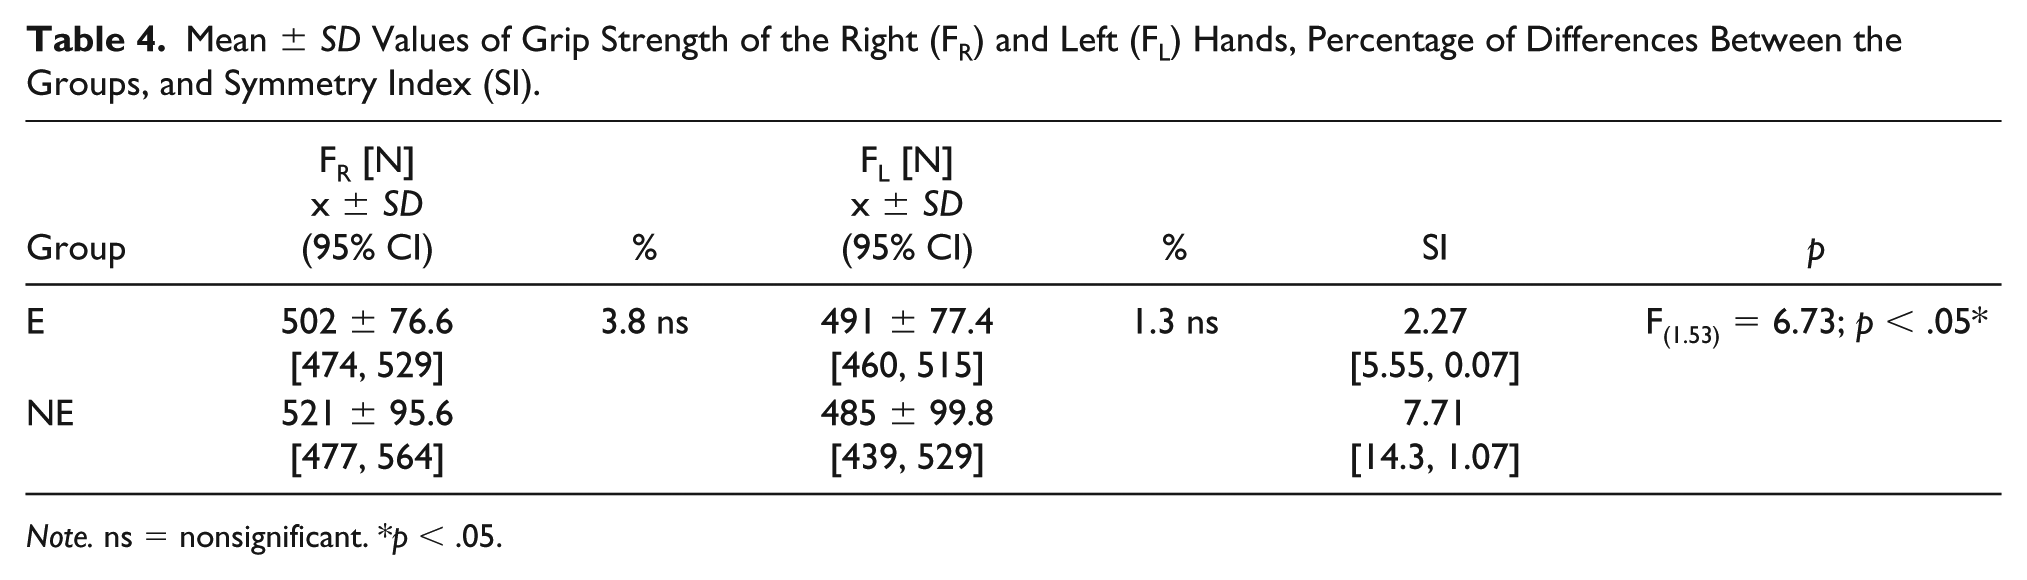
Study participants also underwent measurements of strength in the right and left hands (F). Mean ± SD values of strength, differences between the groups’ results, and the SI are presented in Table 4.
Mean ± SD Values of Grip Strength of the Right (FR) and Left (FL) Hands, Percentage of Differences Between the Groups, and Symmetry Index (SI).
Note. ns = nonsignificant. *p < .05.
Based on the analysis of variance for repeated trials, the absence of interaction between factors such as the study group and the right and left limb was demonstrated (F(1.53) = 3.43; p = .069). The differences between study groups did not exceed 4% for both the right and left limbs. However, a significant effect could be observed on the limb itself (F(1.53) = 11.71; p < .01). Participants achieved higher values of grip strength for the right limb. Greater differences between limbs were observed in the nonexercising group. The above results were also confirmed by the calculated SI. It was statistically higher in the reference group (F(1.53) = 6.73; p < .05), which indicated a greater asymmetry in these participants. In the majority of participants, asymmetry developed on the left side in both the group of runners and the reference group.
Discussion
One of the symptoms of the biological process of aging is the deterioration of particular systems. These changes depend not only on an individual’s age, but also on individual genetic predisposition and physical activity levels (Adach, 2002). The present study concerned the evaluation of the effect of physical activity on the strength capabilities of men over 50 years of age who had been practicing long-distance running. A recent study by Power et al. (2012) involving 65-year-old sportsmen reported that a high level of physical activity has the positive effect of reducing the loss of function in motor units when compared to a sedentary lifestyle. This is the result of maintaining the excitability of muscle mass (Power et al., 2010). As Allen, Power, Filion, Doherty, and Rice (2013) demonstrated, the process of the loss of motor units may be delayed with physical activity, but it cannot be stopped. By comparing the motor units in 65-year-old sportsmen to those of inactive people, the researchers demonstrated a significant positive effect of activity and a much greater quantity of motor units in the exercising group’s muscles. At the same time, they also displayed a significantly lower value compared to the younger 25-year-old men. These results were confirmed by Dalton, Harwood, Davidson, and Rice (2010) and by Vandervoort and McComans (1986). These authors also observed that in the majority of participants, the loss of motor units with age is very similar in muscles of the upper and lower limbs, and is in the range of 40% to 60% for most muscle groups.
The present study indicates a different degree of differences between exercising and nonexercising men for various muscle groups. Significant differences were observed in the absolute torque values in three muscle groups of the lower limbs. It was also noted that body fat was important for muscle strength. Nonexercising persons were characterized by a significantly higher content of body fat compared to the group of active men. An increase in body fat and a simultaneous decrease in the percentage of lean tissue was observed from the age of approximately 30. This is an age that is associated with a decrease in muscle proteins, although other tissues continue to maintain their protein content (Cohn et al., 1980; Janiszewska, 2013).
Long-distance running is a form of physical activity which, due to frequently extreme energy expenditure, leads to the reverse situation and helps to lower fat tissue content. Also, as other researchers demonstrate, running is a sports discipline requiring a high muscle strength to body mass ratio, and thus too high fat tissue content leads to a considerable decrease in runners’ strength capabilities (Regulska-Ilow et al., 2014). Knechtle, Rus, Kenchtte, and Rosemann (2012) in their studies, which also included marathon runners aged 47.8 ± 7.9, proved a similar FAT content (16.9 ± 3.4%) to the one obtained in the present work. Males participating in this study were characterized by 17.8 ± 4.7% FAT mass. This number was significantly lower than in the inactive group (NE) where it was at the level of 24 ± 4.9%. For that reason, apart from absolute strength values, relative strength with reference to body mass and fat tissue content was also compared. It was confirmed that physically active men in comparison with the inactive ones developed a significantly higher, by as much as 30%, value of the sums of maximum muscle torques converted into fat mass (sMVC/FAT). It can be stated that in this group training supported the decrease of fat tissue content while enabling to maintain strength capabilities at a higher level. Muscle strength and muscle mass are strictly connected. Numerous studies indicate that there is a linear correlation between them (Newman et al. 2003; Rolland et al. 2008). Kim et al. (2012) proved that in elderly people, muscle strength has greater clinical importance than muscle mass. Also, in the case of runners, excessive increase in muscle mass would be an unnecessary load preventing acquisition of good results at longer distances. Therefore, the ratio between FFM and FAT, which in runners equaled 5.1 ± 2.13 and in the inactive group was 34% higher, seems to be more important. Further analysis of FFM of long-distance runners conducted by some scientists demonstrated that its level amounted to almost 80% of the total body mass (Knechtle, Rust, Knechtle, & Rosemann, 2012; Musiał & Lipert, 2017). The above findings have been confirmed by the present study. Active men were characterized by 82 ± 4.7% FFM content, higher than in the control group (76 ± 4.9%). Runners also showed proper body hydration and significantly higher (59.8 ± 4.2%; p < .001) TBW than in the inactive group. It was demonstrated (Knechtle, Rust, Knechtle, & Rosemann, 2012; Musiał & Lipert, 2017) that with age, body water content reaches lowest norm values that is, around 45%–50%. The current study shows that in both active and inactive males, body water content was above the given norm and was lower for the control group.
All the reference studies and the present study prove that selection of appropriate exercise loads may also lead to the development of body adaptive mechanisms (Nitz & Low Choy, 2004), which may significantly help delay body aging processes. Based on similar studies, it has been demonstrated that various types of training, including strength, flexibility, and balance training, increase functional capabilities and are preventative as they reduce the risk of falling (Steinberg, Cartwright, Pell, & Williams, 2000). They also help maintain the functionality of individual systems, and thus, quality of life (Samuel, Rowe, Hood, & Nicol, 2012). In addition, Nicklas et al. (1995) demonstrated that a significant decrease in body fat and an increase in lean body mass occur in elderly people as a result of exercise.
As has been shown, a common marker of human aging is the measurement of grip strength (Koopman, Bedgom, Heemst, & Westendrop, 2015); its low level is the main geriatric syndrome of sarcopenia (Roberts et al., 2014). In the present study, the dynamometric method was used to measure hand grip strength, as in the study by Samuel et al. (2012). The results of the test used in the current study were significantly different than those of Samuel et al. (2012). Both exercising and nonexercising men demonstrated significantly greater grip strength compared to the participants of the study conducted by the aforementioned authors. This most likely results from measurement methodology, specific features of the equipment used during the test, and from the fact that strength levels decrease with age. Samuel et al. (2012) studied men and women between 60 and 80 years old. Other studies suggest that muscle strength decreases only by approximately 10% by the age of 50 (Lexell et al., 1988), and the phenomenon intensifies between the age of 50 and 60, depending on particular muscle groups and individual’s physical activity (Brooks & Faulkner, 1994). When evaluating changes occurring with age, it also seems to be important to analyze strength symmetry, which can increase with age from overloading one side of the body. Based on their study, Skeleton, Kennedy, and Rutherford (2002) concluded that the assessment of lower limb asymmetry, in addition to strength measurement, is a better predictor of future falls of elderly persons than traditional strength measurements. Perry, Carville, Smith, Rutherford, and Newham (2007) demonstrated a significantly higher strength asymmetry in elderly persons compared to young people, and also a greater asymmetry between those who fell and those who did not fall. In this case, the difference was not significant.
In the present study, the evaluation of asymmetry involved the measurement of hand grip strength; however, the importance of physical activity in maintaining a high degree of strength symmetry was taken into account. This was reflected by a statistically significantly greater asymmetry in inactive men compared to the group of active men. Moreover, an individual analysis of the results allowed for the identification of asymmetry of the left limb in both groups.
This measurement represents symmetry of upper limbs muscle strength, however the study by Laurentani et al. (2003) demonstrates a connection between hand grip strength and parameters of lower limb muscles that is, their strength and cross-sectional area of triceps surae. Thus, it can be assumed that hand grip symmetry constitutes representative evaluation of muscle strength symmetry not only for upper limbs, but for the lower ones too.
The size of the study group is a certain limitation of the study. Only one age group characterized by one type of physical activity was measured. Therefore, conclusions are limited only to this group. If we took into account different types of activity and different age groups, analysis of the impact of physical effort on the maintenance of high muscle strength, while taking into account changes taking place in the body composition of the study subjects, could tell more about possibilities of extending life quality as age function.
Conclusions
Sarcopenia developed with age results in reduced muscle mass. In the case of long-distance runners, however, high strength level seems to be of greater importance than muscle mass itself, which was confirmed by Kim et al. (2012). Maintenance of an appropriate strength level ensures joint stability and provides protection against injuries. In the case of the studied runners, the increase in the FFM to FAT ratio was of greater importance for the maintenance of muscle strength capabilities. In the end, it provided significantly higher strength capabilities converted into body mass and FAT in the group of runners in comparison with the inactive group.
It was shown that by pushing the body out of homeostasis through proper exercise, the effects of aging may be delayed to some extent (Adach, 2002). Since the ability to make maximum effort over a short period of time reduces with age, the present study demonstrates that a lower level training extended in time becomes an alternative for middle-aged and elderly people who wish to stay physically fit. The present study proves that long-term running training reduces body fat while maintaining a high level of muscle strength. Also, the specifics of long-distance training help strengthen slow-twitch units and may lead to motoneuron reinnervation of losted units (Doherty & Brown 1993; Kanda & Hashizume 1989), thanks to which staying active at the advanced age is still possible. In addition, stimulating the body through physical effort helps it to maintain a high level of strength symmetry, which is a preventive factor in reducing the number of injuries that a person sustains with age. A symmetry measurement is a predictor of injuries, especially in men and women of middle and old age (Skeleton, Kennedy, & Rutherford, 2002).
Footnotes
Declaration of Conflicting Interests
The author(s) declared no potential conflicts of interest with respect to the research, authorship, and/or publication of this article.
Funding
The author(s) disclosed receipt of the following financial support for the research, authorship, and/or publication of this article: The study was financed by the Statutory Research Project DS-182 University of Physical Education in Warsaw.
Ethics
The research protocol was accepted by the ethic committee of the Józef Piłsudski University of Physical Education in Warsaw. The study approval number is SKS 01-39/2012. All men gave their informed consent and were informed of the benefits and risks of the investigation prior to signing an institutionally approved inform consent document to participate in the study.