
Abstract
The main purpose of this study was to translate the Plagiarism Attitude Scale into Turkish and validate it for use in Turkish settings, in order to better understand research integrity attitudes and awareness of the Turkish academic and student community, while also contributing an instrument for research in this area. The research was designed and conducted with 483 participants. In the process of adapting the scale to Turkish, language, content, and construct validity analyses were performed. Following the completion of the validity phase, the reliability of the scale was examined using Cronbach's alpha coefficient and the split-half method. The results indicate that the scale's language and content validity are deemed sufficient. According to the findings of the research, the Plagiarism Attitude Scale, in its adapted Turkish version, is considered a valid and reliable tool. The use of this Turkish scale will assist local researchers in sharing their unique perspectives and help the international community better understand research ethics concerns in Türkiye. Additionally, this scale will serve as a valuable resource for planning educational programs.
Introductıon
The rapid development of information technology has provided researchers with a significant advantage by enabling faster and broader access to information. Literature review and information retrieval processes have become faster and more efficient. However, this increased access has also brought the risk of research integrity violations. Research integrity violations refer to situations where ethical values are not adhered to in scientific studies and other knowledge production processes.
Plagiarism is often considered the most common form of research misconduct (Gupta et al., 2021; Raj et al., 2022; Rajah-Kanagasabai & Roberts, 2015). It typically involves attempts to use or present someone else's unique ideas, observations, findings, techniques, inferences, or new terminologies without proper attribution to the original source, or presenting them as one's own without proper citation. Plagiarism can occur for various reasons, either intentionally or unintentionally. Factors contributing to plagiarism may include the desire for recognition, career advancement aspirations, pressure to publish, anxiety about language proficiency, negative personal characteristics, or inadequate knowledge (Cronan et al., 2018; Kumar et al., 2022; Raj et al., 2021; Tarkang et al., 2017). Combating plagiarism is crucial for preserving the integrity and reliability of science and knowledge.
Research shows that plagiarism behavior is commonly observed among students at all levels of education and researchers. In a study in the United States, 56% of medical students were found to have engaged in plagiarism (Tajalli et al., 2022), while in Pakistan, 71.18% of medical students were found to have committed plagiarism (Javaeed et al., 2019). A study by Yin and colleagues revealed that academicians in China had insufficient knowledge about behaviors considered as plagiarism (Yi et al., 2020). Additionally, Rodrigues and colleagues found that articles from the Asian region, especially China, were most commonly retracted due to plagiarism in MEDLINE and Scopus databases (Rodrigues et al., 2023). Higgins and colleagues examined the similarity rates of 400 articles over a 12-month period and found an average similarity rate of 25.8% in 66 articles. Among these 66 articles, 55 were submitted from countries where English was not the official language. Interestingly, 57 of the reviewed articles were rejected before the review process, and it was revealed that 37 of these rejected articles were later published in different journals with nearly identical texts, emphasizing the importance of anti-plagiarism policies. Authors from countries where English was not the official language, especially China, submitted articles with the highest plagiarism content, followed by Spain and Italy. Among English-speaking countries, the United States had the highest plagiarism rate. These data underscore the prevalence of plagiarism as a widespread issue (Higgins et al., 2016).
In the last quarter of the twentieth century, awareness of research ethics and research integrity began to increase in Türkiye. In this context, various institutions in Türkiye, especially the Turkish Academy of Sciences (TÜBA), the Scientific and Technological Research Council of Türkiye - National Academic Network and Information Center (TÜBİTAK-ULAKBİM), the Higher Education Council (YÖK), and the Interuniversity Board (ÜAK), have conducted work on research ethics and research integrity. These institutions have developed guidelines and policies to prevent plagiarism. However, concrete data on the frequency of plagiarism among Turkish researchers is quite limited. Some studies provide information about the dimensions of research ethics issues in Türkiye. For example, a study shows that the similarity rate of 15,600 master's and doctoral theses written in the field of educational sciences between 2007 and 2015 was 28.7% (Toprak, 2017). In addition, a study conducted among editors of 41 journals registered in the Turkish Medical Index found that 20.6% of the participants considered using others’ knowledge, examples, cases, or data without proper citation and quoting as unethical. The study indicates that there are relatively few editors of leading journals in Türkiye who define plagiarism as an ethical violation (Arda, 2001). Amos's study identified plagiarism as the primary reason for article retractions and ranked Türkiye second with a 61.5% rate (Amos, 2014). Similarly, Baždarić and colleagues found a high rate of plagiarism in articles from Türkiye and reported that Turkish academics do not perceive “copying from others” negatively (Baždarić et al., 2011).
Research ethics and integrity in Türkiye reflect the country's social, cultural, and historical context. This context has a significant impact on the challenges and needs faced by Turkish researchers while conducting their work. Turkish researchers may encounter different challenges as they strive to adhere to local ethical codes and international standards. There is therefore a need for valid local data to better understand and improve Turkish researchers’ experiences, attitudes, or social interactions concerning research ethics and integrity (Figure 1).
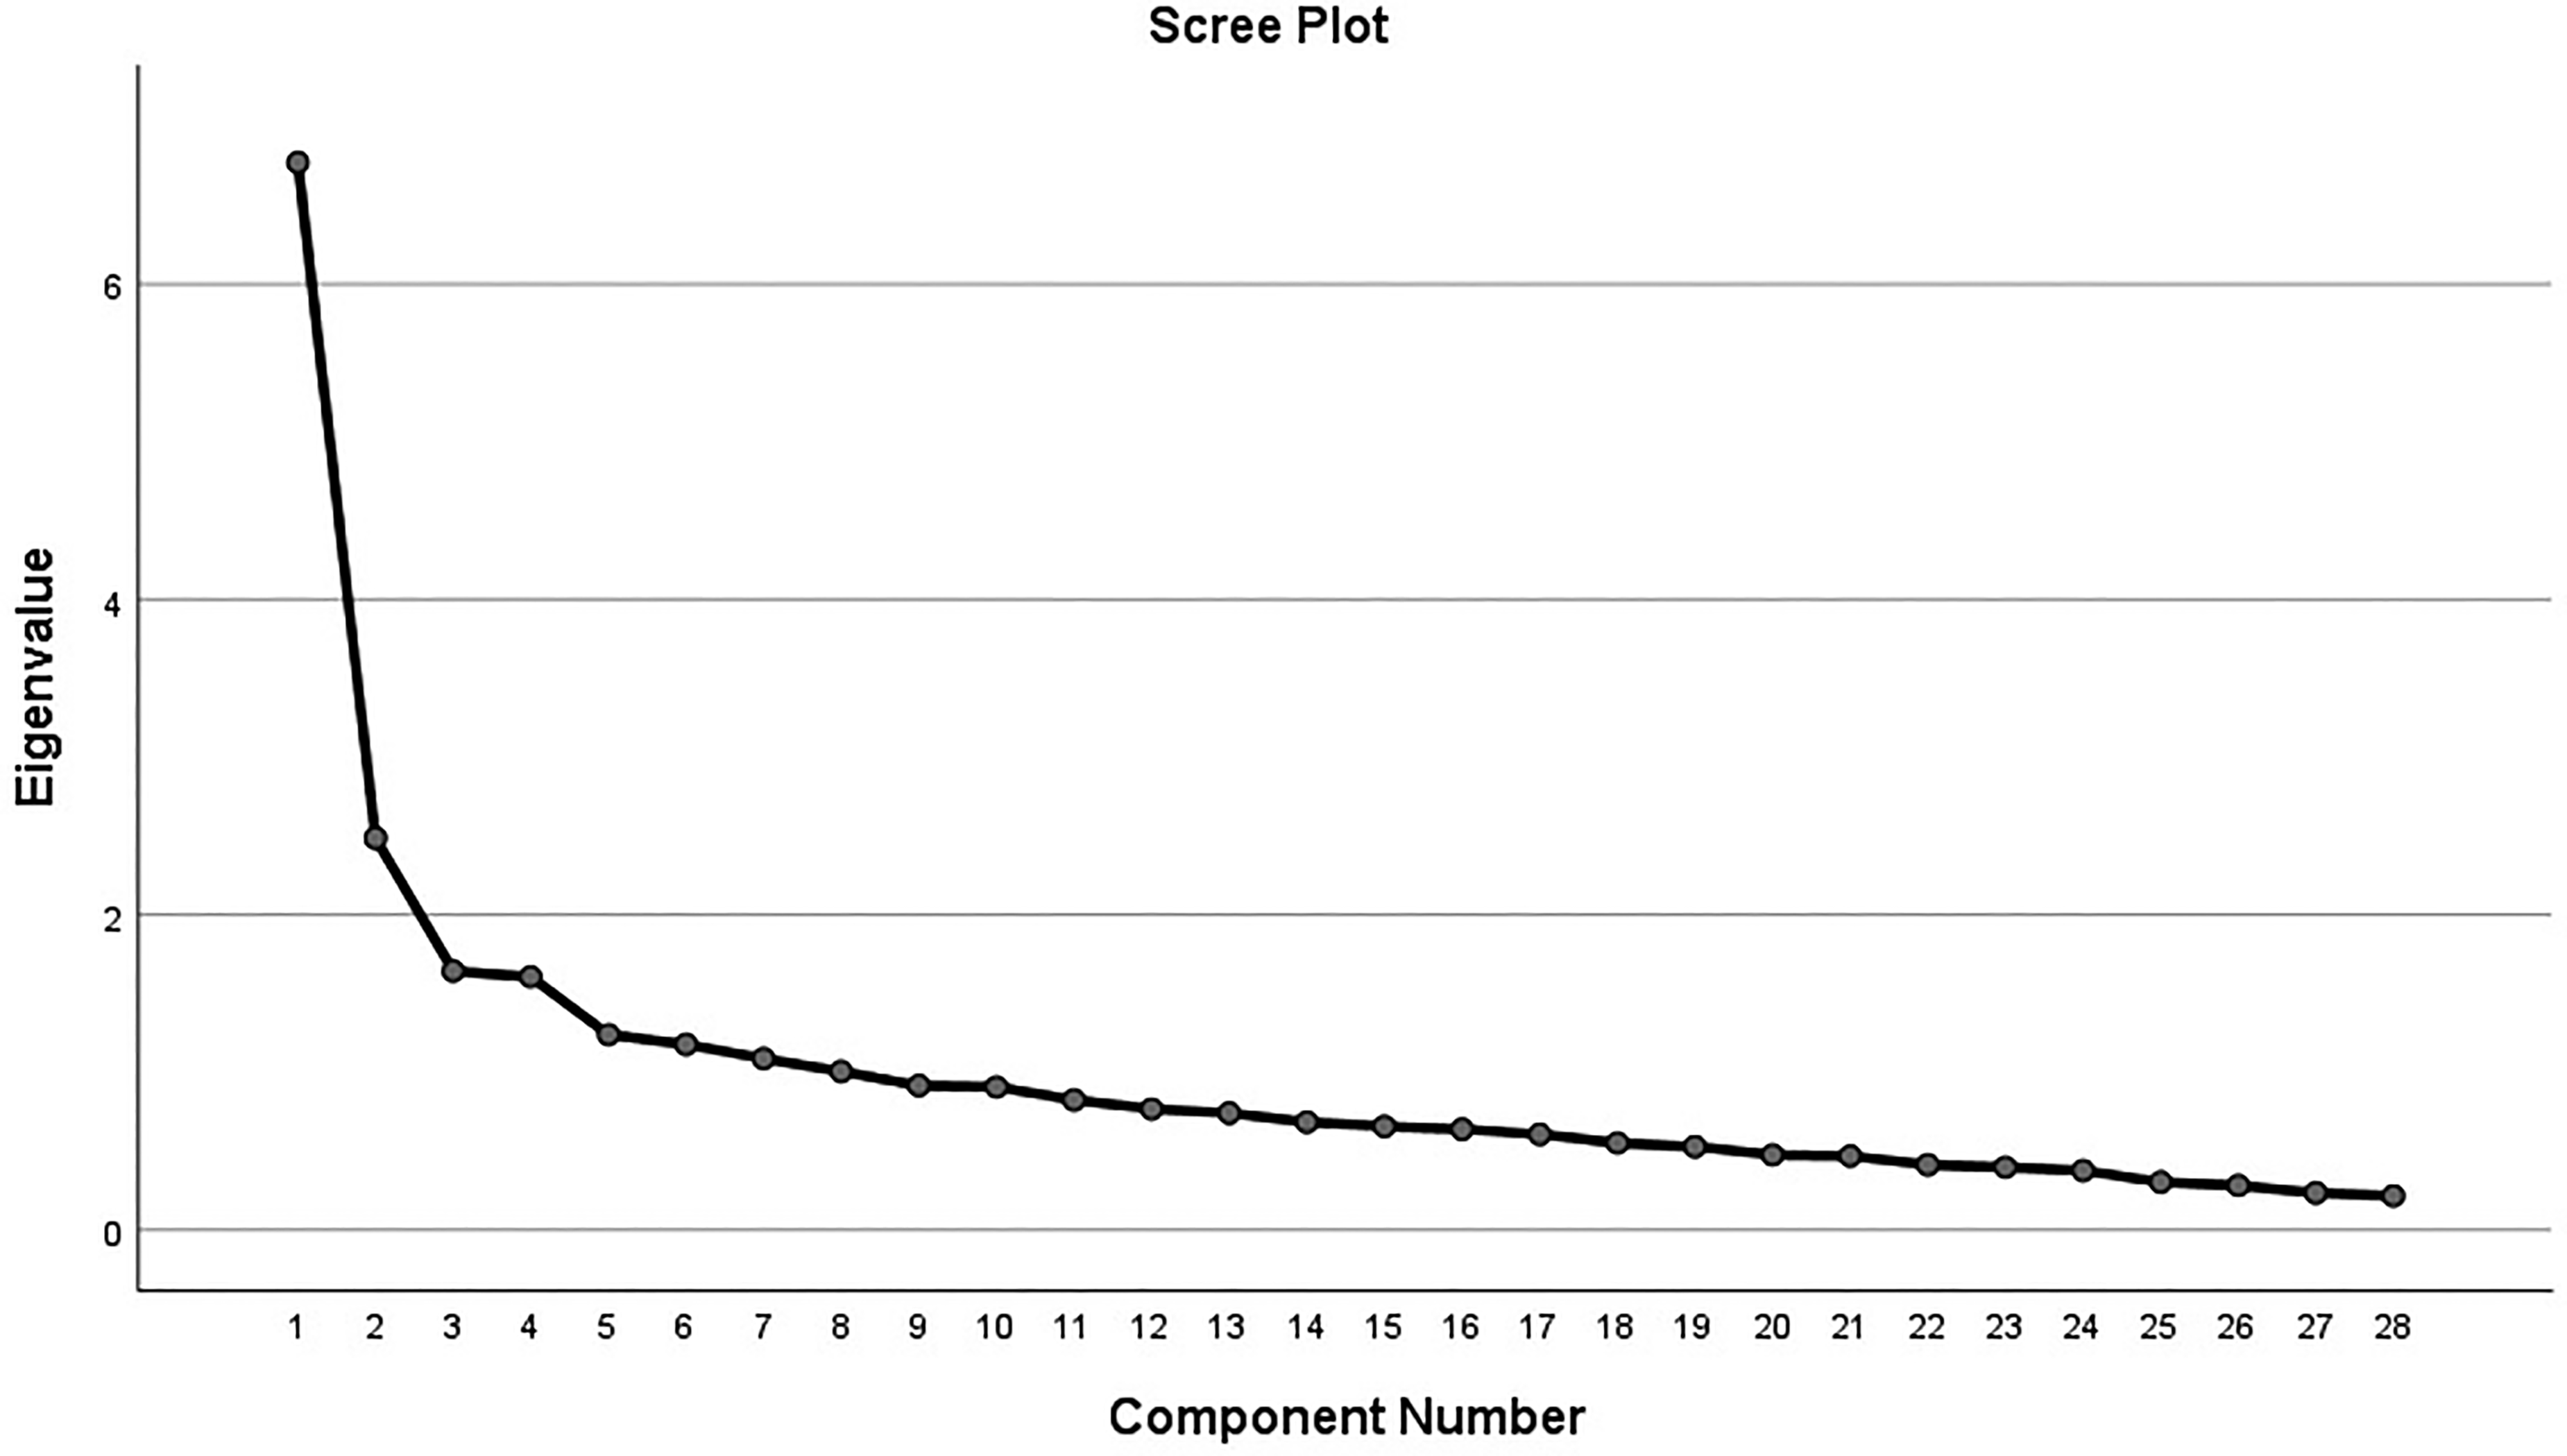
Screeplot of scale.
Surveys are commonly used standardized tools to measure attitudes. However, there is no specific measurement tool for plagiarism in the Turkish literature. The limited number of studies on plagiarism in Türkiye may indicate the need for such a tool. The use of a Turkish measurement tool will help local researchers share their unique perspectives and assist the international community in better understanding research ethics and research integrity concerns in Türkiye. It is also expected to be important for better training and awareness on these issues (Figure 2).
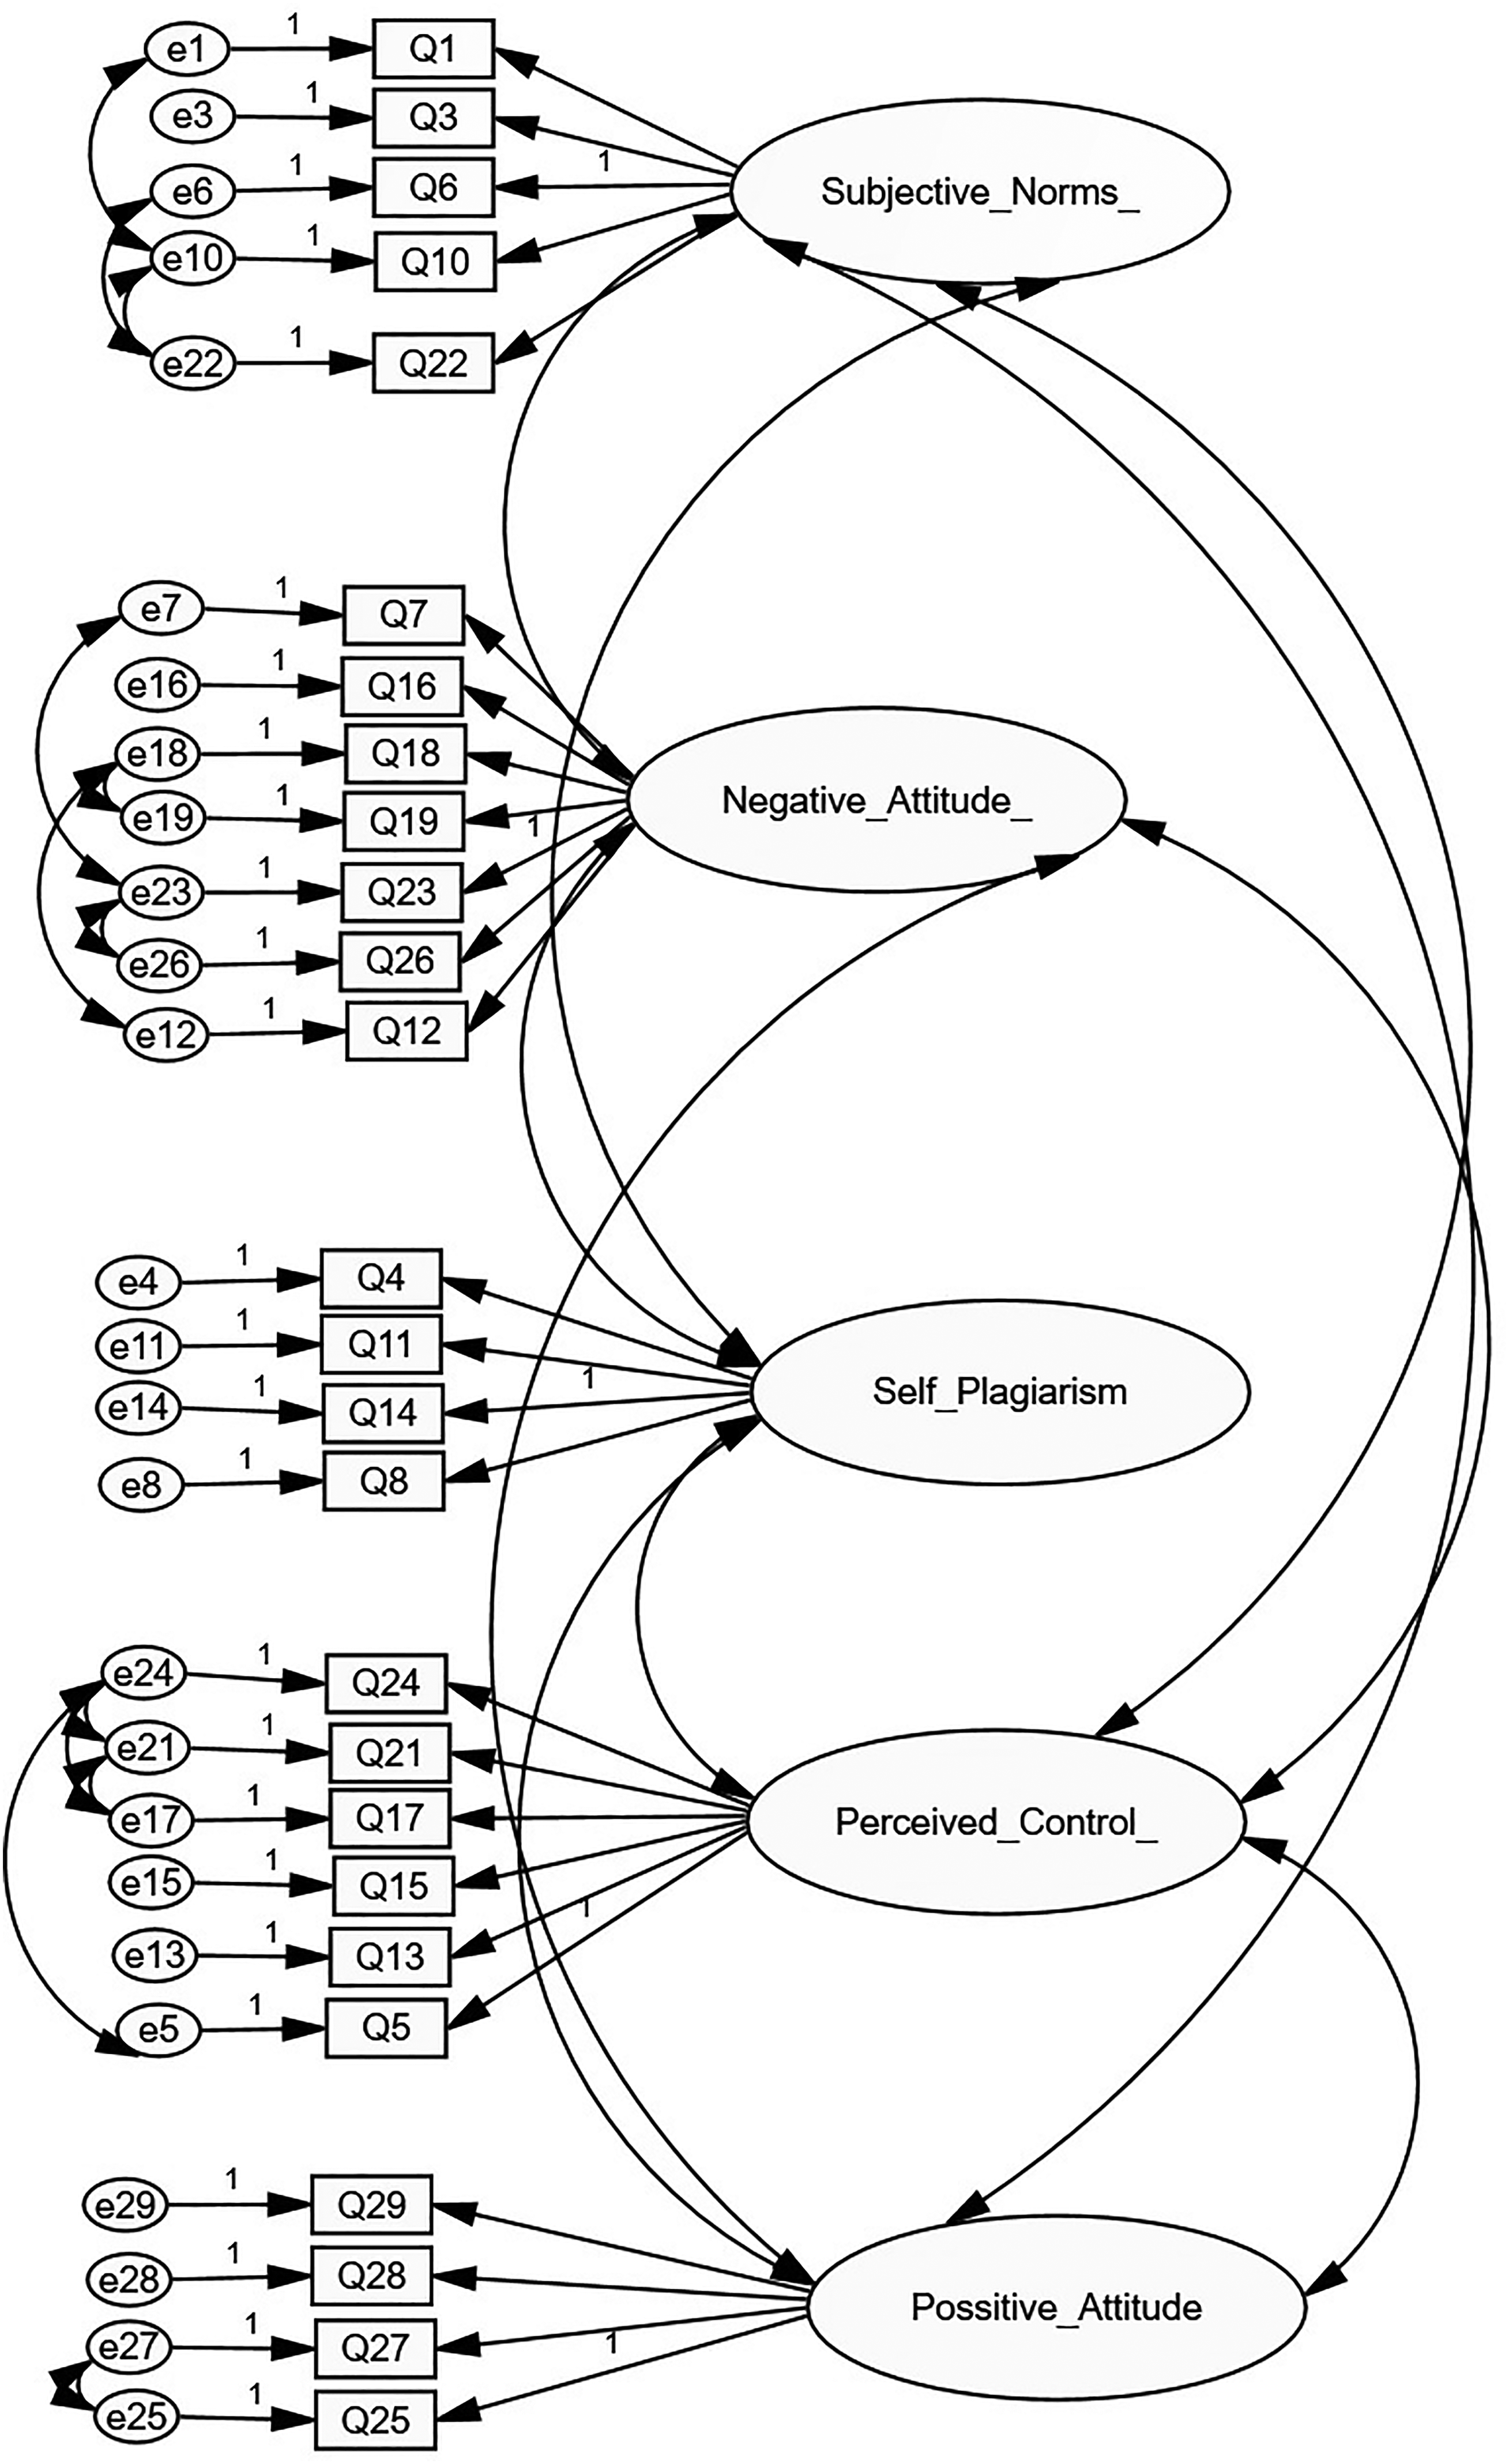
CFA diagram of the “attitudes toward plagiarism questionnaire”.
Methods
Study Design and Sample
Methodologically, the sample size for establishing the validity and reliability of the scale was determined based on the number of scale items. It was planned to include at least 10 times the number of scale items (29) as the sample size (Karakoç & Dönmez, 2014). The study was completed with 483 participants within the specified period. The voluntary sampling method was used in the selection of the sampling units. The study utilized the Personal Information Form and the Plagiarism Attitude Scale, which were developed by the researchers through a literature review on the topic and included sociodemographic data. The scale was administered to postgraduate students and faculty members in Türkiye. The research data were collected between November 1, 2022, and January 31, 2023, through both in-person and online submissions. Incomplete data sets and individuals who did not provide consent for the study were not included in the research.
Data Analysis
Reliability and exploratory factor analyses were performed on the obtained data using SPSS 26.0 (Statistical Package for the Social Sciences) for descriptive information and the AMOS 24 for confirmatory factor analysis (CFA). The significance level (p) value of 0.05 and a reliability coefficient of 0.95 were accepted for the analyses. Descriptive values were presented as numbers and percentages for categorical data and as means and standard deviations for quantitative data.
Language Validity
After obtaining permission for the adaptation of the “Attitudes Toward Plagiarism Questionnaire” developed by Mavrinac et al. (2010) to Turkish, the translation of the scale items into Turkish was done by two language experts. One translator was aware of the purpose and content of the study, while the other translator completed the translation blindly. The two translated forms were compared, and the concept-question form that provided the best expression was chosen. The prepared Turkish questionnaire form was then back-translated into English by a language expert whose native language is English but who is proficient in reading and writing Turkish. The original form and the newly prepared form were compared, and the scale form was given its final form by ensuring semantic integrity (Alpar, 2012).
Scope (Expert) Validity and Pilot Study
After the language validity stage, the “Attitudes Toward Plagiarism Questionnaire” form prepared was sent to 12 different experts to calculate the scope validity index. The experts were asked to rate the items in the questionnaire form on a scale of 1 to 3 based on the comprehensibility level of the questions (1: item is not necessary, 2: item is useful but not sufficient, 3: item is necessary and should be retained in the pool). The data obtained from each expert and the responses received were used to calculate the scope validity index. The Kendall W value for expert opinions, obtained through Kendall W analysis, was found to be 0.155. The calculated value was found to be statistically significant (p = 0.085 > 0.05). The expert opinions indicated that the questions were understandable (Bowling & Ebrahim, 2005).
Based on expert opinions, a pilot application was conducted with a sample of 20 participants for the final version of the “Attitudes Toward Plagiarism Questionnaire”. The results of the application showed that the participants did not have difficulty understanding the questions and were able to respond comfortably. No negative feedback was received.
Psychometric Testing of the “Attitudes Toward Plagiarism Questionnaire”
After completing the language and scope validity stages, data were collected from the sampling units using the scale form obtained from the pilot application. For the scale data collected from 500 participants, assumptions of multivariate analysis, such as variance homogeneity and multivariate normal distribution, were checked, and outliers were excluded. After removing the outliers, the data obtained were subjected to exploratory factor analysis (EFA) for construct validity analysis, and the initial model of the scale was prepared. CFA was applied to the prepared model, and the scale was finalized. Reliability tests for the validated scale were conducted using Cronbach's α internal consistency coefficient and the split-half method.
Multiple Normal Distributions
To control the assumption of multivariate normal distribution, which is one of the assumptions of multivariate analysis (Çokluk et al., 2012), outlier analysis was conducted on the dataset, and outliers were excluded from the study. The Mahalanobis Distance criterion was applied to 500 survey forms, and the number of eliminated questionnaire forms was found to be 17. Thus, 483 data forms were used for the study (Mardia, 1974). The coefficient value calculated using the “Observations farthest from the centroid (Mahalanobis Distance)” menu, a sub-menu of the AMOS program, was found to be 7.699. Since the value is less than 8, the assumption of multivariate normal distribution is satisfied (Inceoğlu, 2018). Validity and reliability analyses were applied to the scale for which the normality assumption was met.
Demographic Information of the Participants
The demographic information of the participants is provided in Table 1.
Demographic Information of Participants.
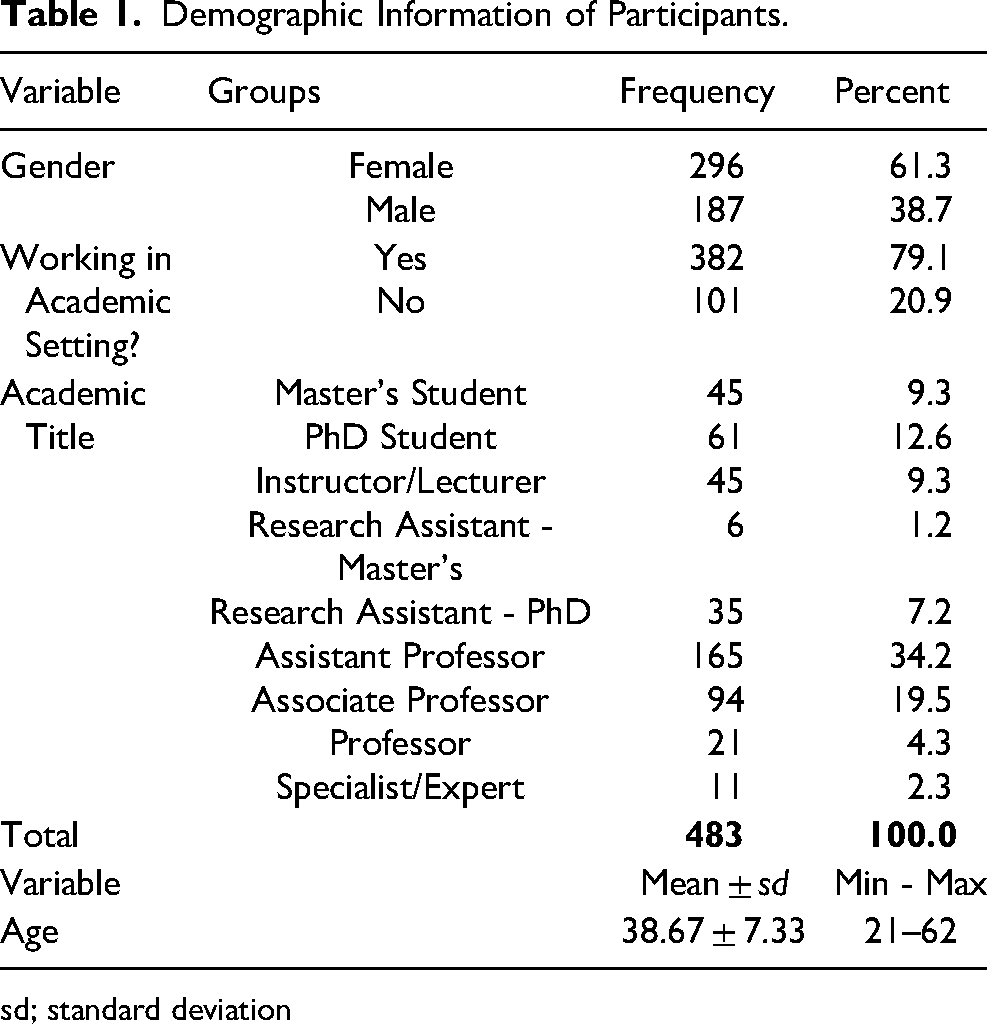
sd; standard deviation
The study included 296 female participants (61.3%) and 187 male participants (38.7%). The age range of the participants was 21–62, with a mean age of 38.67 ± 7.33 standard deviation.
Construct Validity
To assess the construct validity of the scale, EFA was conducted using a total of 483 scale forms. The Kaiser-Meyer-Olkin (KMO) test was employed as a measure of sampling adequacy, with a minimum acceptable value of 0.60. Additionally, Barlett's Test of Sphericity, which indicates the suitability of the data for EFA, was performed. A high value for Barlett's Test of Sphericity suggests that the prepared dataset is suitable for EFA (Alpar, 2020). The results of the KMO and Barlett's Test of Sphericity for the scale are presented in Table 2.
KMO ve Barlett's Test of Sphericity Test.
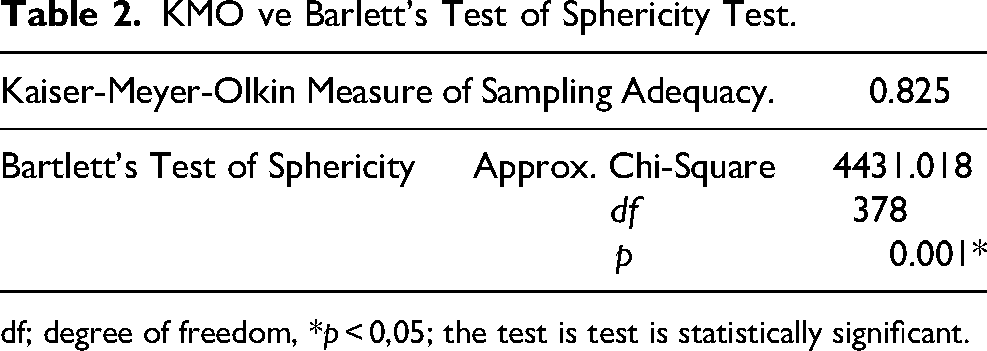
df; degree of freedom, *p < 0,05; the test is test is statistically significant.
The KMO coefficient value was calculated as 0.825, and the Barlett's Test of Sphericity yielded a value of 4431.018. Both values fall within the desired range. It can be concluded that the sample size and structure were suitable for conducting EFA (Alpar, 2020).
The results of the applied EFA, including factor loadings, corrected item-total correlations, and the percentage of variance explained, are presented in Table 3.
Factor Loadings and Item-Total Correlations of the “Attitude Towards Plagiarism Scale”.
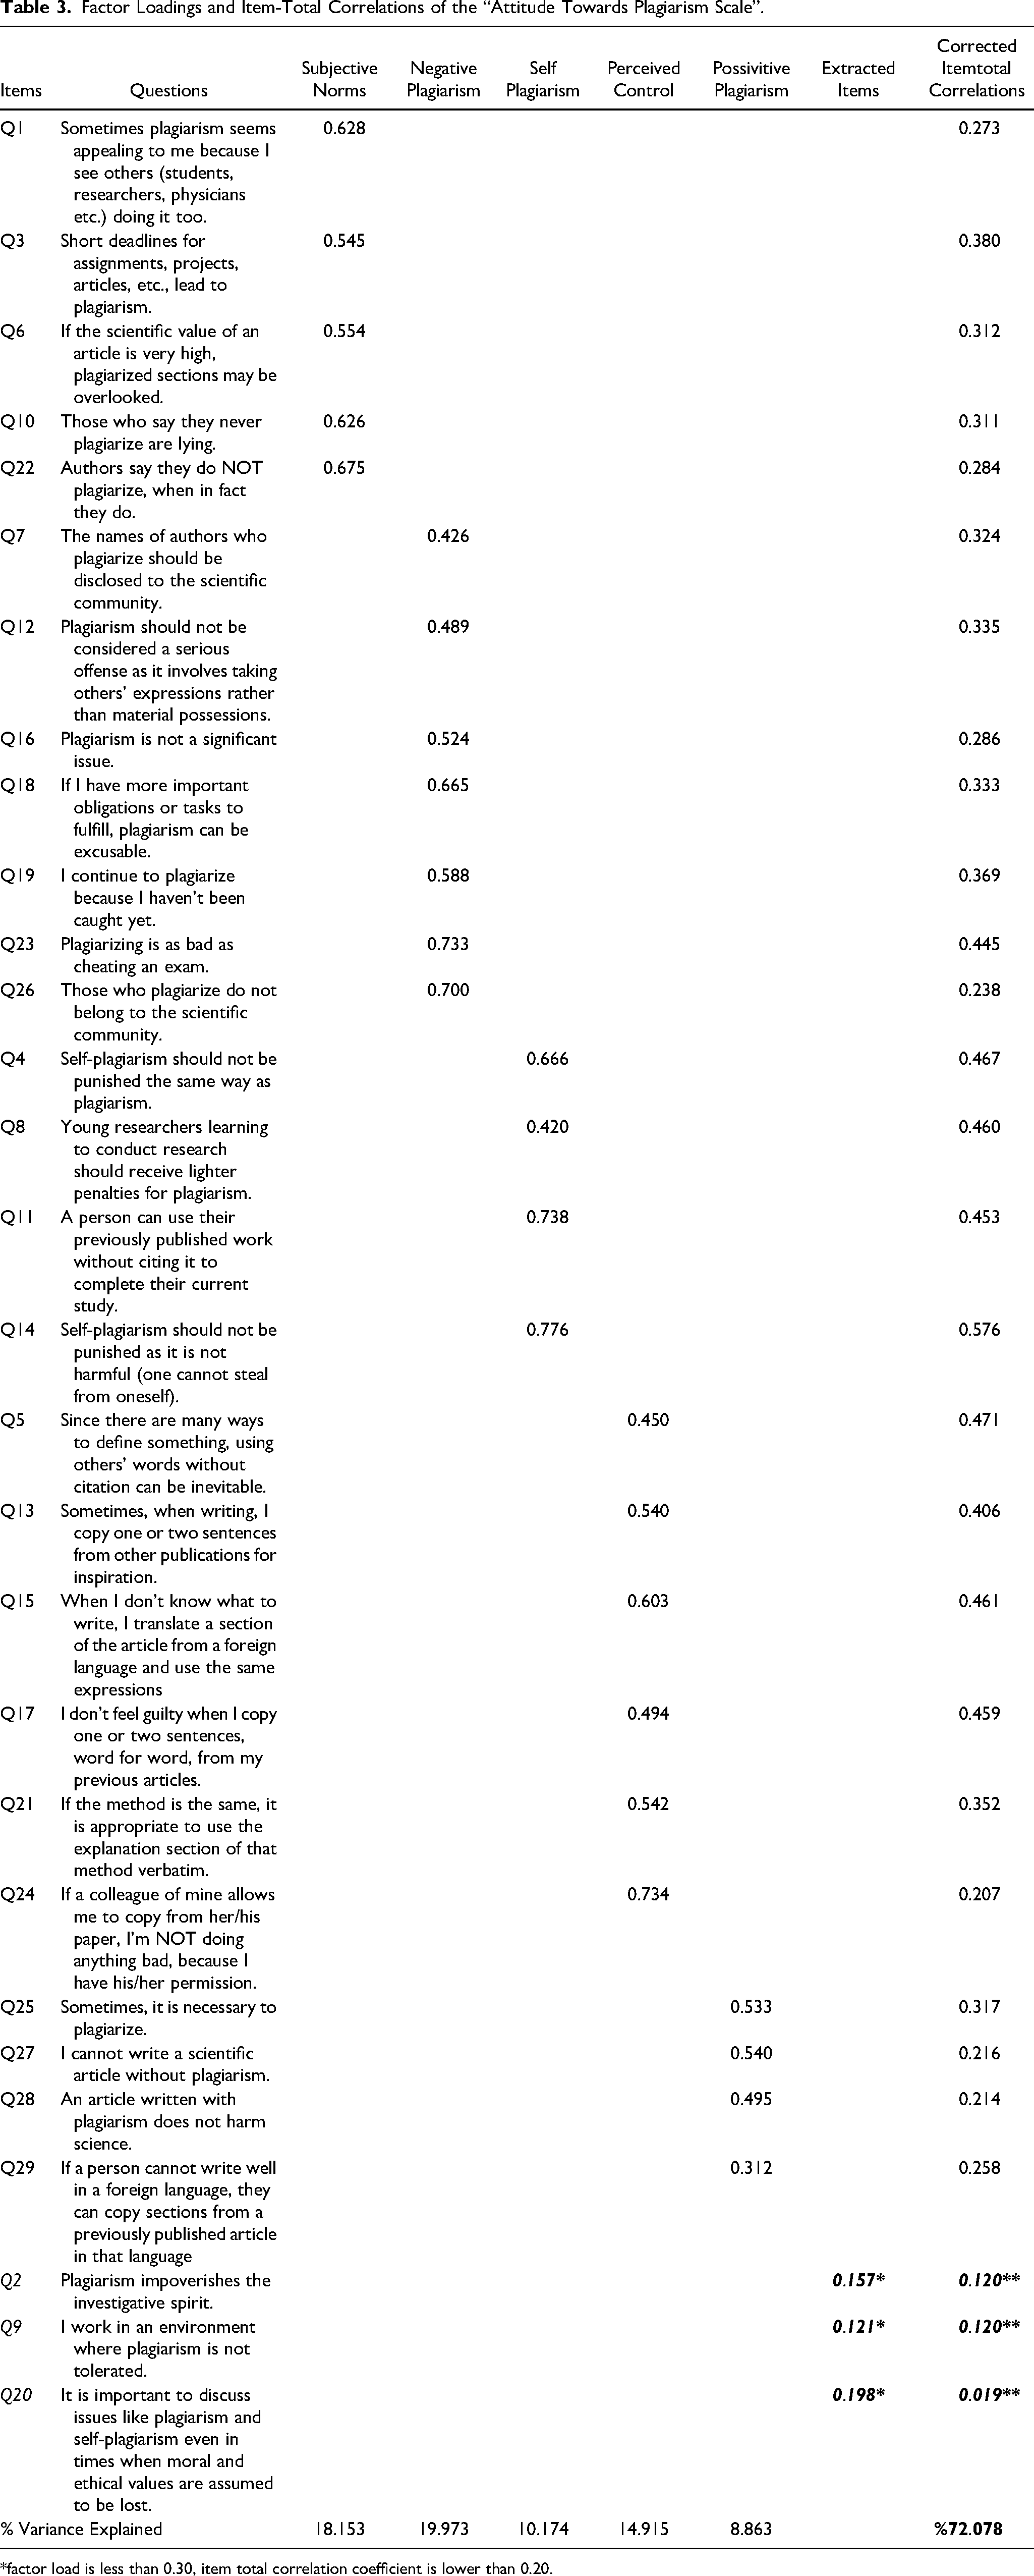
*factor load is less than 0.30, item total correlation coefficient is lower than 0.20.
The “Attitudes Toward Plagiarism Questionnaire” was modified by removing items 2, 9, and 20 due to low factor loadings and reliability. The factor structure was analyzed considering that the factor loadings for the scale items should be at least 0.30 (Büyüköztürk, 2002).
In EFA analyses, the number of factors is determined by different methods (Özdamar, 2010);
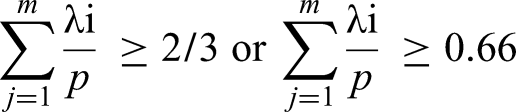
The first and most preferred criterion is the Kaisen criterion, and the roots (λ ≥ 1) greater than one in the covariance and correlation matrix are preferred. The points where the slope starts to disappear in the number of factors determined by the Scree Plot Method are taken into consideration Joliffe Criterion (taking as many factors as the number of eigenvalues greater than 0.7); as many factors as the number of eigenvalues 0.7 and greater (λ ≥ 7) are determined, It is a practical method to determine as many factors as the number of eigenvalues greater than one, Comprehensibility; selecting variables that can be explained by the structure of the variables,
The explained variance criterion; the number of factors is selected as the number of eigenvalues so that the cumulative variance explained by the eigenvalues is at least 67% (70%-95%), and it is necessary to determine the number of factors that will explain a very high variance.
There are different views on the explained variance criterion;
M to indicate the number of significant eigenvalues;
In the selection of the subdimensions, subdimensional ranges with eigenvalues above 1 and the varimax rotation method were used.
The adapted Turkish version of the “Attitudes Toward Plagiarism Questionnaire” consists of 26 items and 5 subscales. The total variance explained by the scale is calculated as 72.078, indicating that the explained variance is at the desired level for the scale (Büyüköztürk, 2002).
The first subscale, “Subjective Norms,” consists of items 1, 3, 6, 10, and 22. The factor loading values range from 0.545 to 0.675, and the percentage of explained variance is 18.153.
The second subscale, “Negative Attitude of Plagiarism,” consists of items 7, 16, 18, 19, 23, and 26. The factor loading values range from 0.426 to 0.733, and the percentage of explained variance is 19.973.
The third subscale, “Attitude Towards Self-Plagiarism,” consists of items 4, 8, 11, and 14. The factor loading values range from 0.420 to 0.776, and the percentage of explained variance is 10.174.
The fourth subscale, “Perceived Control,” consists of items 5, 13, 15, 17, 21, and 24. The factor loading values range from 0.450 to 0.734, and the percentage of explained variance is 14.915.
The fifth subscale, “Positive Attitude of Plagiarism,” consists of items 25, 27, 28, and 29. The factor loading values range from 0.312 to 0.540, and the percentage of explained variance is 8.863.
Screenplot of the scale is given in Figure 1.
The scree plot graph is not preferred because it causes illusions in studies. For this reason, it is not a preferred method when determining the number of factors. When the scale structure was examined in our study, it was seen that the model showed a 5-factor structure at the break points (Brown, 2006).
Confirmatory Factor Analysis (CFA)
CFA was conducted to test the accuracy of the scale model consisting of 26 items and 5 subscales obtained in the first stage of construct validity (Bollen & Long, 1993; Maruyama, 1998). The initial structure of the scale was prepared, and the analysis was performed. The goodness-of-fit indices obtained from the analysis were as follows: χ2 (CMIN, Chi-Square Goodness of Fit) = 1722.815, χ2/df = 5.067, RMSEA (Root Mean Square Error of Approximation) = 0.090, NFI (Normed Fit Index) = 0.619, CFI (Comparative Fit Index) = 0.666, IFI (Incremental Fit Index) = 0.670, and GFI (Goodness of Fit Index) = 0.798. Since the calculated values for the model did not meet the desired level, modifications were needed due to potential relationships within the model, measurement errors, and unanalyzed relationships (Kline, 2005).
To apply modifications, covariances were added in pairs to the error terms of observable variables (scale items). The covariances in the diagram considered the relationships between error terms within the same subscale. The purpose of including covariances in the diagram was to account for the simultaneous effect of two error terms on an abstract concept that is not known to the researcher (Civelek, 2018). The influence of external factors was included in the model through covariances, and modifications were made to the scale model. The residual terms with the highest coefficients based on the modification indices in the “Attitude Towards Plagiarism Scale” model were e1-10, e5-e24, e6-e22, e7-e23, e10-e22, e12-e18, e17-e21, e17-e24, e18-e19, e21-e24, e23-e26, and e25-e27. Covariances were drawn between these pairs of error terms in the model. The diagram of the final model of the scale is presented in Figure 2.
CFA is one of the sub-analyses of Structural Equation Modeling (SEM). In SEM analyses, multiple indices are provided and interpreted for model fit (Cole, 1987; Jöreskog & Sörbom, 1993). In the modified model of the “Attitude Towards Plagiarism Scale,” the χ2 value was found to be 1280.750, and the χ2/df value was 4.624. The RMSEA value was calculated as 0.067, confirming that the sample size is sufficient for the scale model. The GFI value increased to 0.913, the CFI value increased to 0.927, the NFI value increased to 0.910, and the IFI value increased to 0.925.
The scale model of the “Attitudes Toward Plagiarism Questionnaire” consisting of 5 sub-dimensions and 26 items, prepared through EFA, was validated through CFA by making modifications. Thus, the validity analysis of the “Attitude Towards Plagiarism Scale” has been completed.
Reliability
The Cronbach's Alpha (α) coefficient and Split-Half method were used to calculate the reliability of the scale. The Cronbach's α coefficient value ranges from 0 to 1, and values below 0.50 indicate a lack of scale reliability. As the coefficient value approaches 1, the reliability value increases (Gliem & Gliem, 2003). To increase the reliability value, the number of items in the scale can be increased (Urbina, 2014), and in cases where the number of items is low, a Cronbach's α coefficient value of 0.50 is considered an acceptable level (Raines-Eudy, 2000). Item-total correlation coefficients are also preferred for reliability. An item-total correlation coefficient value of at least 0.20 in the items of a scale is considered sufficient for reliability (Briggs & Cheek, 1986).
The “Attitude Towards Bidding Scale” underwent reliability analysis with a Cronbach's α coefficient of 0.898 (Table 4). The range of item-total correlation coefficients for the items in the scale was calculated as 0.207–0.576 (Table 3).
“Attitudes Toward Plagiarism Questionnaire” Cronbach's Alpha α and Split Half Reliability Values.
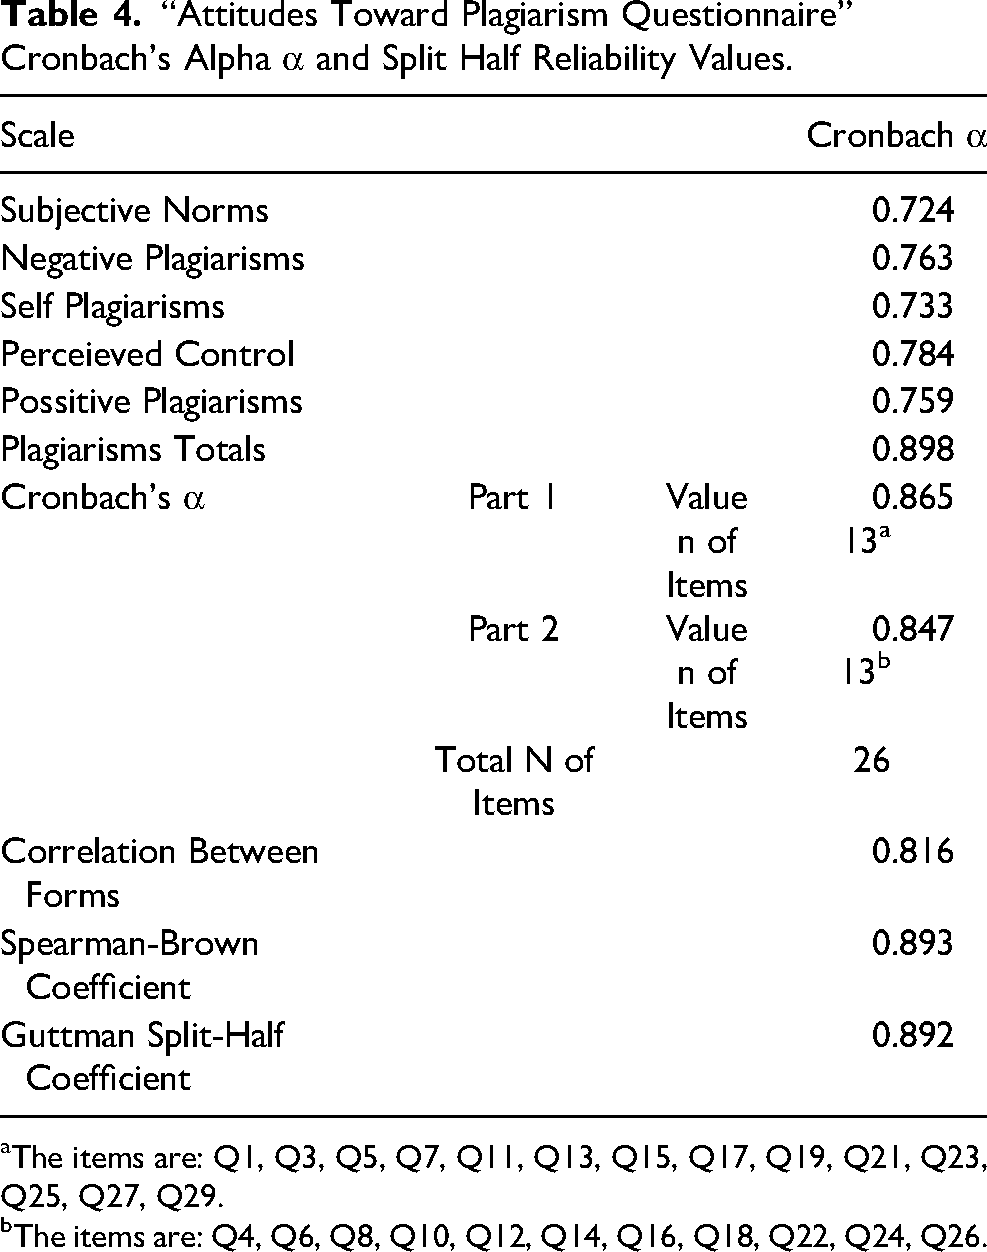
aThe items are: Q1, Q3, Q5, Q7, Q11, Q13, Q15, Q17, Q19, Q21, Q23, Q25, Q27, Q29.
bThe items are: Q4, Q6, Q8, Q10, Q12, Q14, Q16, Q18, Q22, Q24, Q26.
The “Attitudes Toward Plagiarism Questionnaire” was divided into two groups for the Split-Half method. The first group consisted of items Q1, Q3, Q5, Q7, Q11, Q13, Q15, Q17, Q19, Q21, Q23, Q25, Q27, Q29, with a calculated Cronbach's alpha (α) reliability coefficient of 0.865. The second group consisted of items Q4, Q6, Q8, Q10, Q12, Q14, Q16, Q18, Q22, Q24, Q26, with a calculated Cronbach's alpha (α) reliability coefficient of 0.847. The correlation value between the two groups was 0.816, indicating a strong positive relationship. The Spearman-Brown reliability coefficient was 0.893, and the Guttman Split-Half reliability coefficient was 0.892, indicating high levels of reliability for the scale (Alpar, 2020; Gliem & Gliem, 2003).
Scoring of the Scale: A 5-point Likert scale was used for scoring the responses in the scale. The scale items were scored as follows: 1: strongly disagree, 2: disagree, 3: neither agree nor disagree; 4: agree, 5: strongly agree. However, for items 12, 16, 18, and 19, the scoring was reversed. For these items, the scoring was as follows: 5: strongly disagree, 4: disagree, 3: neither agree nor disagree, 2: agree, 1: strongly agree.
Descriptive Statistics of the Score from the “Attitudes Toward Plagiarism Questionnaire”.
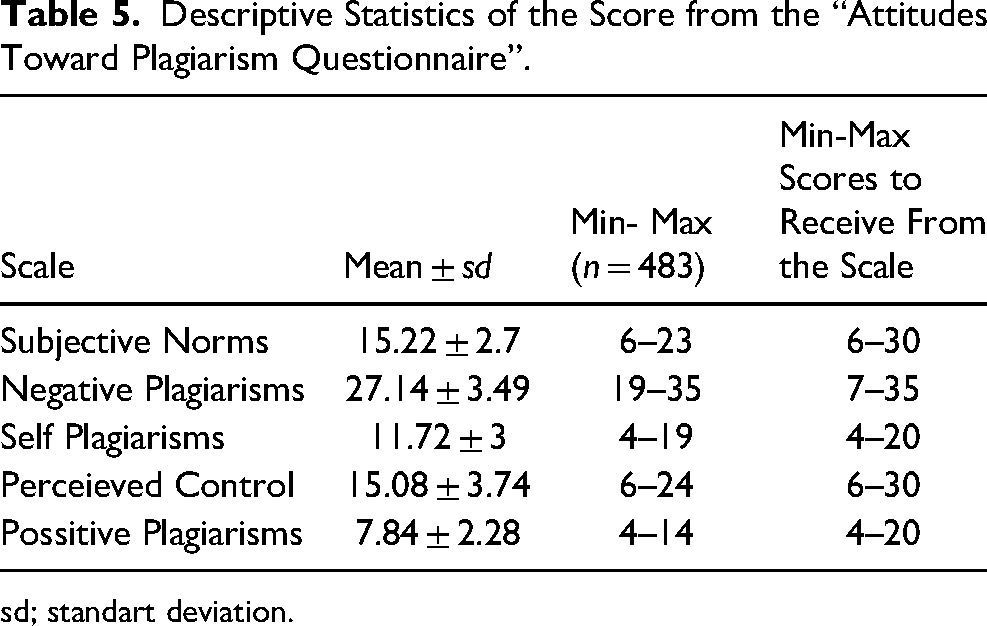
sd; standart deviation.
The sub-dimensions of the scale are as follows: Subjective norms: Items 1, 3, 6, 10, and 22, Negative attitude towards plagiarism: Items 7, 16, 18, 19, 23, and 26, Attitude towards self-plagiarism: Items 4, 8, 11, and 14, Perceived control: Items 5, 13, 15, 17, 21, and 24, Positive attitude towards plagiarism: Items 25, 27, 28, and 29.
For the 26-item scale, the score range obtained by the 483 participants is as follows: Subjective norms: 6–23, Negative attitude towards plagiarism: 19–35, Attitude towards self-plagiarism: 4–19, Perceived control: 6–24, Positive attitude towards plagiarism: 4–14. This indicates that the participants’ scores varied within these ranges for each sub-dimension of the scale (Table 5).
Discussion
The aim of this study was to conduct a validity and reliability study of the “Attitudes Toward Plagiarism Questionnaire” developed by Mavrinac et al. (2010) in Turkish. This Questionnaire is a valid, reliable, and useful tool that can be used to assess attitudes towards plagiarism.
Mavrinac et al. (2010) designed the “Attitudes Toward Plagiarism Questionnaire” following the Theory of Planned Behavior. They identified three factors from their questionnaire: positive attitude towards plagiarism, negative attitude towards plagiarism, and subjective norms. Sohrabi et al. (2018), on the other hand, incorporated perceived control as an additional factor in the “Attitudes Toward Plagiarism Questionnaire”, using all structures of planned behavior. In addition, Tajalli et al. (2022) included self-plagiarism as a factor related to attitude towards plagiarism, which was indicated by items 4, 11, and 14. For these factors, Sohrabi et al. (2018) reported Cronbach's α coefficients of 0.794, 0.748, 0.733, and 0.692, respectively, while Tajalli et al. (2022) identified five factors with Cronbach's α coefficients of 0.82, 0.73, 0.69, 0.58, and 0.64, and a total Cronbach's α of 0.81. In our study, the scale also consisted of five factors, with Cronbach's α coefficients of 0.759, 0.784, 0.733, 0.724, 0.763, and a total scale internal consistency coefficient (Cronbach's α) of 0.898.
Factor loadings of the scale items were analyzed considering a minimum value of 0.30 (Büyüköztürk, 2002). The adapted Turkish version of the “Attitude Towards Plagiarism Scale” yielded a scale structure consisting of 26 items and 5 sub-dimensions. In our study, three items (2nd, 9th, and 20th) were removed from the scale due to low factor loadings and reliability. These items were considered inappropriate for evaluating attitudes towards plagiarism in the Turkish population.
The first factor of the scale is “positive attitude towards plagiarism”, consisting of 4 items. This factor reflects how desirable, pleasant, beneficial, or enjoyable plagiarism is for individuals and is dependent on their evaluation of the consequences of plagiarism.
The second factor is “perceived control,” consisting of 6 items. It represents the degree to which an individual feels in control of whether to engage in plagiarism or not.
The third factor is “negative attitude towards plagiarism”, consisting of 7 items. This factor indicates how disturbing, unpleasant, harmful, or repulsive plagiarism appears to an individual and is dependent on their evaluation of the consequences of plagiarism.
The fourth factor is “subjective norms”, consisting of 6 items. It is related to the role of perceived social pressure in plagiarism, reflecting the impact of social influences on an individual.
Finally, the fifth factor of the scale is “self-plagiarism”, consisting of 3 items.
Sohrabi et al. (2018) found a correlation of 55.84 between the overall structure of the Attitude Towards Plagiarism Scale and four identified factors: positive attitude towards plagiarism, perceived control, subjective norms, and negative attitude towards plagiarism. In our study, the total variance explained by the scale was calculated as 72.078%, indicating a satisfactory level of explained variance for the scale (Alpar, 2012). The obtained coefficient represents a high and explanatory value for a scale with five dimensions.
The five sub-dimensions determined by EFA, consisting of 26 items, were confirmed through CFA using the AMOS program. The calculated values for the scale were as follows: χ2 value of 1280.750, χ2/df of 4.624, RMSEA of 0.067, CFI of 0.927, GFI of 0.913, NFI of 0.910, and IFI of 0.925. The χ2/df value, which indicates model significance, RMSEA, which controls the sample size, GFI, which represents the percentage of explained variance for the model, and the CFI, NFI, and IFI values, which measure overall model fit, were within the desired range. The decrease in χ2/df (χ2/sd ≤ 5) and the increase in RMSEA (RMSEA ≤ 0.08), GFI, CFI, NFI, and IFI values indicated a good fit for the model (Arbuckle, 2012; Özdamar, 2016).
Scoring of the scale was stated by Mavrinac et al. (2010) as Positive Attitude Total + Subjective Norms Total + (6 * 7 - Total of Negative Attitudes) formula, while Sohrabi et al. (2018) obtained a total score based on the scores obtained from the items. In the developed Turkish version of the scale, items 12, 16, 18, and 19 are reverse-coded. In our study, the scale model consists of 5 sub-dimensions, so the scores obtained from the items were taken into consideration for scoring. The score ranges for the scale consisting of 26 questions will vary as follows: 6–30 for subjective norms, 7–35 for negative attitude, 4–20 for self-plagiarism, 6–30 for perceived control, and 4–20 for positive attitude.
A high score on positive attitude indicates that the participant has a permissive / liberal attitude towards engaging in plagiarism (negative), while a high score in negative attitude indicates that the participant is against plagiarism (positive). High subjective norm scores indicate that the participant is aware of the prevalence of plagiarism in their environment and accepts it (negative). A high score in self-plagiarism indicates that the participant is aware of engaging in self-plagiarism and accepts it (negative). A high score in perceived control indicates that the participant is aware of engaging in plagiarism in a controlled manner.
When the scale items numbered 2, 9 and 20 were examined, it was found that the answers given were of the same weight, so there was no discrimination feature and factor loadings were found that should be removed. It was seen in the answers given by the participants that plagiarism negatively affects the studies, plagiarism for the method is acceptable by the researchers, and it is inevitable for everyone to plagiarize in their work.
Subjectice norms scores indicate that plagiarism by different groups of researchers becomes attractive to the researcher, research periods are short, plagiarism in scientifically high articles should be excused, everyone plagiarizes in their work and authors deny plagiarism. As the subjectice norms scores increase, the belief that everyone plagiarizes and the acceptability approach that it is inevitable in some studies will emerge.
Negative attitude of plagiarism scores indicate that plagiarists commit a serious crime, plagiarizing researchers should be announced to the scientific community, plagiarism is as important as theft, and even responsibilities and time constraints cannot be justified for plagiarism. As the Negative attitude of plagiarism scores increase, negative attitudes towards plagiarism will increase and the perspective of the plagiarizer will be negatively affected.
Self Plagiarism scores indicate that it is not possible to use one's own work without citing the source or plagiarizing one's own work. It is emphasized that even if a person plagiarizes himself/herself, there should be a consequence. As a person's Self Plagiarisms scores increase, it is expected that the rate of acceptance of self-plagiarism will also increase.
Perceived Control scores refer to the approaches to plagiarism in exchange for permission, when translating from a different language, when taking from one's own work, and when plagiarizing to guide the writing. As a person's Perceived Control scores increase, their attitudes towards plagiarism in the method, foreign language translation, and small sections will be positively affected.
Possitive Plagiarisms scores express positive attitudes towards plagiarism. For example, this sub-dimension scores that plagiarism is inevitable, that plagiarism is inevitable, and that plagiarism does not always cause harm. The higher a person's Possitive Plagiarisms score, the more positive their view on plagiarism will be.
Conclusion
This study provides an evaluation of the adaptation process of the “Attitudes towards Plagiarism Scale” to the Turkish context, which was conducted using a sample from Türkiye. The Turkish version of the “Attitudes towards Plagiarism Scale”, developed by Mavrinac et al. (2010), was found to be a valid and reliable tool for measuring attitudes towards plagiarism with a Turkish sample.
Our findings suggest that the scale could be an effective tool for assessing attitudes towards plagiarism, for conducting research on this element of research misconduct, hopefully providing providing a valid and reliable instrument for future studies in this field.
Educational Implications
This study provides a reliable and valid measurement tool to assess the attitudes and awareness of Turkish-speaking students and educators regarding plagiarism. The ‘Attitude Toward Plagiarism Survey’ validadted in this study can be used to measure students’ attitudes and behaviors related to plagiarism. The scale can be employed by students and academics to increase awareness and promote research integrity. The results of the scale mentioned in the study can reveal the prevalence of attitudes and behaviors related to plagiarism and identify settings where educational interventions on research integrity are needed. Such data can play a significant role in shaping educational policies and implementing measures that promote academic integrity.
Best Practices
The adaptation of the ‘Plagiarism Attitude Scale’ into Turkish can lead to collaboration with educational institutions, students, and academics, enabling more comprehensive data collection and expanding the impact of the survey. Additionally, it can contribute to educational and awareness-raising activities aimed at increasing students’ awareness in this regard and promoting initiatives that support research integrity. Conducting repeated measurements over time can provide more comprehensive information about the long-term validity and reliability of the survey in a perticular setting. Such longitudinal instituitional data can be valuable in assessing changes in the attitudes of students and academics over time and the impact of educational and remedial interventions.
Applying the scale to different age groups and educational levels can help gain a more comprehensive understanding of how attitudes and behaviors related to research ethics may vary. In addition to student communities, having educators such as teachers and academics fill out the survey can provide different perspectives.
Research Agenda
Future research can focus on further validating the cross-cultural applicability of the Plagiarism Attitude Scale by adapting and confirming the survey in other languages and cultural contexts. This will facilitate comparative analysis of attitudes towards plagiarism across different languages and cultures, fostering a more comprehensive international understanding of the phenomenon. Examining differences in attitudes towards plagiarism among students from various academic disciplines can also provide valuable insights into the role of disciplinary culture in shaping these attitudes. Understanding these differences can inform discipline-specific approaches to research ethics education. Comparing the validity and reliability of the Turkish version of the survey with similar surveys translated into other languages can provide opportunities for comparing attitudes and behaviors in different cultural contexts. Such studies are important for a better understanding of general trends related to research integrity.
Future research can also explore the relationship between attitudes towards plagiarism, self-reported instances of plagiarism, and measures of similarity in academic work. This exploration can assist in evaluating the validity of the survey and its ability to predict actual plagiarism behaviors. Studies focused on assessing institutional policies and practices related to plagiarism prevention and detection can identify areas for improvement and best practices in promoting research ethics at different education levels.
Investigating the role of technology in plagiarism detection and prevention is an important research area. Research on the use of plagiarism detection software and other technological tools in educational institutions can shed light on their impact on attitudes and behaviors related to plagiarism. Addressing these research agendas can contribute to the advancement of knowledge, the promotion of research integrity and the development of effective strategies to combat plagiarism in the Turkish educational context.
Footnotes
Author Contributions
GÖG: conceptualization, data collection, data analysis, reviewing literature, writing original draft; ŞY: methodology, data collection, data analysis, reviewing literature, writing original draft; FI: methodology, participation in data collection and analysis, reviewing and editing drafts of manuscript. FI: methodology, data collection, data analysis, reviewing literature, writing original draft. All authors read and approved the final manuscript.
Author's Note
Gamze Özbek Güven is also affiliated at Department of Medical History and Ethics, School of Medicine, Yuksek Ihtisas University, Ankara, Türkiye.
Declaration of Conflicting Interests
The author(s) declared no potential conflicts of interest with respect to the research, authorship, and/or publication of this article.
Funding
The authors received no financial support for the research, authorship, and/or publication of this article.