
Abstract
This study was designed to validate the factor structure of the Startle and Surprise Inventories using multilevel confirmatory factor analysis in an ecologically valid flightdeck setting. The Startle and Surprise Inventories were developed to assess self-report startle and surprise to target stimuli. As their use expands in operational settings, construct validity should be further examined in contexts with ecological validity. 208 observations were collected from 26 professional pilots exposed to eight scenarios with varied levels of startle and surprise in a motion-based simulator. After each scenario, pilots completed the Startle and Surprise Inventories. A two-factor model, comprising the constructs Startle and Surprise, demonstrated superior and acceptable fit over a one-factor model. All items demonstrated significant factor loadings at both within- and between-scenario levels in the two-factor solution. McDonald’s ω ranged from ω = 0.88 to ω = 0.96 for the Startle Inventory, and ω = 0.77 to ω = 0.96 for the Surprise Inventory, indicating acceptable to excellent internal consistency. The findings offer empirical support for the construct validity and reliability of the Startle and Surprise Inventories in a highly ecologically-valid setting. The validated and reliable measures can inform evidence-based safety training protocols and interventions in aviation and other safety-critical domains.
Introduction
Aviation operations are inherently demanding, requiring pilots to judge situations correctly and apply appropriate procedures to ensure safety and efficiency. When exposed to sudden and unexpected events, pilots sometimes need to make split-second decisions. In such emergency situations, pilots may experience startle, surprise, or both. These responses could impair pilot performance (Landman et al., 2017b; Martin et al., 2015), while the resulting stress may further exacerbate their effects by degrading teamwork coordination, narrowing attentional, prompting rushed and unsystematic decision-making, and leading to task shedding (Dismukes et al., 2015; Salas et al., 2013).
Startle is a response to abrupt, intense (auditory, somatosensory, vestibular or visual) stimuli perceived as potentially threatening, characterized by involuntary physiological startle reflexes and generalized stress responses (Blumenthal, 2015; Koch, 1999; Martin et al., 2015). The startle reflex, occurring typically within 100 milliseconds after a stimulus, may involve a range of rapid motor responses, including eyeblinks, head movements, facial grimacing, shoulder elevation, arm abduction, elbow bending, forearm pronation, finger flexion, and abdominal contraction (Ladd et al., 2000; Leuchs et al., 2019). Following the reflex, generalized stress responses could be triggered, characterized by increased skin conductance, elevated systolic blood pressure, accelerated heart rate and pupil dilation (Dreissen et al., 2012; Holand et al., 1999). While the initially startle could impair performance due to transient physiological disruptions (typically lasting 1 to 3 s), individuals often recover rapidly. The overall impact on performance varies depending on task complexity and the contextual factors (Duchevet et al., 2025; Landman et al., 2017b; May & Rice, 1971; Staal, 2004; Thackray, 1965; Thackray & Touchstone, 1983).
Surprise is a cognitive and affective response, primarily evoked by unexpected (schema-discrepant) stimuli or events (Horstmann, 2006; Landman et al., 2017a; Meyer et al., 1997). It consists of responses to the unexpectedness of events, and subsequent sensemaking process of the schema discrepancy (Noordewier et al., 2016). Unexpectedness causes an automatic interruption of ongoing mental processes and signals a failure to anticipate future events, which can be disruptive and distressing due to the innate need for predictability. The occurrence of surprise is thought to alert individuals of the discrepancy, and motivate efforts to deeper learning or schema revision, leading to improved cognitive flexibility and adaptability (Reisenzein et al., 2019). However, if the discrepancy remains unresolved, the situation may be perceived as poorly understood, hindering the ability to focus on relevant information, make accurate projections, and execute appropriate actions.
To accurately investigate the causes and consequences of startle and surprise, it is essential to quantify these responses with validated and reliable measures. Such quantification allows for a deeper understanding of their physiological correlates, recovery dynamics, and task vulnerabilities to unexpected stimuli. In aviation, this approach enables the identification of factors that impair pilot performance during unforeseen emergencies, thereby informing the development of evidence-based strategies to mitigate adverse effects and enhance operational effectiveness in high-stakes environments.
The previous research detailed the development and preliminary validation of the multi-item Startle and Surprise Inventories (Startle-I; Surprise-I) and the single-item Visual Analogue Scales for Startle and Surprise (Startle-VAS; Surprise-VAS), which were designed to assess individuals’ startle and surprise responses to specific stimuli/events (Chen et al., 2025a). There are six statements in the Startle-I and five statements in the Surprise-I (Chen et al., 2025). Individuals indicate to what extent they agree with the statements on 5-point Likert scales (1 = “Strongly disagree”, 2 = “Disagree”, 3 = “Neutral”, 4 = “Agree”, 5 = “Strongly agree”). The more time-efficient Startle-VAS and Surprise-VAS require individuals to answer the question, “How
The validation of the self-report measures started with content validation, during which seven experts in the fields of Cognitive Science and Psychology assessed the relevance of 21 items, which were derived from fundamental and applied literature on startle (Blumenthal, 1988; Bradley et al., 2005; Koch, 1999; Ladd et al., 2000; Lang et al., 1990; Martin et al., 2015) and surprise (Izard et al., 1993; Klein et al., 2007; Landman et al., 2017a; Meyer et al., 1997; Rivera et al., 2014). Based on this assessment, 19 items was retained for the multilevel exploratory factor analysis (ML-EFA) to examine the construct validity. To capture variation in responses, a group of 81 participants were exposed to nine video stimuli, designed to elicit varying levels of startle and surprise. The ML-EFA resulted in an 11-item two-factor structure.
Concurrent validity of the Startle-VAS and Surprise-VAS was supported by significant correlations between the Startle-VAS and Startle-I scores, and between the Surprise-VAS and Surprise-I scores, respectively. These correlations ranged from ρ = 0.778 to ρ = 0.877 for the Startle-VAS, and from ρ = 0.681 to ρ = 0.903 for the Surprise-VAS across the video stimuli, providing empirical support for the visual analogue scales.
Both exploratory factor analysis (EFA) and confirmatory factor analysis (CFA) aim to determine latent factors which optimally account for the variance-covariance among observed variables or indicators. The EFA is instrumental in uncovering the latent factor structure within a set of observed variables without a predefined structure. As a data-driven method EFA requires no a priori assumptions, but it cannot be applied to test hypothesized factor structures against the observed data (Byrne, 2006). In contrast, CFA adopts a hypothesis-driven approach to test hypothesized factor structures while assessing the model fit to the data. The analysis incorporates various goodness-of-fit indices, including the significance of χ2 test (Satorra & Bentler, 2001), Comparative Fit Index (CFI; Bentler, 1990), Tucker–Lewis Index (TLI; Marsh et al., 1988), Root Mean Square Error of Approximation (RMSEA; Steiger, 1990), and Standardized Root Mean Square Residual (SRMR; Hu & Bentler, 1999). Construct validity can be established through CFA by evaluating whether the observed data align with the hypothesized factor structure, ensuring that the measures adequately represent the theoretical constructs they are designed to measure.
Multilevel confirmatory factor analysis (MCFA) extends confirmatory factor analysis to accommodate hierarchical or clustered data structures (Heck & Thomas, 2020; Kline, 2023; Muthén, 1994). Such structures often arise from individuals nested within groups, or repeated-measures nested within individuals. In these contexts, the assumption of independent observations is violated, leading to inflated Type I error rates if clustering is ignored. The ‘‘clustering effect’’ is typically quantified using the intraclass correlation coefficient (ICC), which estimates the proportion of total variance attributable to between-cluster variance (Reise et al., 2005). In intervention studies with nested designs, even an ICC as low as 0.05 can substantially impact statistical power (Candlish et al., 2018). By accounting for the clustered nature of data, MCFA provides more precise and reliable estimates of factor loadings and variances, minimizing biases introduced by data non-independence (Brown, 2015). This method is essential for validating constructs across clustered levels, ensuring that the measures accurately reflect the constructs at both the within- and between-cluster levels (Muthén, 1994).
In this study, we aim to systematically validate the factor structure of the Startle and Surprise Inventories in a highly ecologically-valid aviation setting through MCFA. Ecological validity is operationalized through the use of aviation manual control tasks, the inclusion of action-relevant in-flight startling and/or surprising events, and the simulation of performance consequences, such as loss of control. Based on the established two-factor model identified from the ML-EFA (Chen et al., 2025a), we hypothesize that the model demonstrates a good fit both at the within- and between-cluster levels.
A representative sample group of professional pilots was recruited, and simulated in-flight scenarios were used to elicit startle and surprise responses. Events in most of the scenarios were found to be effective to elicit startle and surprise responses in pilots (Chen et al., 2024), although those findings were based on subjective, non-validated self-report measures. The present construct validation aims to address this limitation by providing a more rigorous empirical foundation for the Startle and Surprise Inventories, with the broader aim of informing the development of evidence-based safety protocols and enhancing the effectiveness of intervention training in aviation contexts.
Method
Participants
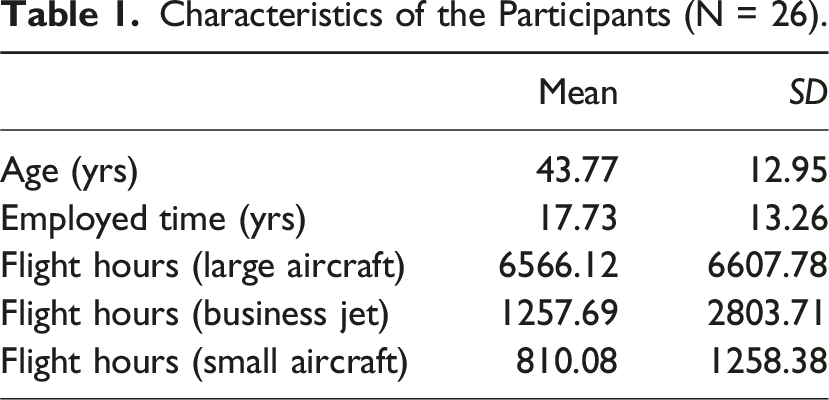
Characteristics of the Participants (N = 26).
Apparatus
The experiment was conducted in the SIMONA Research Simulator (Figure 1(a)) at the Delft University of Technology (Stroosma et al., 2003). This is a full motion simulator with a six degrees of freedom hydraulic hexapod motion system. The simulator has a collimated 180° horizontal by 40° vertical field of view for outside vision rendered with FlightGear. A 5.1 surround sound system was installed for realistic 3D sound effects of potential alarms, flaps, retractable gear, aerodynamic noise, ground rumble and engines, which is beneficial to establish a highly credible flightdeck operational environment. During the experiment, participants wore single-ear intercom headsets (ClearCom CC-110-X4). SIMONA Research Simulator and flight deck used in the experiment.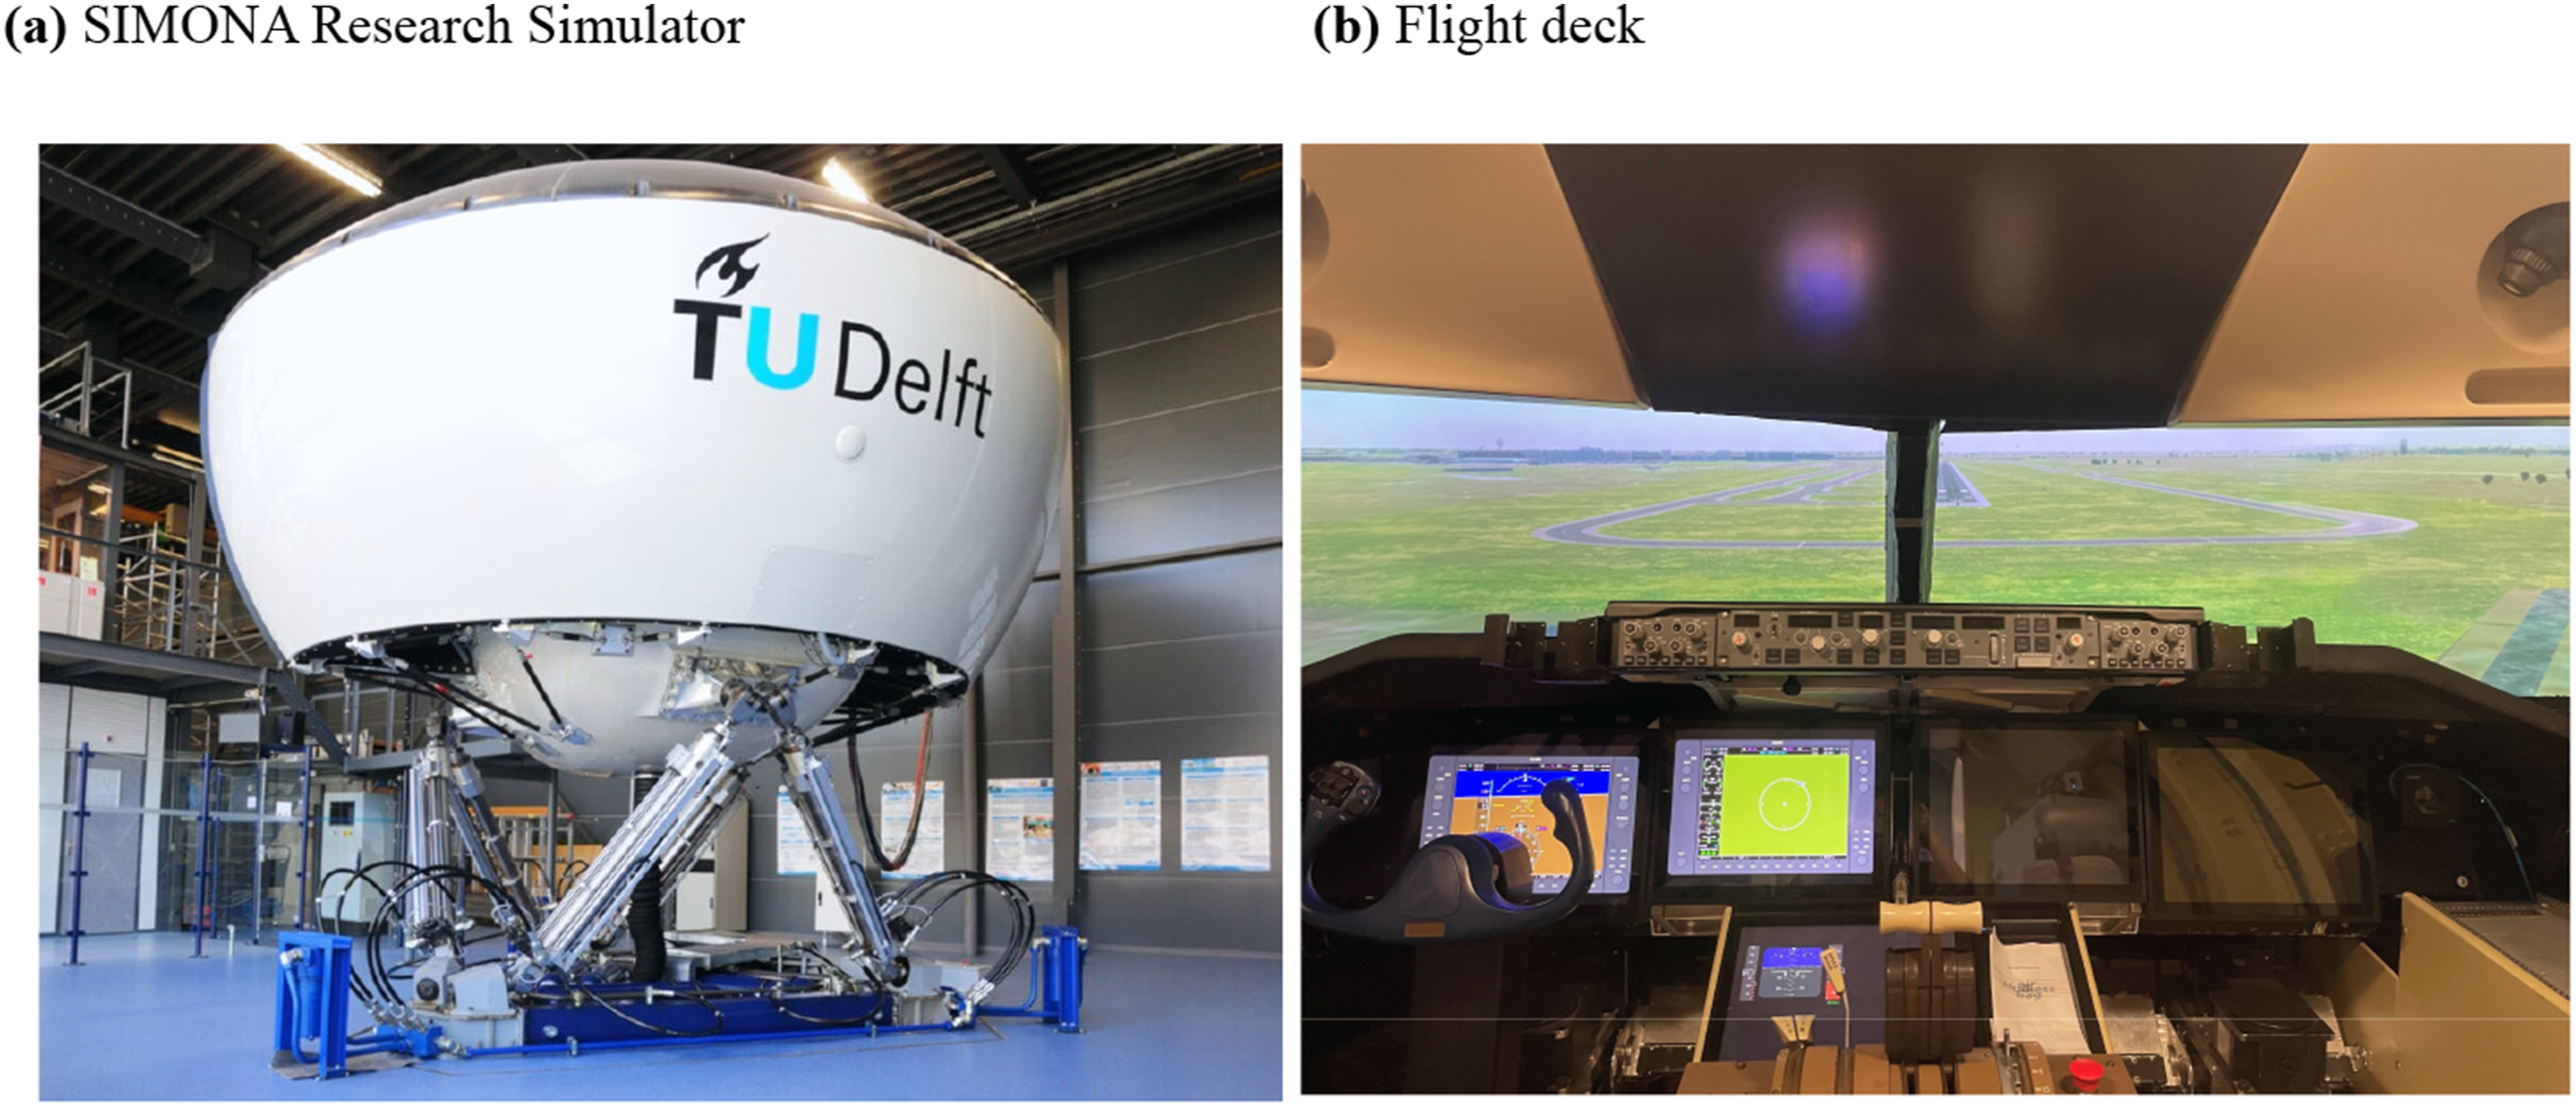
A generic model of the Piper PA-34 Seneca III, a light multi-engine piston (MEP) aircraft, served as the aircraft model throughout the experiment. The flight controls (Figure 1(b)) included a control column with pitch trim, rudder pedals with force feedback, throttle, gear, and flaps with three settings: 0° (UP), 25° and 40° (LAND). The avionics consisted of a primary flight display (PFD) similar to a G1000 PFD, a backup primary flight display, and a multi-function display for engine, configuration, and navigation data. Information on airspeed, altitude, attitude, engine parameters, flap position, and gear status was available via the avionics displays.
Tasks and Conditions
Experiment Procedure
A within-subjects experimental design was used, consisting of eight test scenarios with varied startling and surprising events presented to all 26 participants. The experiment procedure included briefing, familiarization, test session, and debriefing, and lasted approximately 2 hours per participant.
During the briefing, pilots received instructions on the simulator features, aerodynamic model, concepts of startle and surprise, and the ‘‘standard traffic pattern’’ (Figure 2). Startle was explained to participants as ‘‘a rapid, involuntary reaction to an abrupt and intense stimulus, typically perceived as a threat’’, and surprise was described as ‘‘a cognitive-affective response evoked by unexpected stimulus or events’’ with practical examples to clarify their mechanisms and implications. Standard traffic pattern used in the scenarios with required settings.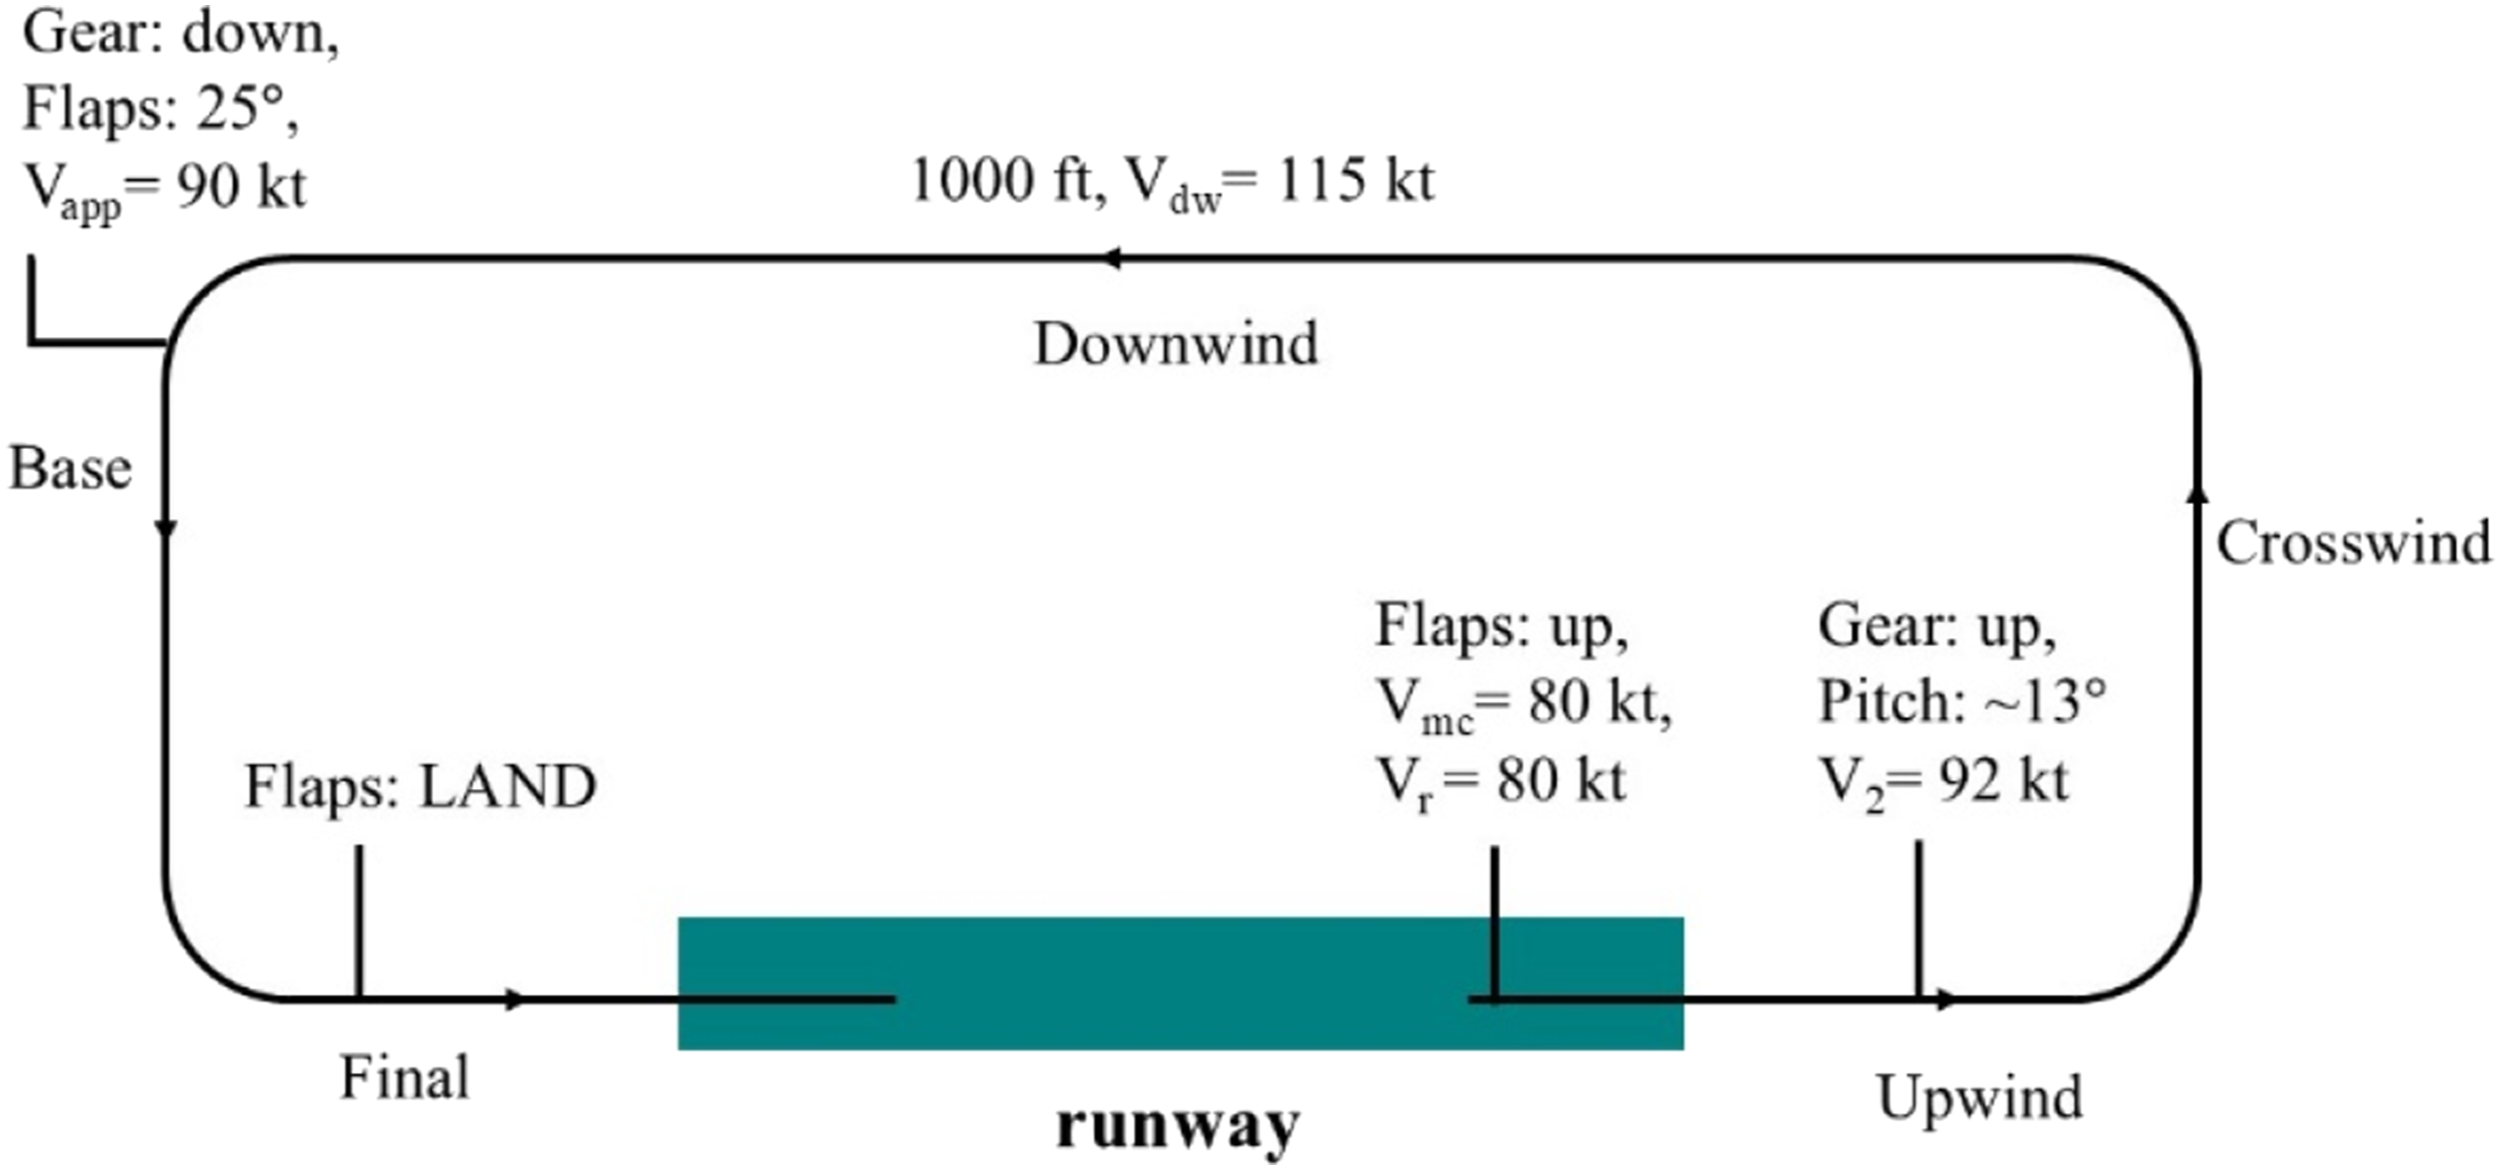
This circuit was left-handed, started and ended on runway 18C, Schiphol Airport (EHAM). It was to be flown at 1000 ft with a speed of 115 kt. The flaps setting of 0° (UP) was required during take-off, 25° in base leg and 40° (LAND) in final leg. Rotate speed was 80 kt, minimum control speed was 80 kt, best climb speed was 92 kt, and landing approach speed was 90 kt. Pilots had these configurations also available on a kneepad. Pilots practised flying the circuit without crosswind in the familiarization session. By the end of the familiarization, all pilots confirmed that they could handle the aircraft model satisfactorily as single-pilot crew, with none requiring assistance in identifying the turn points of the circuit.
Description of Preset Events and Intended Startle/Surprise Responses across Scenarios.
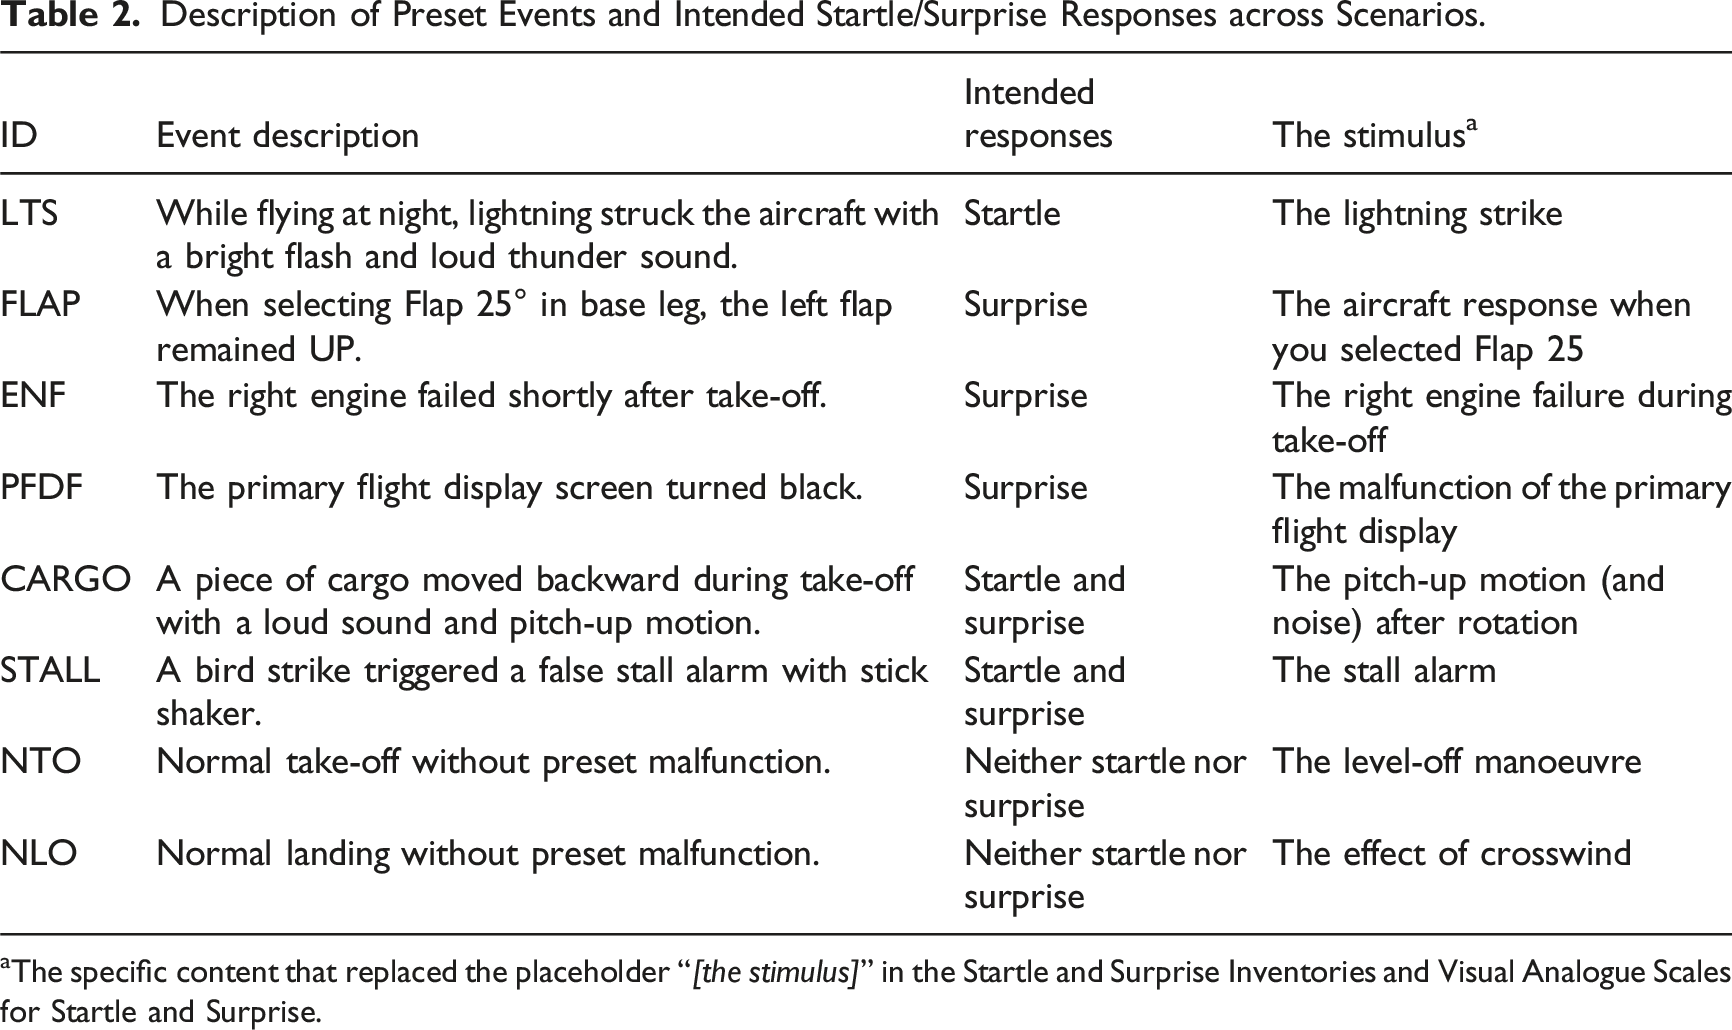
aThe specific content that replaced the placeholder ‘‘[the stimulus]’’ in the Startle and Surprise Inventories and Visual Analogue Scales for Startle and Surprise.
From 5 to 15 s before the startling or surprising event onset until 28 s after, pilots also performed a secondary auditory task that was used to measure information-processing performance in a different study (Chen et al., 2025b). Numbers ranging from 0 to 9, were presented through a headset at 2.5 s intervals in an auditory format, and pilots responded with a single autopilot disconnect button press for odd number and a double button press for even number. This button was located on the control column near the left thumb.
Immediately following each test scenario, pilots were instructed to complete the Startle and Surprise Inventories and Visual Analogue Scales assessing their startle and surprise levels, referring to the events that had just occurred in that scenario. After completing the eight scenarios, pilots were debriefed about the specifics of all simulated events in each scenario.
Test Scenarios
We aimed to include events that would elicit varied levels of startle and surprise. The characteristics of the scenarios are listed in Table 2, in which the third column indicates whether the preset event in each scenario was intended to induce startle, surprise, both, or neither. Startle was triggered by the sudden onset of intense auditory, visual, or vestibular stimuli. Surprise was intended to arise from situations that pilots did not expect. Scenarios designed to elicit neither startle nor surprise did not contain unexpected nor sudden events.
The lightning strike scenario (LTS) was designed to be highly startling due to the sudden bright flash and loud thunder sound, but not (limited) surprising due to the stated weather conditions. This scenario took place at night and began in the in-flight position. During landing (5 s after descending 500 ft), a lightning strike was simulated, accompanied by a loud thunder sound and a flash of light. The thunder was simulated using a surround sound system in the simulator, with the sound played at 99 dB (including ambient noise). The lightning flash was simulated using a strobe light mounted on the projection system. It overpowered the regular night-time outside visual with a strong flash over the entire out-the-window field of view. To mitigate surprise, the METAR for this scenario included ‘‘TSRA’’ (thunderstorm with rain), which signalled the possibility of thunderstorms.
The flap asymmetry (FLAP), engine failure (ENF), and primary flight display failure (PFDF) scenarios were designed to elicit surprise but no (or very limited) startle. In FLAP, participants encountered a malfunction when selecting Flaps 25° in base leg. The left flap remained in the UP position, causing an unexpected roll and yaw moment that could be counteracted using the column. In ENF, the right engine failed during take-off (5 s after reaching 900 ft), causing a roll and yaw moment that could be counteracted using the column and pedals. The PFDF started in the in-flight position. The PFD malfunctioned and went black during landing at 600 ft. Pilots could use the outside view or the backup display to continue landing.
The cargo shift (CARGO) and false stall warning (STALL) scenarios were designed to elicit both startle and surprise responses. In CARGO, a simulated piece of heavy cargo broke loose and shifted towards the tail after take-off (10 s after reaching 200 ft), with a loud scraping and collision noise coming from the back of the aircraft. This moved the centre of gravity backward temporarily, resulting in a violent pitch-up moment that was difficult to counteract. In STALL, a bird strike occurred during the climbing (20 s after reaching 800 ft), impacting the angle of attack vane with a sharp noise. This triggered a continuous false stall alarm consisting of a stick shaker and stall aural warning.
The normal take-off (NTO) and normal landing (NLO) scenarios featured no preset startling/surprising events during the circuit and were intended to induce low levels of startle and surprise. NTO and NLO started in the take-off and in-flight positions, respectively.
Measures of Startle and Surprise
Restructured Startle and Surprise Inventories.
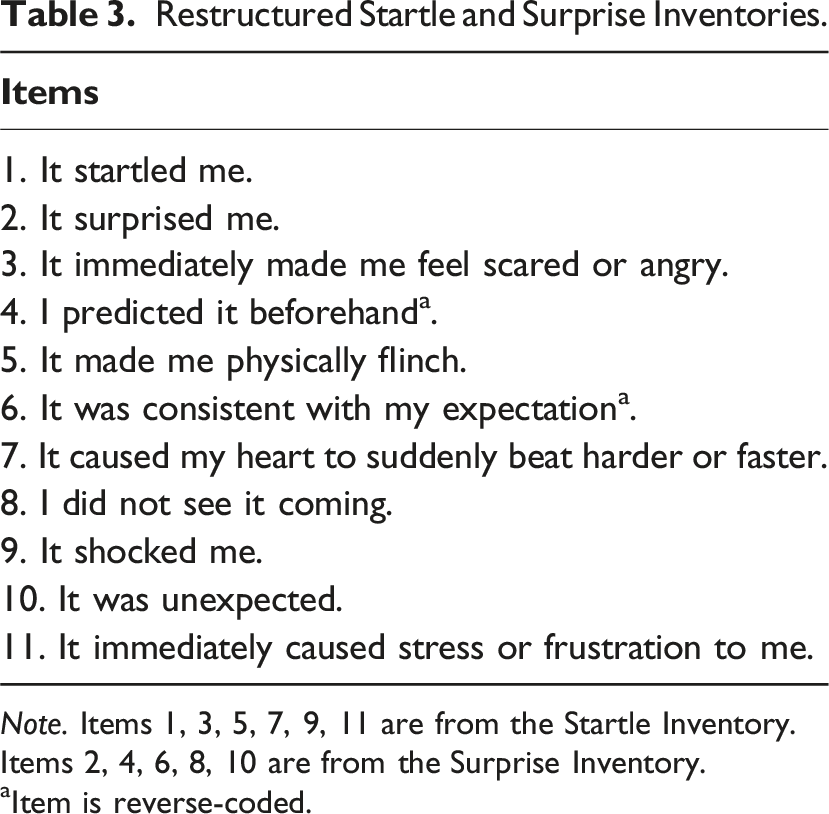
Note. Items 1, 3, 5, 7, 9, 11 are from the Startle Inventory.
Items 2, 4, 6, 8, 10 are from the Surprise Inventory.
aItem is reverse-coded.
Statistical Analysis
Two-way ANOVA and ICCs
The scores on reverse-coded items 4 and 6 were first reversed. To determine whether the data from Startle-I and Surprise-I for the MCFA should be clustered over scenarios or participants, a two-way ANOVA was performed to examine the relative amount of variance on each item attributed to the factor Scenario and the factor Participant.
To assess the proportion of between-level variance relative to the total variance, ICCs were calculated for each item. The ICCs serve to evaluate whether a MCFA was necessary instead of a single-level CFA, as sufficiently high between-level variance (ICC > 0.05; Candlish et al., 2018) justifies the use of MCFA to account for clustered data structure.
Multilevel Confirmatory Factor Analysis
The factor structure of the 11 items in the Startle and Surprise Inventories was analysed using MCFA for the clustered dataset (Mehta & Neale, 2005). MCFA was performed using the lavaan package in R to test and compare two models: an 11-item, two-factor model comprising the factors Startle and Surprise as identified in a previous ML-EFA (Chen et al., 2025a), and an 11-item, one-factor model, in which all 11 items are considered as variables of a single factor.
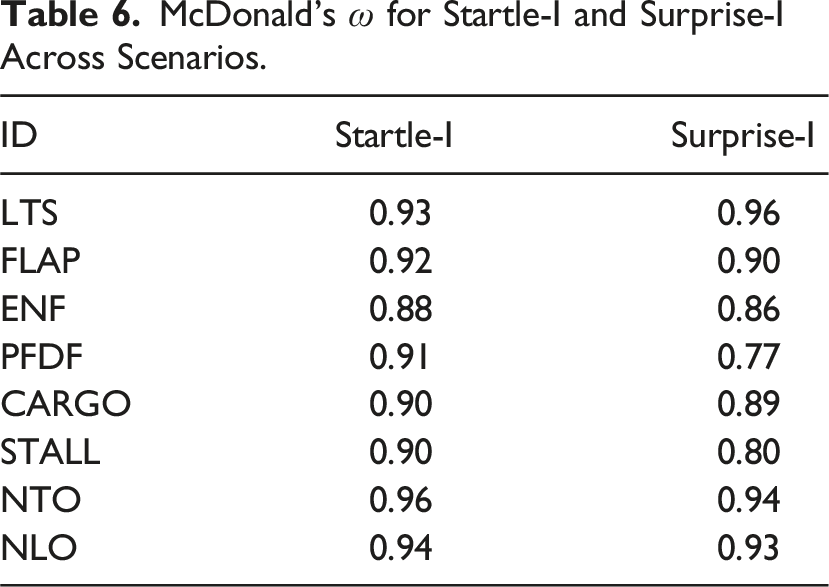
The model goodness-of-fit was deemed acceptable if the χ2 value was non-significant (Satorra & Bentler, 2001), CFI and TLI are greater than 0.90 (Bentler, 1990), and RMSEA (Steiger, 1990) and SRMR (both within- and between-level) are below 0.10 (Hu & Bentler, 1999). To further investigate the relationship between the factors Startle and Surprise in the two-factor model, standardized covariances between these two factors were computed at both the within- and between-level. The internal consistency was examined by obtaining McDonald’s ω (McDonald, 2013) of the Startle-I and Surprise-I for each scenario, with values greater than 0.70 indicating acceptable internal consistency (Meade et al., 2008; Nunnally, 1994).
Manipulation Checks
To check whether designed scenarios induced the intended responses of startle and surprise, manipulation checks were conducted. Two linear mixed-effects models were applied to account for the repeated-measures design, with heteroscedasticity modelled in the residual structure. The scores obtained from the Startle-I (startle_inventory) and the Surprise-I (surprise_inventory) were modelled as functions of the stimulus (stimulus) in the test scenarios, a categorical fixed effect with eight levels. Participants with assigned identifier numbers (ID) were included as a random effect to account for the individual differences. The function lme from the nlme package in R was applied to fit the following models:
Results
Two-way ANOVA and ICCs
Two-way ANOVA Results and Estimated Intraclass Correlation Coefficient (ICC) for Each Item.
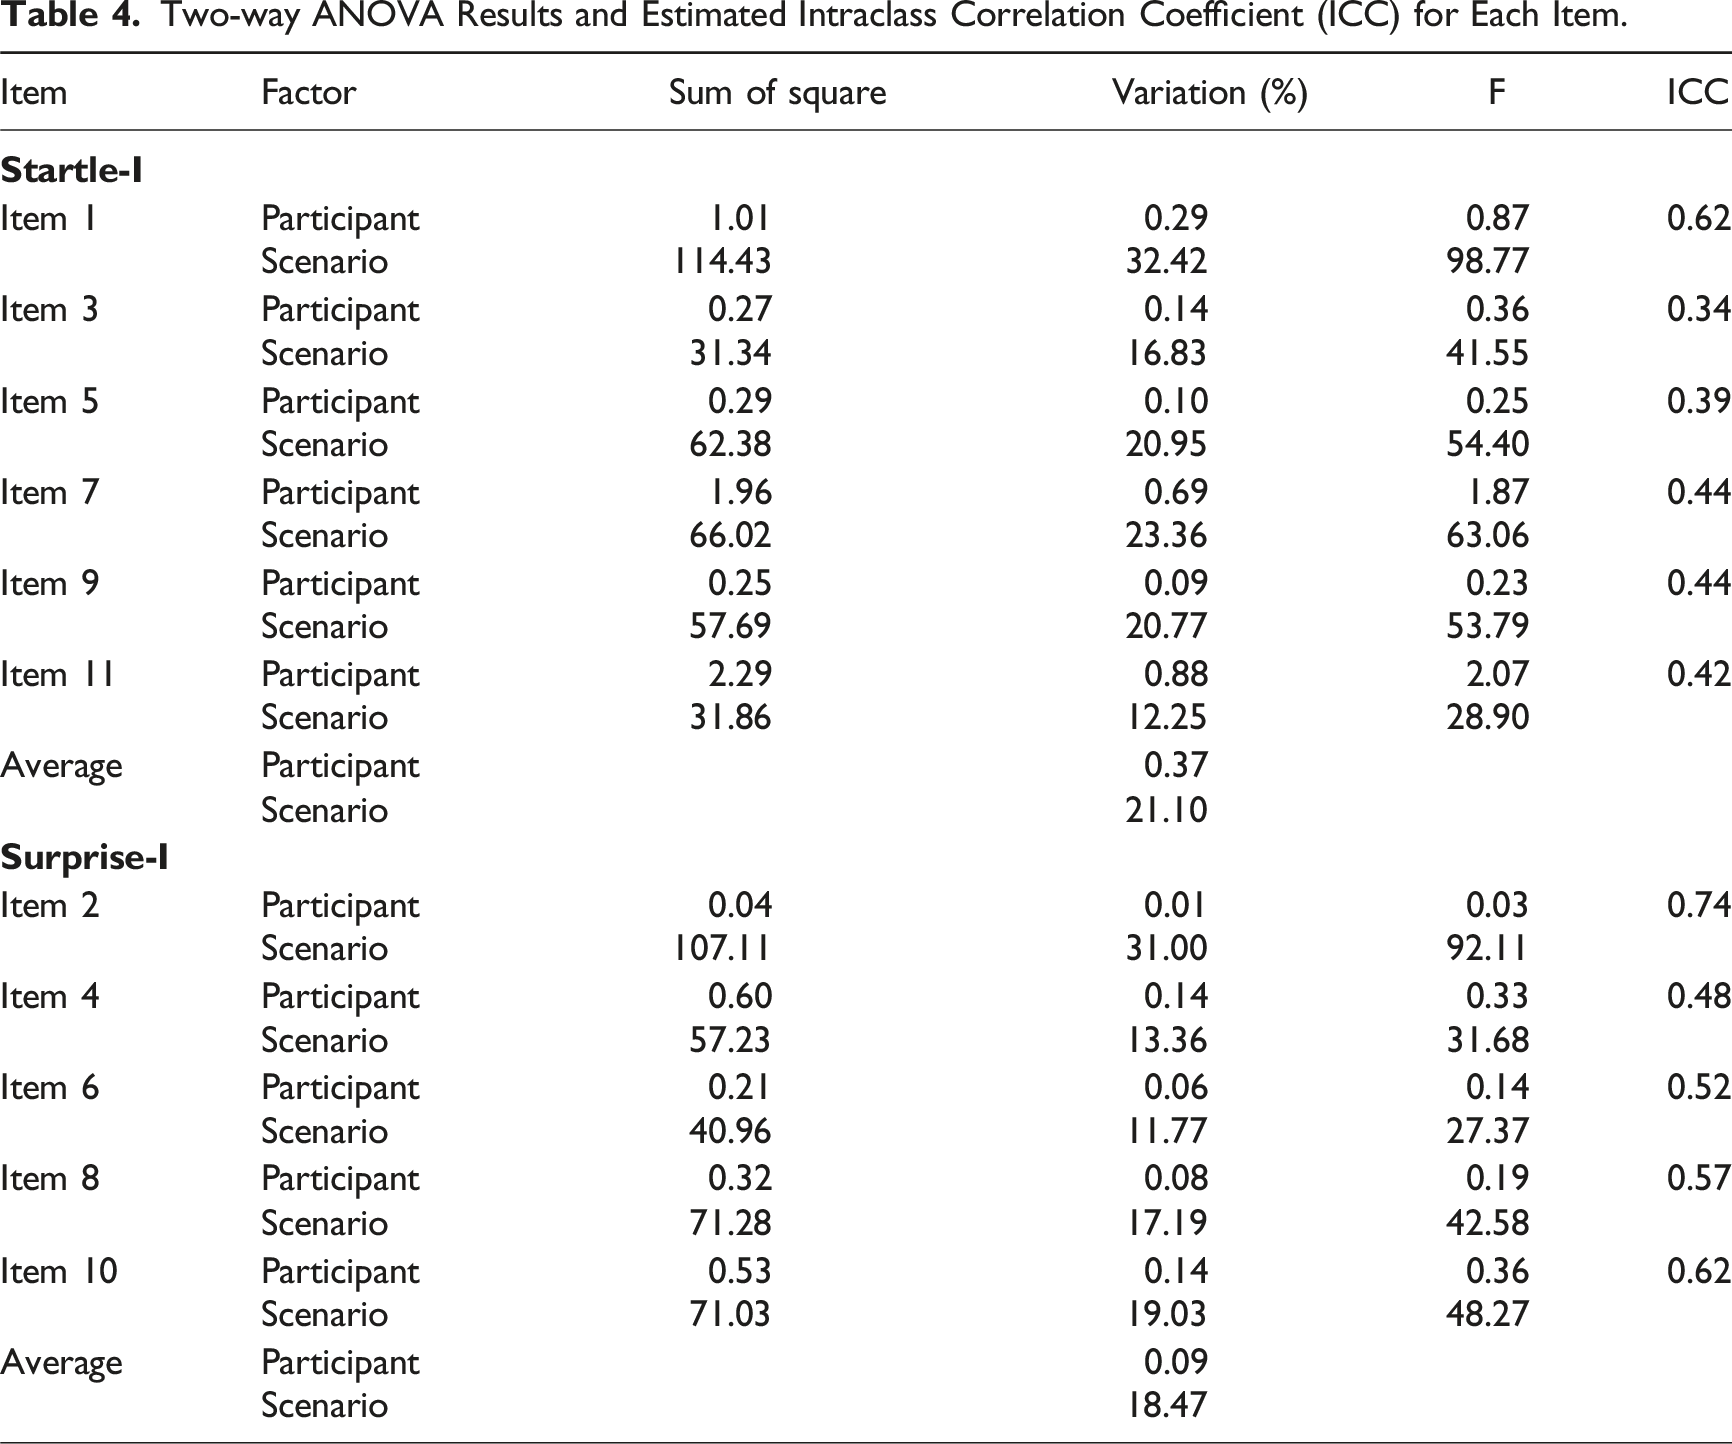
The ICCs ranged from 0.34 to 0.74 (rightmost column in Table 4). Notably, all of the items had ICCs greater than 0.05, indicating considerable variance due to the between-scenario differences. Specifically, for nearly half of the items, more than 50% of the total variance was attributable to between-scenario differences, indicating the need for a MCFA to properly examine the factor structure.
Multilevel Confirmatory Factor Analysis
The model fit tests demonstrated that the two-factor 11-item model, comprising the factors Startle and Surprise, provided an adequate goodness-of-fit to the data across all indices except for the χ2 test, with χ2 = 153.760, p < 0.001, CFI = 0.939, TLI = 0.922, RMSEA = 0.062, SRMRwitℎin = 0.089, SRMR between = 0.082. In contrast, the one-factor, 11-item model showed lower fit indices and failed to meet the criteria for goodness-of-fit on all indices, with χ2 = 530.969, p < 0.001, CFI = 0.602, TLI = 0.503, RMSEA = 0.156, SRMRwitℎ in = 0.210, SRMRbetween = 0.133.
Factor Loadings, Standard Errors and Z Values From the MCFA of the Two-Factor Model.
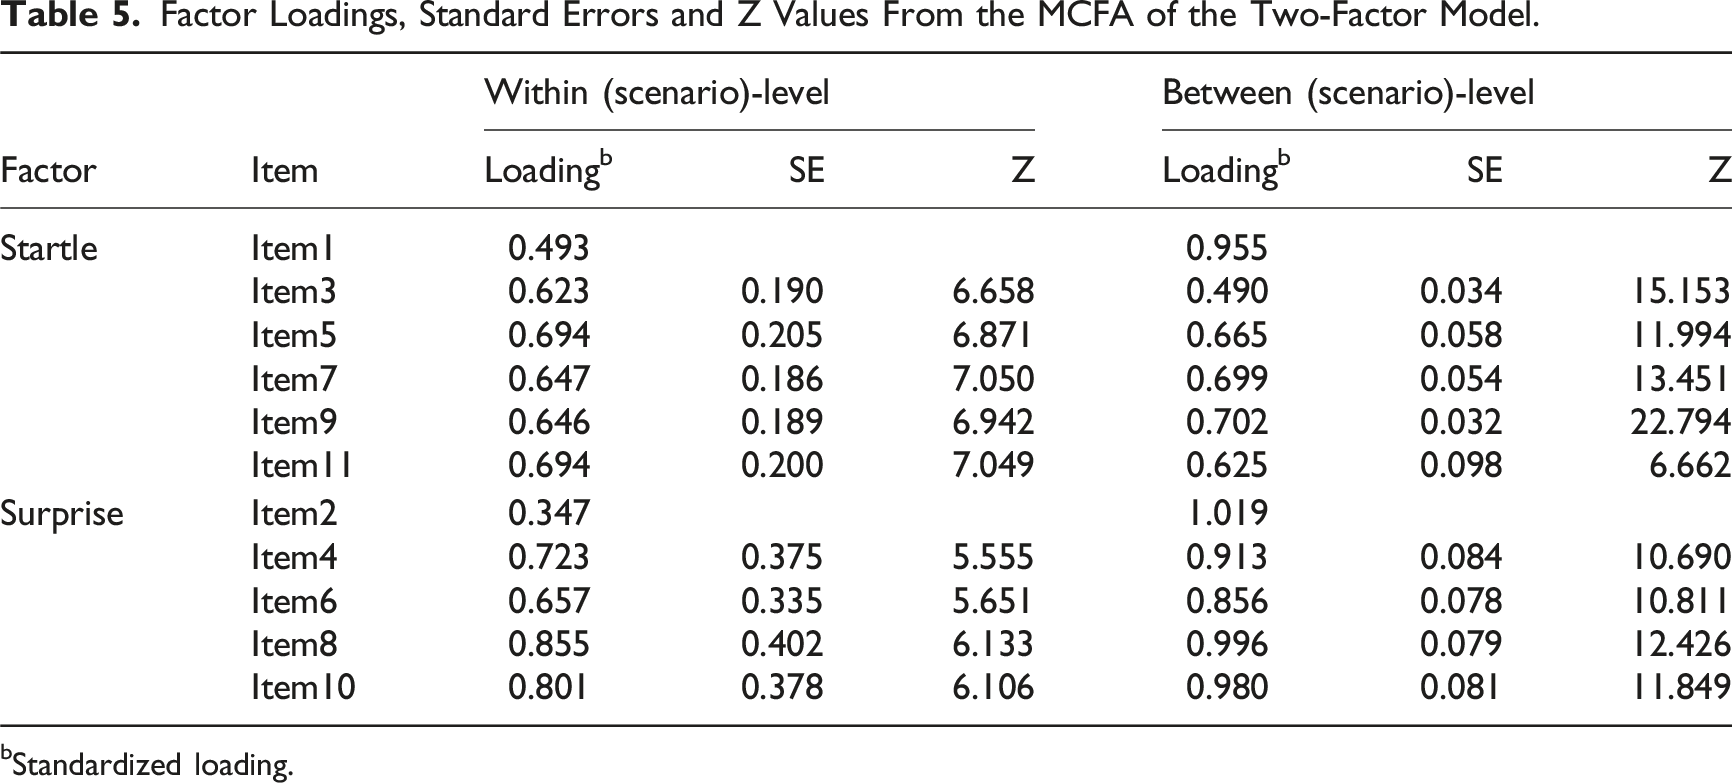
bStandardized loading.
The standardized covariance indicated a non-significant low to moderate positive relationship, Cov. = 0.171, p = 0.067, between the factors Startle and Surprise at the within-scenario level, representing that pilots who tended to report higher levels of startle did not necessarily report higher levels of surprise within the same scenario, and vice versa. A high but marginally significant covariance value between the factors Startle and Surprise at the between-scenario level, Cov. = 0.902, p = 0.063, indicated that scenarios that were rated higher in startle also tended to be rated higher in surprise, and vice versa.
McDonald’s ω for Startle-I and Surprise-I Across Scenarios.
Manipulation Checks
The ratings from the Startle-I, Surprise-I, Startle-VAS, and Surprise-VAS for each scenario are shown in pirate plots (Figure 3). These plots represent the mean values (square markers with labels), interquartile range in whiskers, and estimated ratings distribution. across different scenarios. The two left beans in each plot represent ratings from the Startle-I and Surprise-I, referring to the left-hand axis (ranging from 1 to 5). The two right beans represent ratings from the Startle-VAS and Surprise-VAS, corresponding to the right-hand axis (ranging from 0 to 10). Ratings from Startle-I, Startle-I, Startle-VAS and Surprise-VAS across scenarios (square markers indicate means, whiskers indicate interquartile range).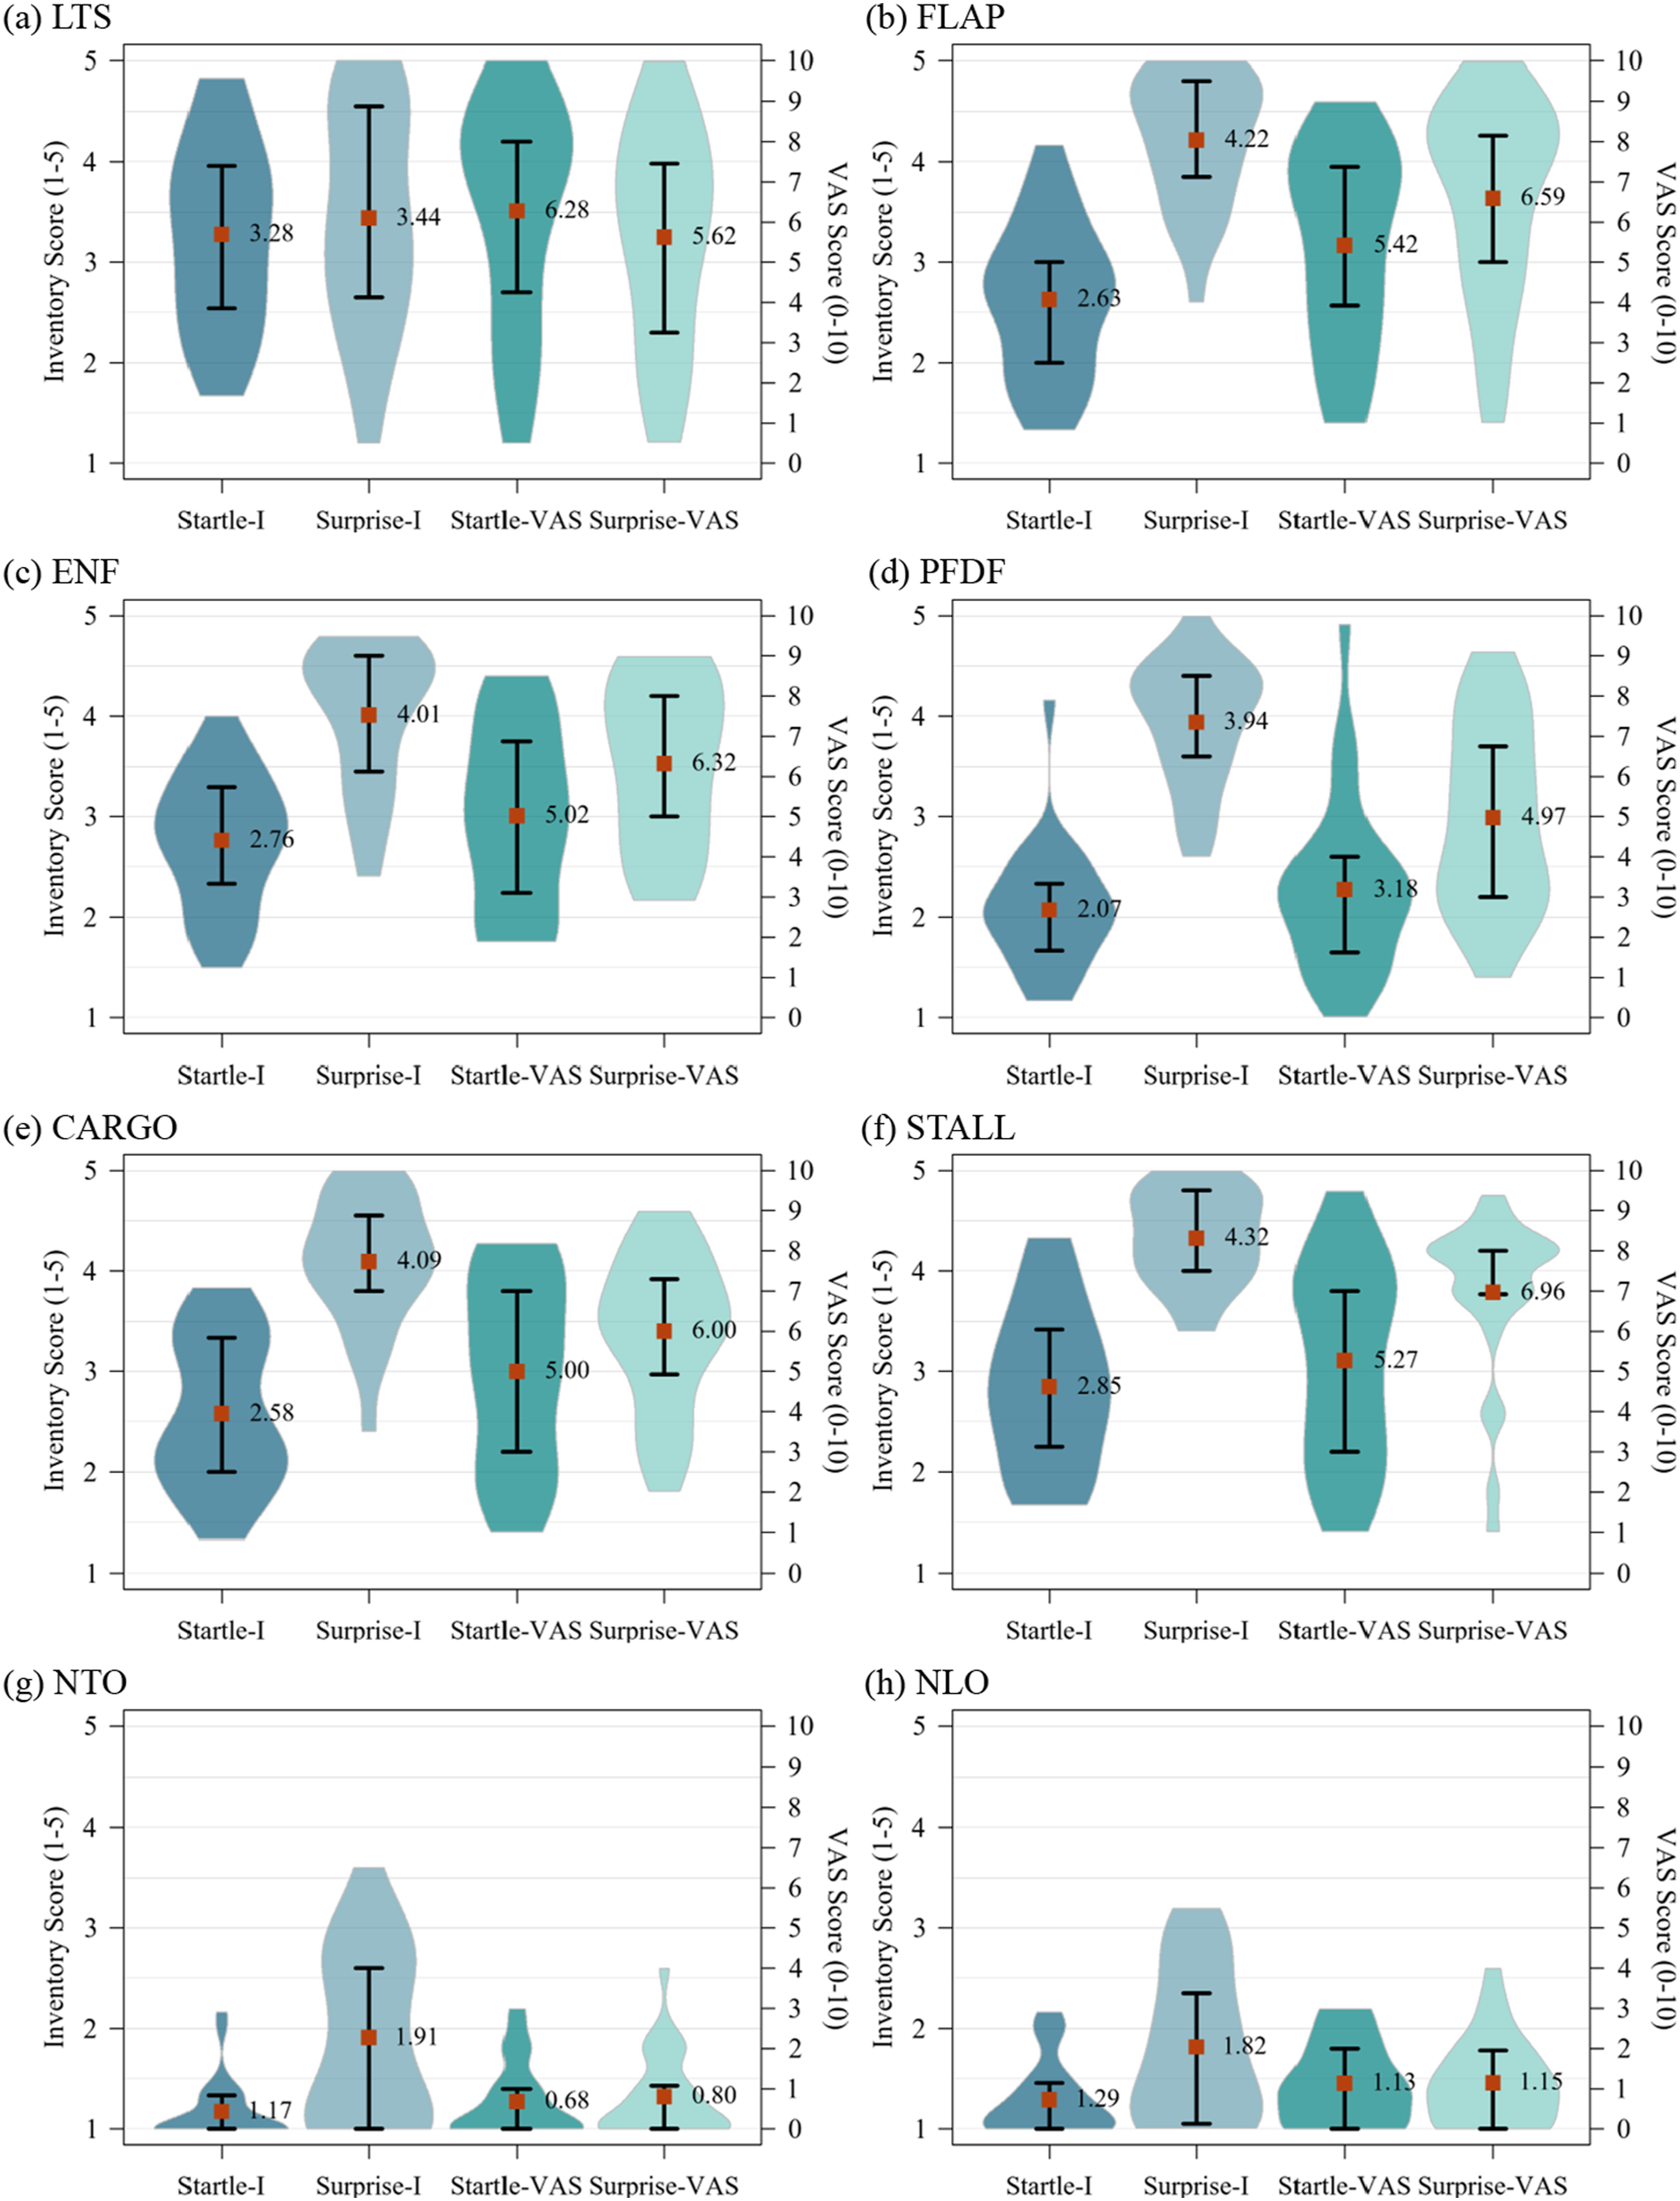
The plots illustrate that, across all test scenarios, the Startle-I scores were consistently lower than the Startle-VAS scores, whereas the Surprise-I scores were consistently higher than the Surprise-VAS scores. This may suggest that the multi-item inventories were more effective than the VASs in differentiating between subjective startle and surprise. In addition, the selected scenarios elicited a wide range of startle and surprise levels within- and between-scenarios, demonstrating the overall effectiveness of the scenarios in provoking the intended responses. This high variation in responses also facilitated the application of MCFA.
Figure 4 presents the averaged levels of startle and surprise across scenarios. The dashed circles indicate groups of scenarios that do not have significantly different levels of startle and surprise as analysed using the linear mixed-effects models (see Table 7). Individual data points represent the mean values of the Startle-I and Surprise-I ratings for the scenario with markers (squares, triangles, diamonds and circles) indicating intended responses. Additionally, shaded rectangles around the data points indicate the response variability across individuals, where the width and height of each rectangle correspond to twice the standard deviation of the Startle-I and the Surprise-I in that scenario. Mean values (markers) and SDs (squares) of Startle-I and Surprise-I for each scenario. Dashed circles denote scenarios groups with non-significant differences in mean startle and surprise levels. Pairwise Comparison of the Estimated Marginal Means Between-Scenarios.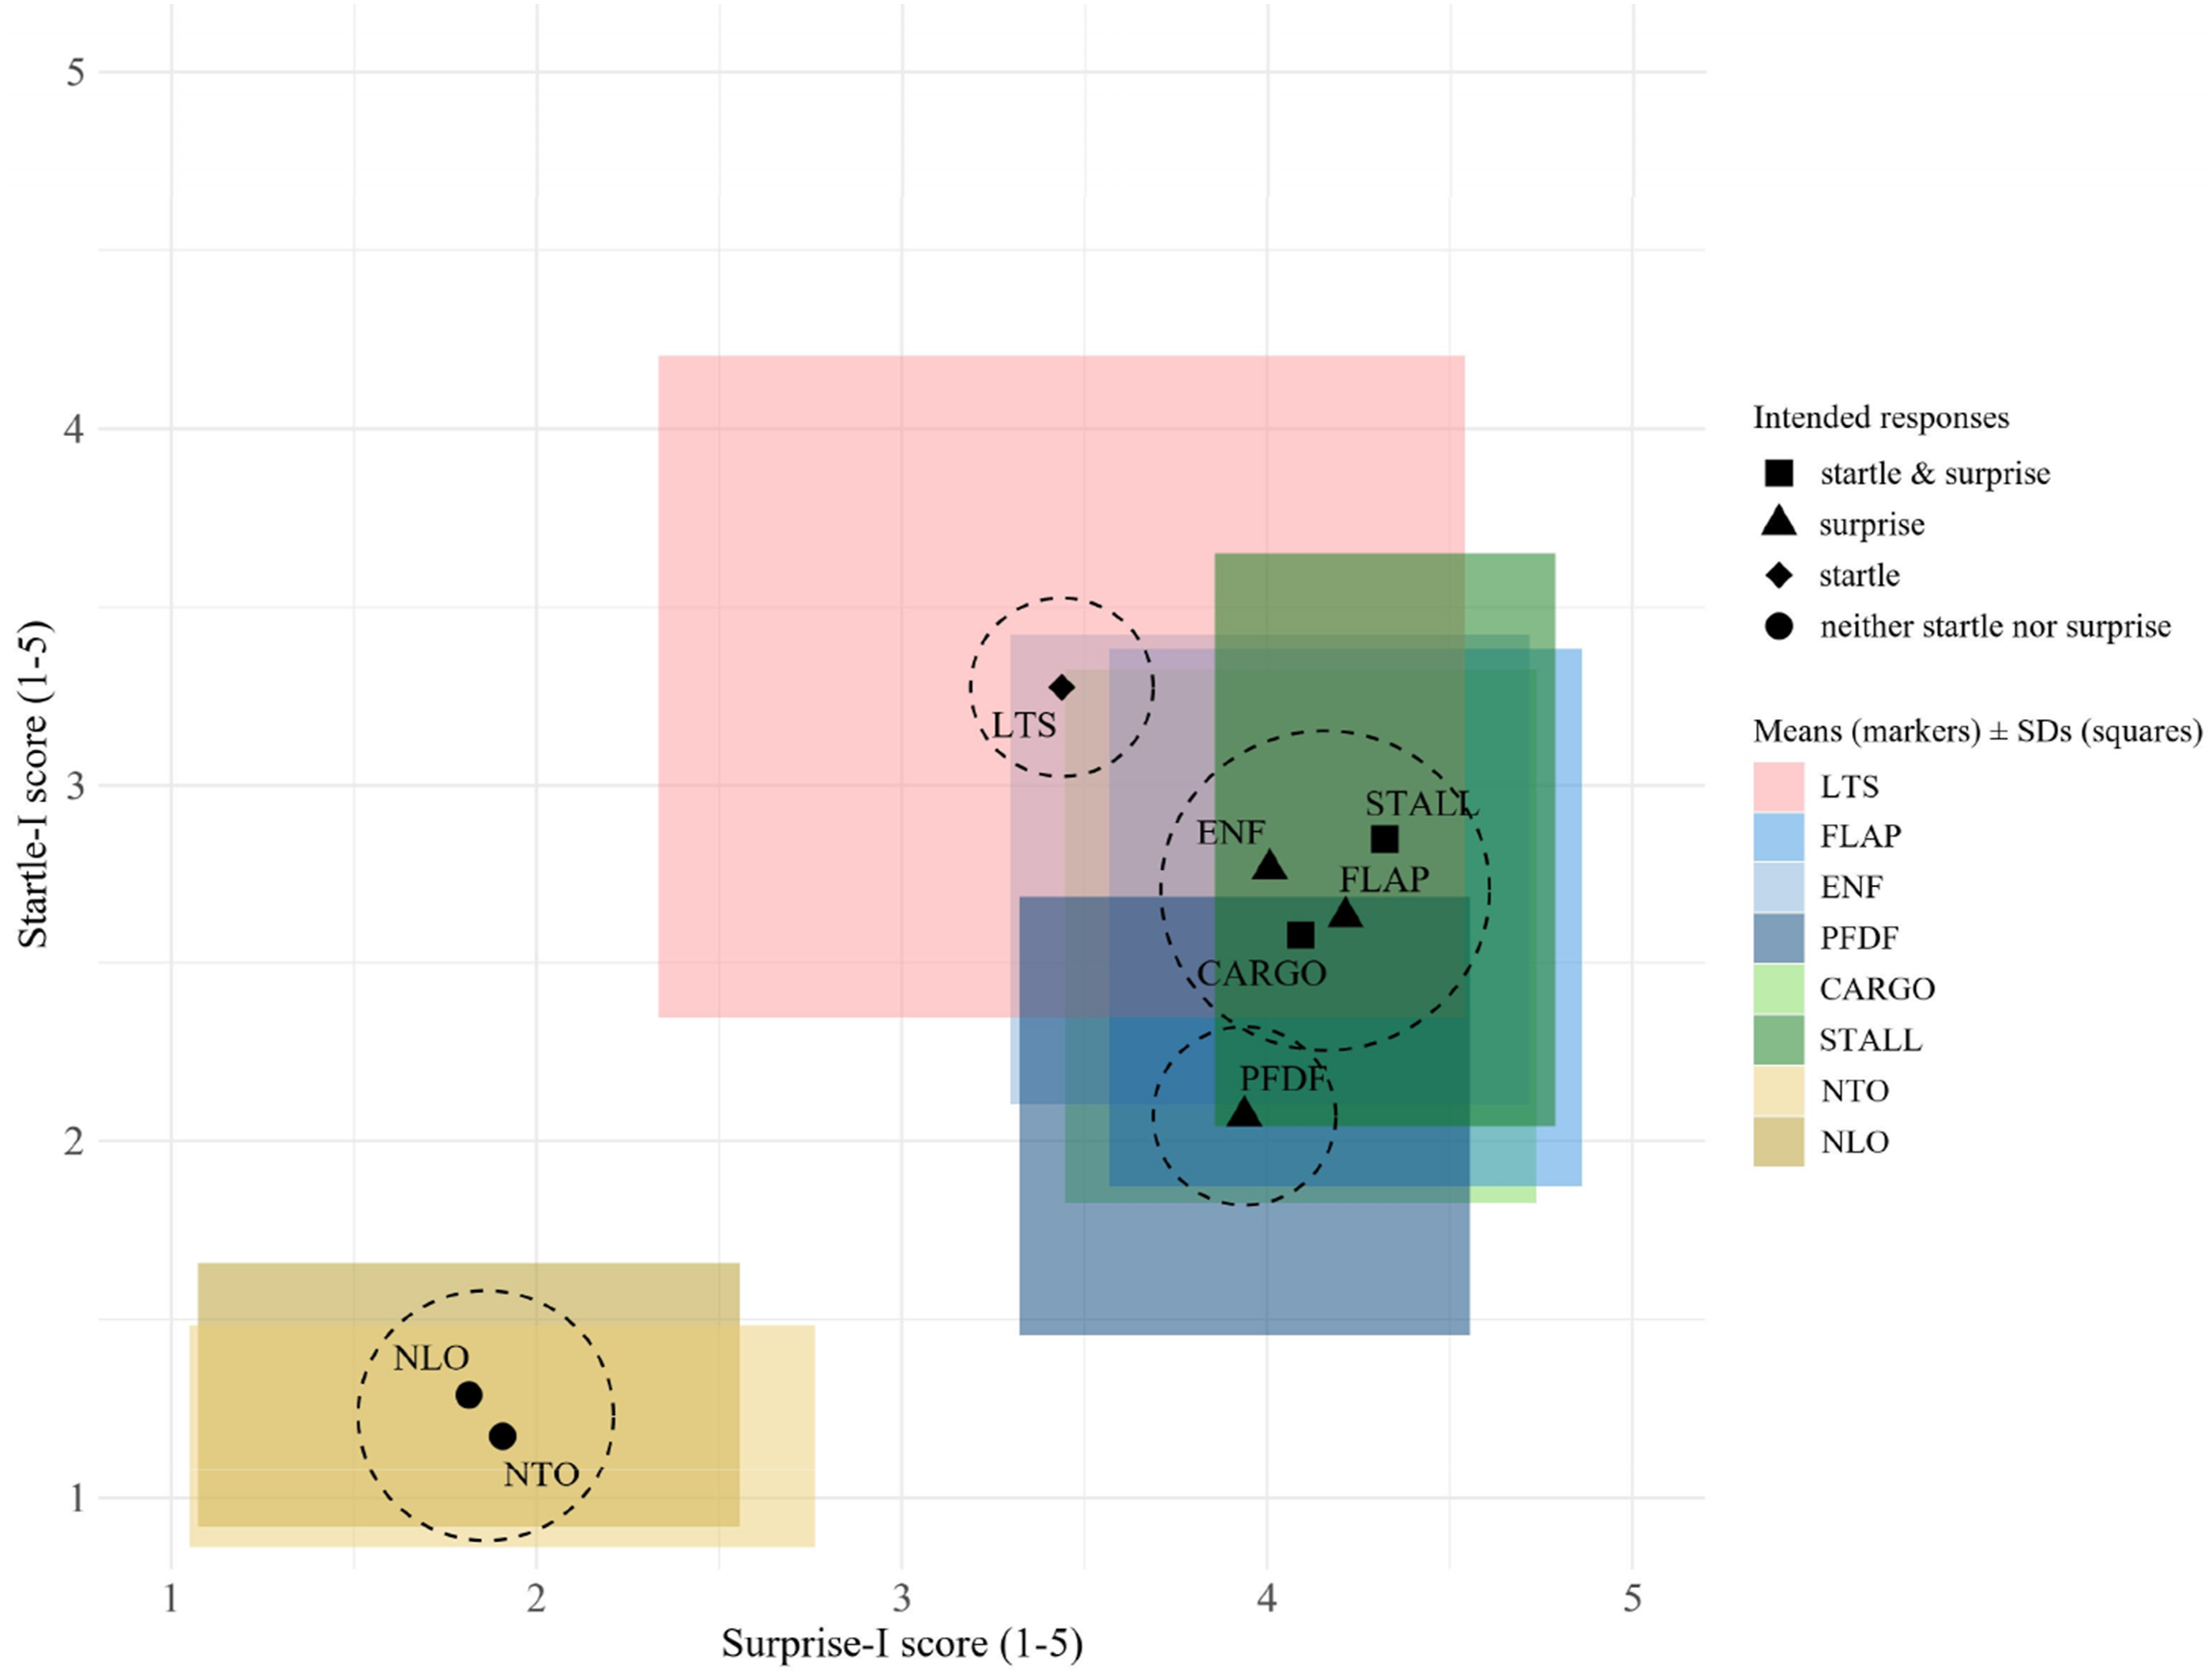
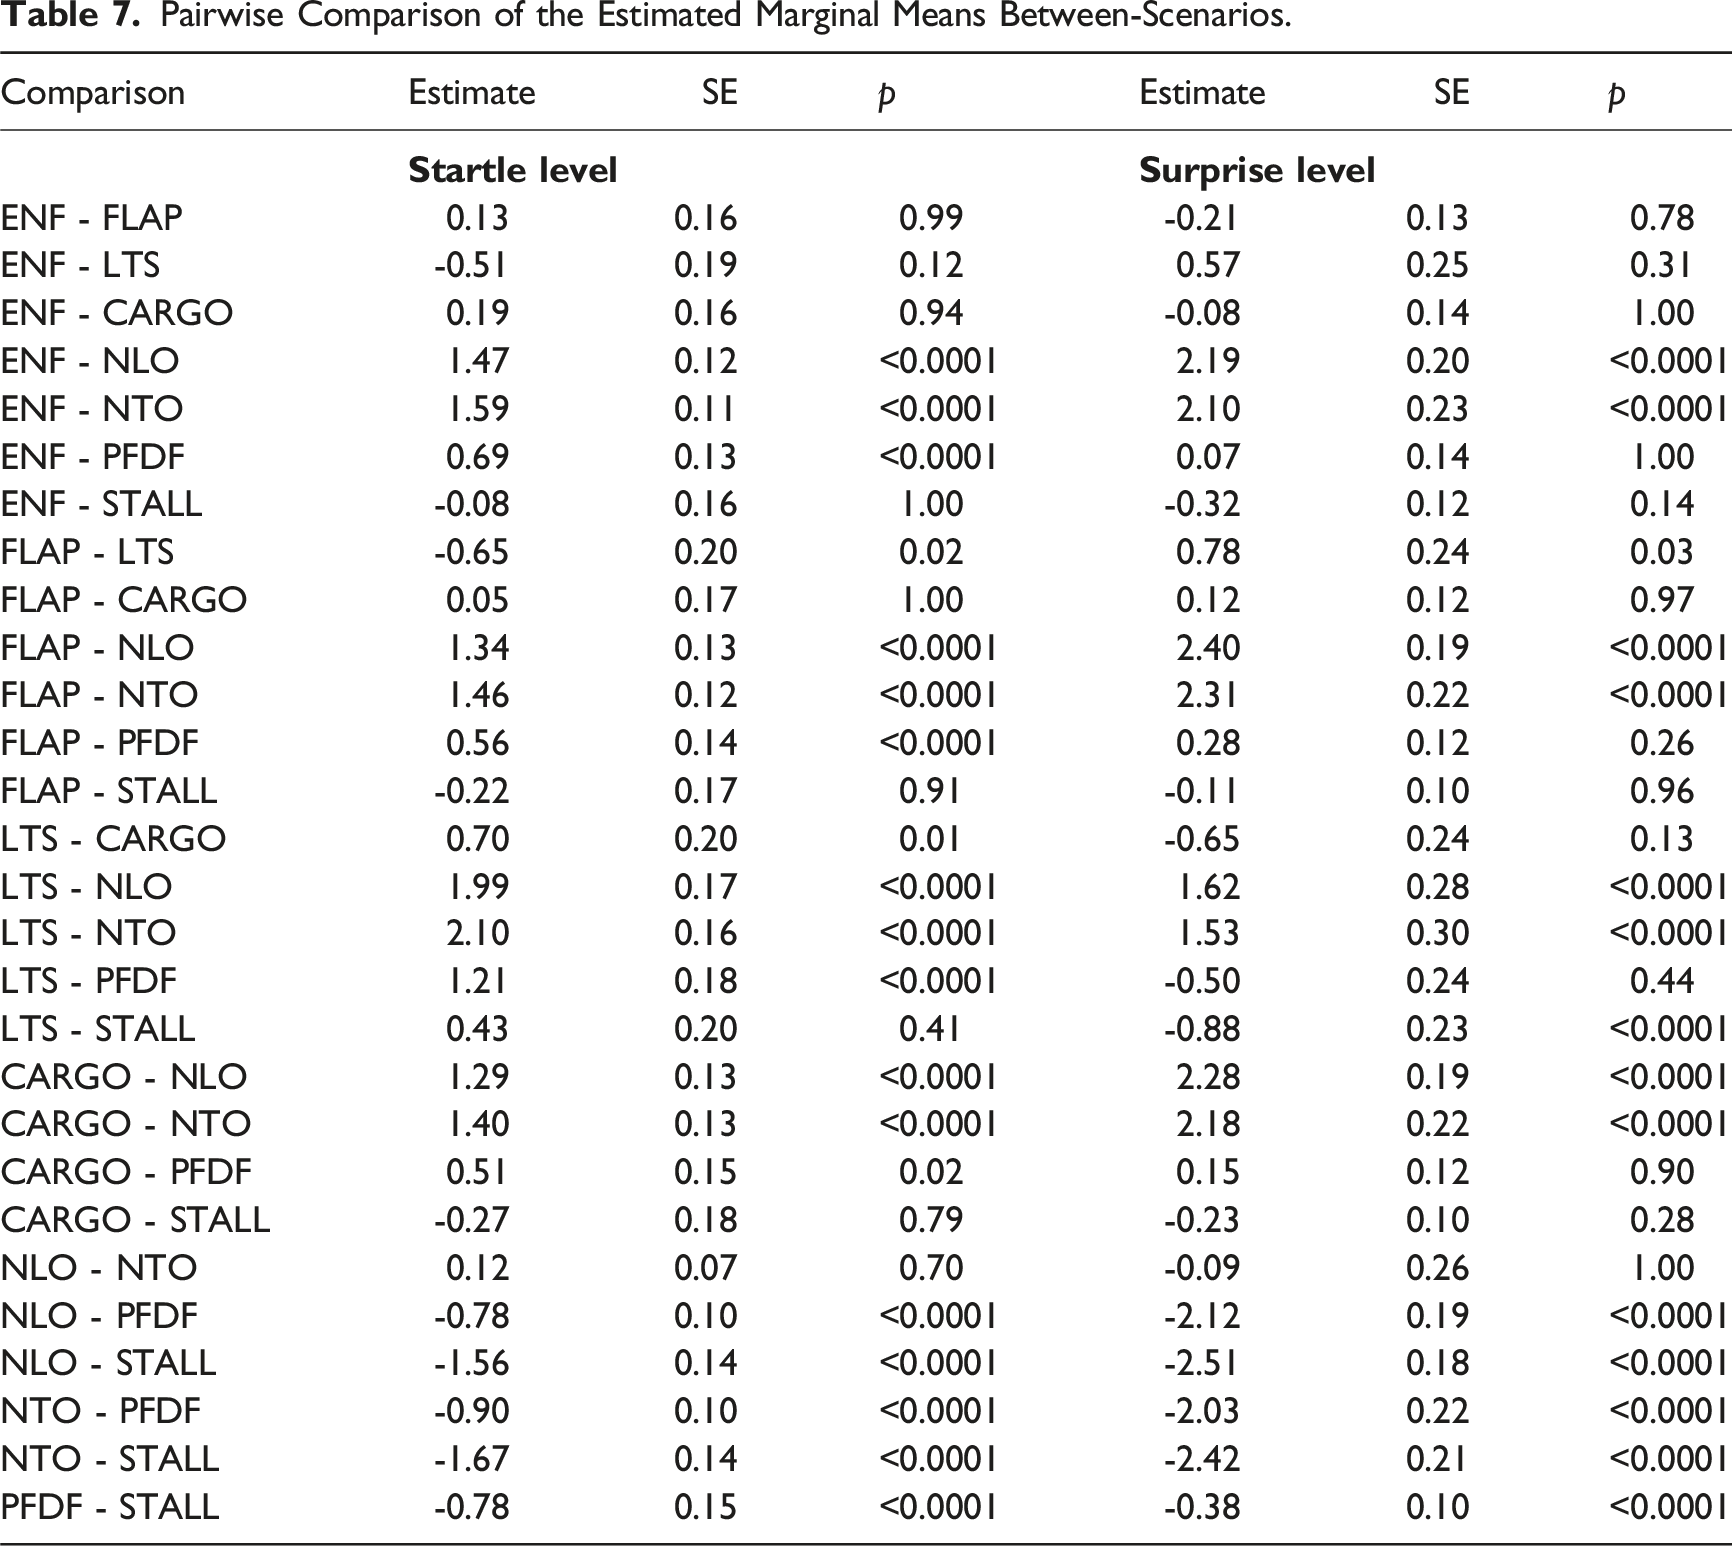
Most scenarios elicited the intended responses on self-report startle and surprise. However, ENF and LTS were found to have no significant difference between both their startle ratings, ENF startle = 2.76, LTS startle = 3.28, and surprise ratings, ENF surprise = 4.01, LTS surprise = 3.44. No significant differences were found on startle ratings between ENF and CARGO, ENF startle = 2.76, CARGO startle = 2.58, ENF and STALL, ENF startle = 2.76, STALL startle = 2.85, FLAP and CARGO, FLAP startle = 2.63, CARGO startle = 2.58, FLAP and STALL, FLAP startle = 2.76, STALL startle = 2.85. No significant differences were found on surprise ratings between LTS and CARGO, LTS surprise = 3.44, CARGO surprise = 4.09, LTS and PFDF, LTS surprise = 3.44, PFDF surprise = 3.94.
Discussion
The construct validity of the Startle and Surprise Inventories was confirmed in a highly ecologically valid flightdeck setting, with 208 observations comprising 26 professional pilots. To investigate the inventories’ ability on measuring self-report startle and surprise, eight simulated in-flight scenarios with varied startling and surprising stimuli were tested. MCFA was applied across two levels (i.e., within- and between-scenario) given the repeated-measures experimental design. The analysis was guided by the factor structure identified in previous research where a ML-EFA was performed (Chen et al., 2025a). Results from the two-way ANOVA indicated that the averaged amount of variance in both inventories’ items caused by differences between-scenarios was generally larger than the variance caused by differences between participants. This outcome supports the intention of our experiment, to create significant differences between scenarios rather than between participants. This led to the clustering of data for the MCFA on Scenario instead of on Participant. The ICCs of all items emphasized the need for applying a MCFA instead of a CFA to properly consider the between-scenario variance.
The goodness-of-fit for the total set of 11 items was compared between a one-factor model and a two-factor model (factors Startle and Surprise). The comparison revealed that the two-factor model provided a superior and acceptable fit to the data, whereas the one-factor model did not. Both models yielded significant χ2 values, which are typically indicative of poor model-data fit. However, the relatively small sample size likely inflates the χ2 values, producing significant results even when the model-data discrepancies are minor (Byrne, 2006). In addition to the χ2 test, other fit indices, CFI, TLI, RMSEA, SRMR within and SRMR between all supported the adequacy of the two-factor model. Furthermore, the MCFA identified significant factor loadings at both within- and between-scenario levels, underlining the robustness of the two-factor structure.
The differentiation between the factors Startle and Surprise indicated by the two-factor model fit provides evidence for the construct validity of the Startle-I and Surprise-I. This finding supports that the Startle-I and Surprise-I can effectively capture the startle and surprise responses of pilots in a highly ecologically valid setting. Additionally, the MCFA offers compelling evidence for the distinctiveness of the constructs of startle and surprise within the flightdeck operational context. The results support the hypothesis that the responses of startle and surprise are fundamentally and psychometrically distinct constructs with different causes and consequences (Landman et al., 2017a; Rivera et al., 2014), even though both could impact pilot (cognitive) performance to varying degrees.
Regarding the reliability of the Startle-I and Surprise-I, the McDonald’s ω across scenarios indicated acceptable to excellent internal consistency. The variability across scenarios may be attributable to differences in scenario characteristics and individual differences in how to interpret and respond to the items. Specifically, scenarios that elicited more uniform and intense responses may have led to stronger inter-item correlations, thereby increasing McDonald’s ω.
From the comparison between ratings from inventories and VASs on measuring startle and surprise, the Startle-I and Surprise-I demonstrated a superior ability to distinguish between different levels of startle and surprise when compared to the Startle-VAS and Surprise-VAS (Figure 3). This was unexpected, as the single-item VAS scores were shown to be highly correlated with inventory scores in a previous research (Chen et al., 2025a), in which startling and surprising video stimuli were unrelated to the aviation domain. Thus, although the visual analogue scales are efficient in capturing self-report startle and surprise (can be used quickly and immediately after target stimuli), the multi-item inventories were found to be more effective in the ecologically valid flightdeck context.
There are several limitations should be acknowledged. First, the findings were based on the scenarios performed in a motion-based flight simulator. Although the setting allows for high controllability and replicability, these may not simulate the level of stress, surprise, and high demand of real-world in-flight emergencies.
Second, we employed a within-subjects experimental design, in which 26 participants were exposed to eight test scenarios. While the sample size was sufficient to yield meaningful insights into the model’s goodness-of-fit, it limits the generalizability of the findings to broader populations. The limited number of participants may reduce the statistical power necessary for detecting subtle nuances in the factor structures of Startle-I and Surprise-I. Future research should consider expanding the sample size and possibly incorporating a more diverse demographic profile (e.g. age and flight experience) to enhance the generalizability and robustness of the findings.
Third, the results indicated that the designed stimuli effectively elicited a wide range of variability in both startle and surprise responses. However, it remains challenging to elicit startle and surprise independently, as these two responses often co-occur in high-stakes operational settings. This overlap may be evident in scenarios primarily designed to induce surprise, extra stress induced by workload to control the flight path may have heightened participants’ startle responses (Martin et al., 2015). For example, in the FLAP and ENF scenarios, which were designed to evoke high levels of surprise, participants also reported that their startle levels was around the midpoint of the inventories/VASs.
Fourth, all test scenarios were conducted in a single-pilot setting with a simplified twin-propeller aircraft model that most pilots were not familiar with. Apart from the unfamiliarity, extra high workload was introduced by requiring pilots to fly manually, which could also affect their experienced startle or surprise, making them differ from the hypothesis.
Fifth, this study provides empirical support for the construct validity of the Startle-I and Surprise-I in an ecologically valid context, extending previous findings from controlled laboratory setting (Chen et al., 2025a). The inventories showed acceptable to excellent internal consistency across various conditions. To examine their psychometric properties more comprehensively, future research could explore the criterion-related validity of the two measures by comparing subjective ratings with objective indicators, such as physiological responses (e.g. reflex electromyogram (EMG) and pupillometry; Blumenthal et al., 2005; Leuchs et al., 2019; Ryffel et al., 2019) or behavioural indicators (e.g. reaction time and micro-expressions).
Sixth, the current study is limited in focus on the aviation domain, whereas the inventories have potential for broader applicability in other high-stakes environment involving human operators (Vlaskamp et al., 2025). Future research should aim to replicate these findings in different operational settings, as well as in different domains to enhance the generalizability.
Conclusion
This study provides strong and consistent evidence supporting the factor structure of the Startle and Surprise inventories, aligning with prior research. Using a sample of professional pilots (N = 26) and simulated in-flight scenarios, the findings support previous results obtained using video-based stimuli, further demonstrating the validity and reliability of Startle and Surprise Inventories across diverse contexts. The findings also highlight the inventories’ applicability for assessing startle and surprise responses at both individual and scenario levels. Moreover, the Startle and Surprise Inventories enable further research into the antecedents and consequences of these responses, with potential implications for evidence-based safety protocols and training interventions in the flightdeck contexts.
Footnotes
Declaration of Conflicting Interests
The authors declared no potential conflicts of interest with respect to the research, authorship, and/or publication of this article.
Funding
The authors received no financial support for the research, authorship, and/or publication of this article.