
Abstract
Advances in opto-electronics enable replacement of conventional submarine periscopes which display only a portion of the horizon (low field of view), with digital periscopes, which can potentially display a 360° panoramic digital representation of the horizon (high field of view). Digital periscopes can also provide digitized analysis tools for vessel (contact) range and course estimates. The current research compared the impact of a digital representation of a conventional periscope view with an alternative digital periscope prototype that displayed a larger (360°) field of view and provided digital analysis tools, on performance, perceived workload and system usability. Two experiments were conducted in a simulated submarine control room environment. In Experiment 1, the high field of view periscope yielded faster contact detection times, with no cost to the perceived workload or usability associated with the task of contact detection. In Experiment 2, the digitized analysis tools supported more accurate contact course and range estimates and lowered perceived workload, with no impact on perceived usability. These outcomes indicate that digitally augmenting the periscope is a technological innovation that can potentially facilitate submariner tasks, and highlight the benefits of applying knowledge from perceptual and cognitive science to the design of future digital periscope prototypes.
Introduction
Rapid advances in technology have enabled replacement of conventional submarine periscopes with digital periscopes that allow for 360° imagery and integration with other sensor and tactical systems. With this new technology, the periscope watchkeeper, previously tethered to the conventional periscope via eyepieces and handles (Figure 1(a)) providing a partial view of the horizon (Figure 1(b)), could potentially observe the external environment in a variety of alterative ways, including on a computer monitor. The technical and engineering considerations involved in digitally representing sensor/periscope imagery on monitors have received considerable attention, including technologies required for presenting 360° imagery such as rotating components, software algorithms for multiple sensors, and image stitching (Duryea et al., 2008), as well as novel augmented reality architecture (Breitinger et al., 2021). However, to our knowledge, little consideration has been given to the potential impact of alternative digital periscope prototypes
1
(i.e. display interfaces) on human performance. A conventional periscope human-machine interface. (a) The operator can view the surrounding area through the periscope eyepiece using system prisms when the periscope mast is raised. (b) A conventional periscope view. (Sourced from Bonsor, 2023; Royal Navy News 2017).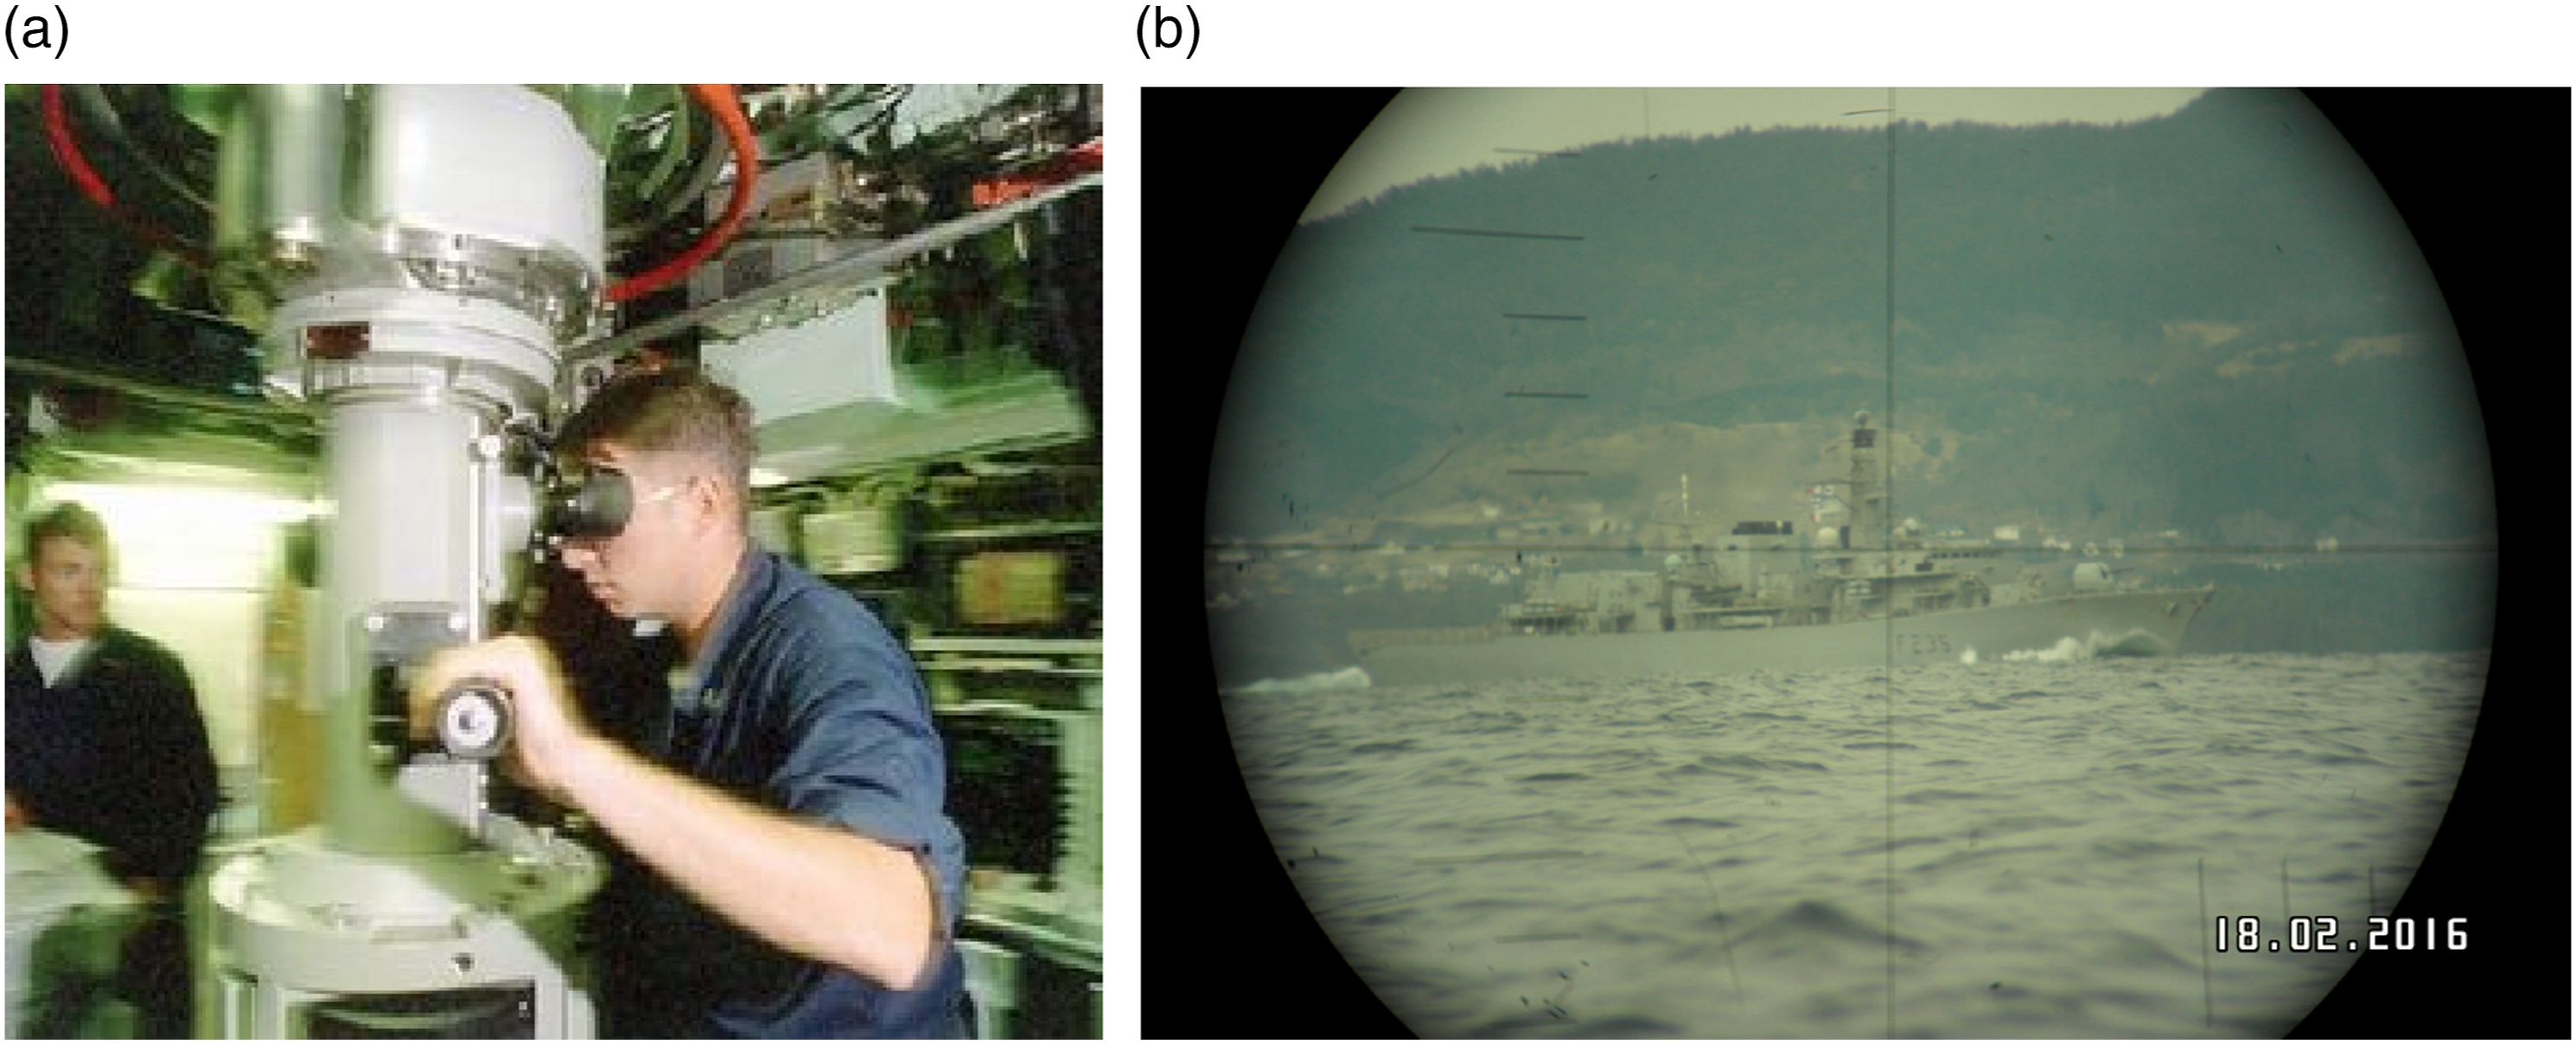
There is a tendency for navies around the world to apply new technology to legacy (conventional) work designs without fully considering how to obtain maximal utility from technological upgrades by optimizing the relationship between human users and technology (for discussion see Roberts et al., 2021; Stanton & Roberts, 2020; Stanton et al., 2022). When designing alternative digital periscope prototypes, it is therefore important to consider the perceptual and cognitive capabilities and limitations of humans, as indicated by theory and associated empirical findings in the basic research fields of human perception and cognition, an approach that reflects ‘use-inspired basic research’ (Pasteur’s Quadrant; Stokes, 1997). As described below, we used theory from the perception and cognitive science literature to parse the applied issues under consideration into empirically addressable phenomena, and designed a representative task environment based on a theoretical analysis of the applied environment, allowing us to emulate likely conditions-of-use (see Michailovs et al., 2023, 2024, for prior submarine-related research conducted using this general approach).
The operator of a conventional periscope can usually see only a portion of the horizon, typically about 32° on low magnification and about 8° at high magnification (Walker, 2000). A full search of the environment requires physical movement, rotating the restricted periscope-viewing window around in order to scan the 360° environment. From the perspective of safeguarding the submarine (Ownship), the need to physically slew the periscope may delay the detection, classification, and localization of contacts (i.e. vessels). From the perspective of human operators, the requirement to move the periscope also introduces the need to store information in memory, solve motion artefacts, and integrate visual information over time (Burr & Cicchini, 2014). These perceptual and cognitive requirements could exceed available operator resources, potentially impairing performance.
As navies shift to digital technologies, however, the options for presenting visual information become flexible. A digital periscope apparatus can represent a wider field of view (up to the full 360°), thus potentially accelerating the detection of contacts, and reducing perceptual and cognitive requirements arising from the narrow field of view presented by a conventional periscope. Moreover, a long history of psychology research assessing visual search behaviour demonstrates that humans are highly efficient at detecting stimuli that possess unique attributes that differ from their environment, such as colour or shape (Treisman & Gelade, 1980). Such salient stimuli tend to guide attention (Egeth, 1977) efficiently to their location, independent of observer attentional set (Posner & Cohen, 1984; Wolfe, 2003), thus capitalizing on what has been argued to be the default strategy for directing attention to the environment (Eckstein, 2011).
On the other hand, a larger field of view display could create cognitive and perceptual demands whose impacts on performance are currently not understood. The requirement for operators to scan more visual information simultaneously raises several potential problems. First, practical limits on monitor size imposed by physical space constraints in the submarine mean that a contact presented on a 360° digital periscope display will be physically smaller than the same contact presented on a display showing a narrow rotatable view. Thus, contact image details may be harder to discern, potentially impairing contact detection speed/accuracy. Second, a larger field of view will contain more information, potentially introducing visual clutter (Moacdieh & Sarter, 2015), interference (Ramachandran & Cobb, 1995; Whitney & Levi, 2011) and response competition (Eriksen & Eriksen, 1974; Reddy & VanRullen, 2007) that could slow contact detection, and/or induce search fatigue.
In summary, whereas digital periscope technology brings with it the opportunity for larger field of views, the visual properties of these displays could negate their potential benefits of increased information availability and reduced operator load. This uncertainty highlights the need for systematic research to evaluate the impact of digital periscope prototypes on operator performance. To this end, Experiment 1 compared human contact detection performance when using a digital representation of a conventional periscope to an alternative digital periscope prototype that displayed a larger field of view in a representative safety-search style simulated submarine task. To foreshadow Experiment 2, modern technology can also provide digital tools to aid operators in performing tasks on detected contacts such as range estimation (the distance between Ownship and the contact) and course estimation (inferred from contact visual aspect or ‘angle-on-the-bow’). With this in mind, Experiment 2 examined whether range and course estimation were better supported by digital tools made available in a novel periscope prototype compared to manual aids used with a conventional periscope prototype.
Experiment 1
Two simulated digital periscope prototypes were developed by the Australian Defence Science and Technology Group. The prototypes emerged from research conducted with the Royal Australian Navy, using cognitive work analyses and human-centred design workshops (Irons et al., 2019; Schmitt et al., 2013).
The first digital periscope prototype (Figure 2), called OPTIX, displayed a single-bearing view of the environment consisting of an arc of the horizon. The visual view was rotated horizontally across the horizon by a fixed seated participant via keyboard (arrow keys) or mouse (click and drag horizontally), simulating a digitized version of a conventional periscope. The second digital periscope prototype (Figure 3), called OPTIMUS (OPTronics IMplementation & Usability System), displayed a full 360° environment across five panels (i.e. rows), presented on a single monitor identical in size to the display used for OPTIX. OPTIX digital periscope prototype. A warship at a range of 9 kiloyards at (a) low magnification (36° horizon arc), and at (b) ×12 high magnification (3° horizon arc). In the hybrid magnification condition, the field of view could be changed between these two magnifications by using the plus and minus keys on the keyboard, or the left mouse button to select and drag the slider (the vertical blue slider located on the lower left hand-side of the monitor). OPTIMUS digital periscope prototype that displayed the full 360° horizon in five panels (i.e. rows). A warship at a range of 9kiloyards (a) without the use of the magnified window and (b) with the use of the ×12 magnified window.In the hybrid magnification condition, the magnified window could be toggled on and off by holding down or releasing the left mouse button.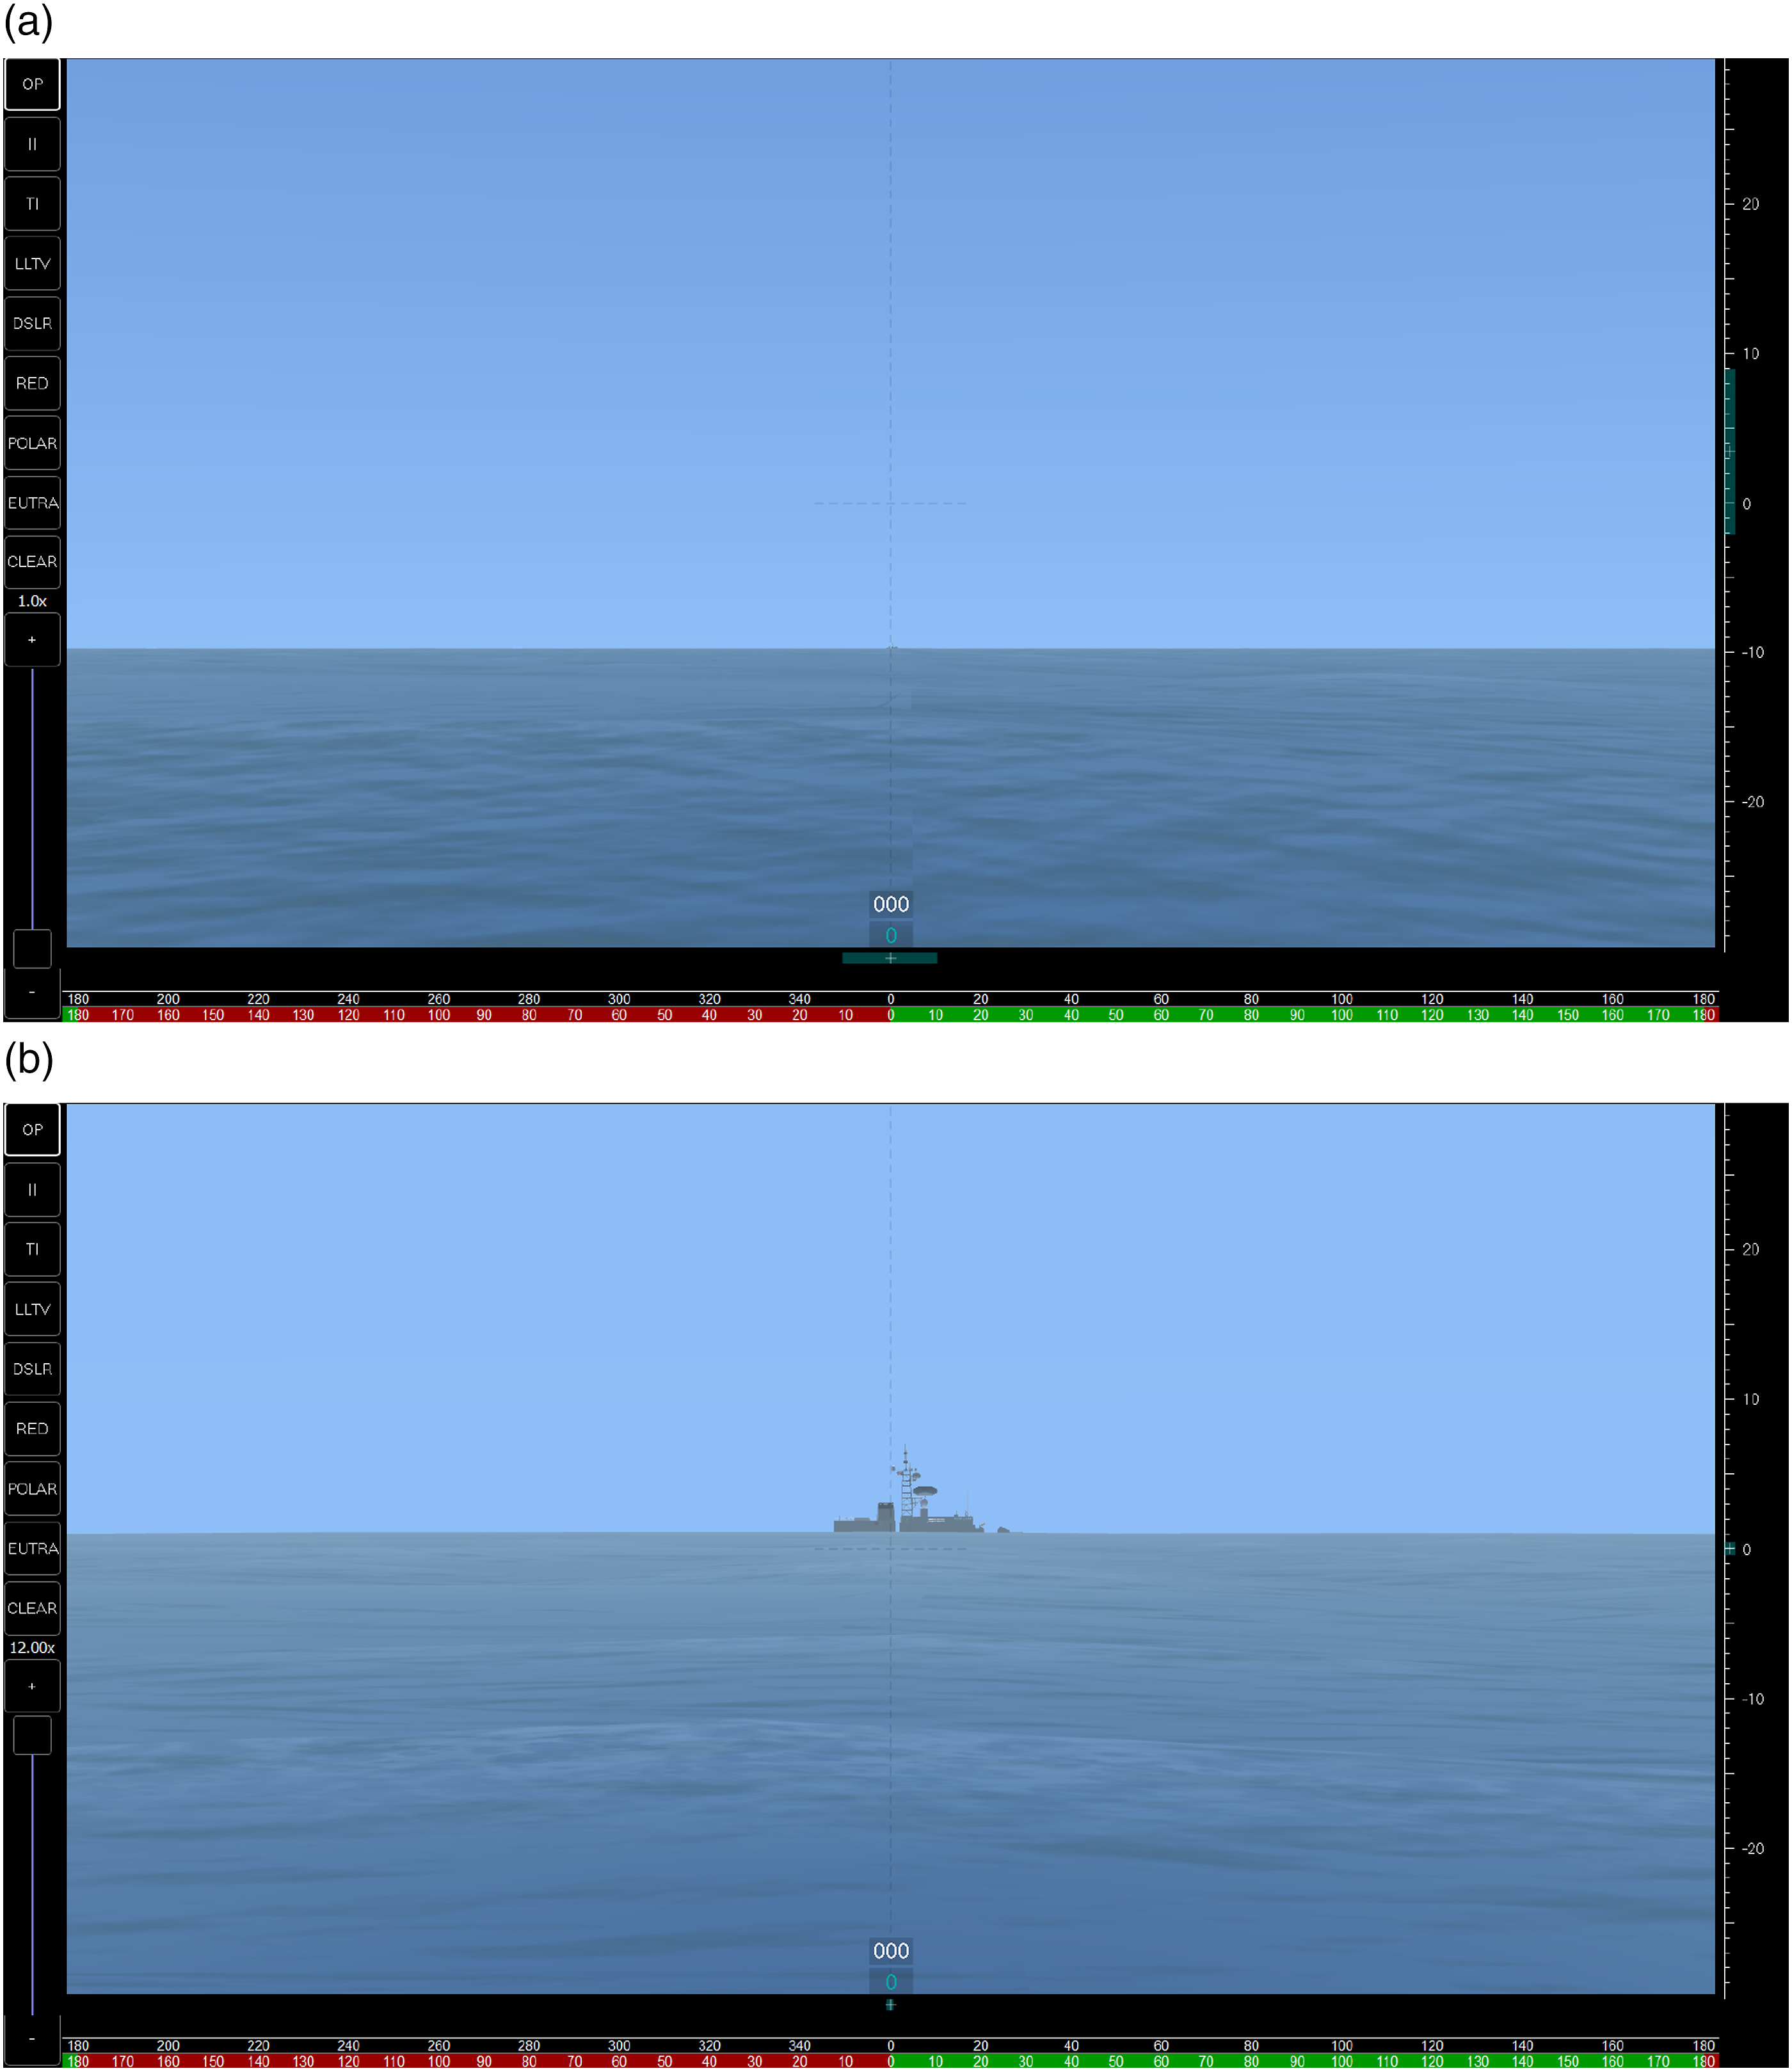
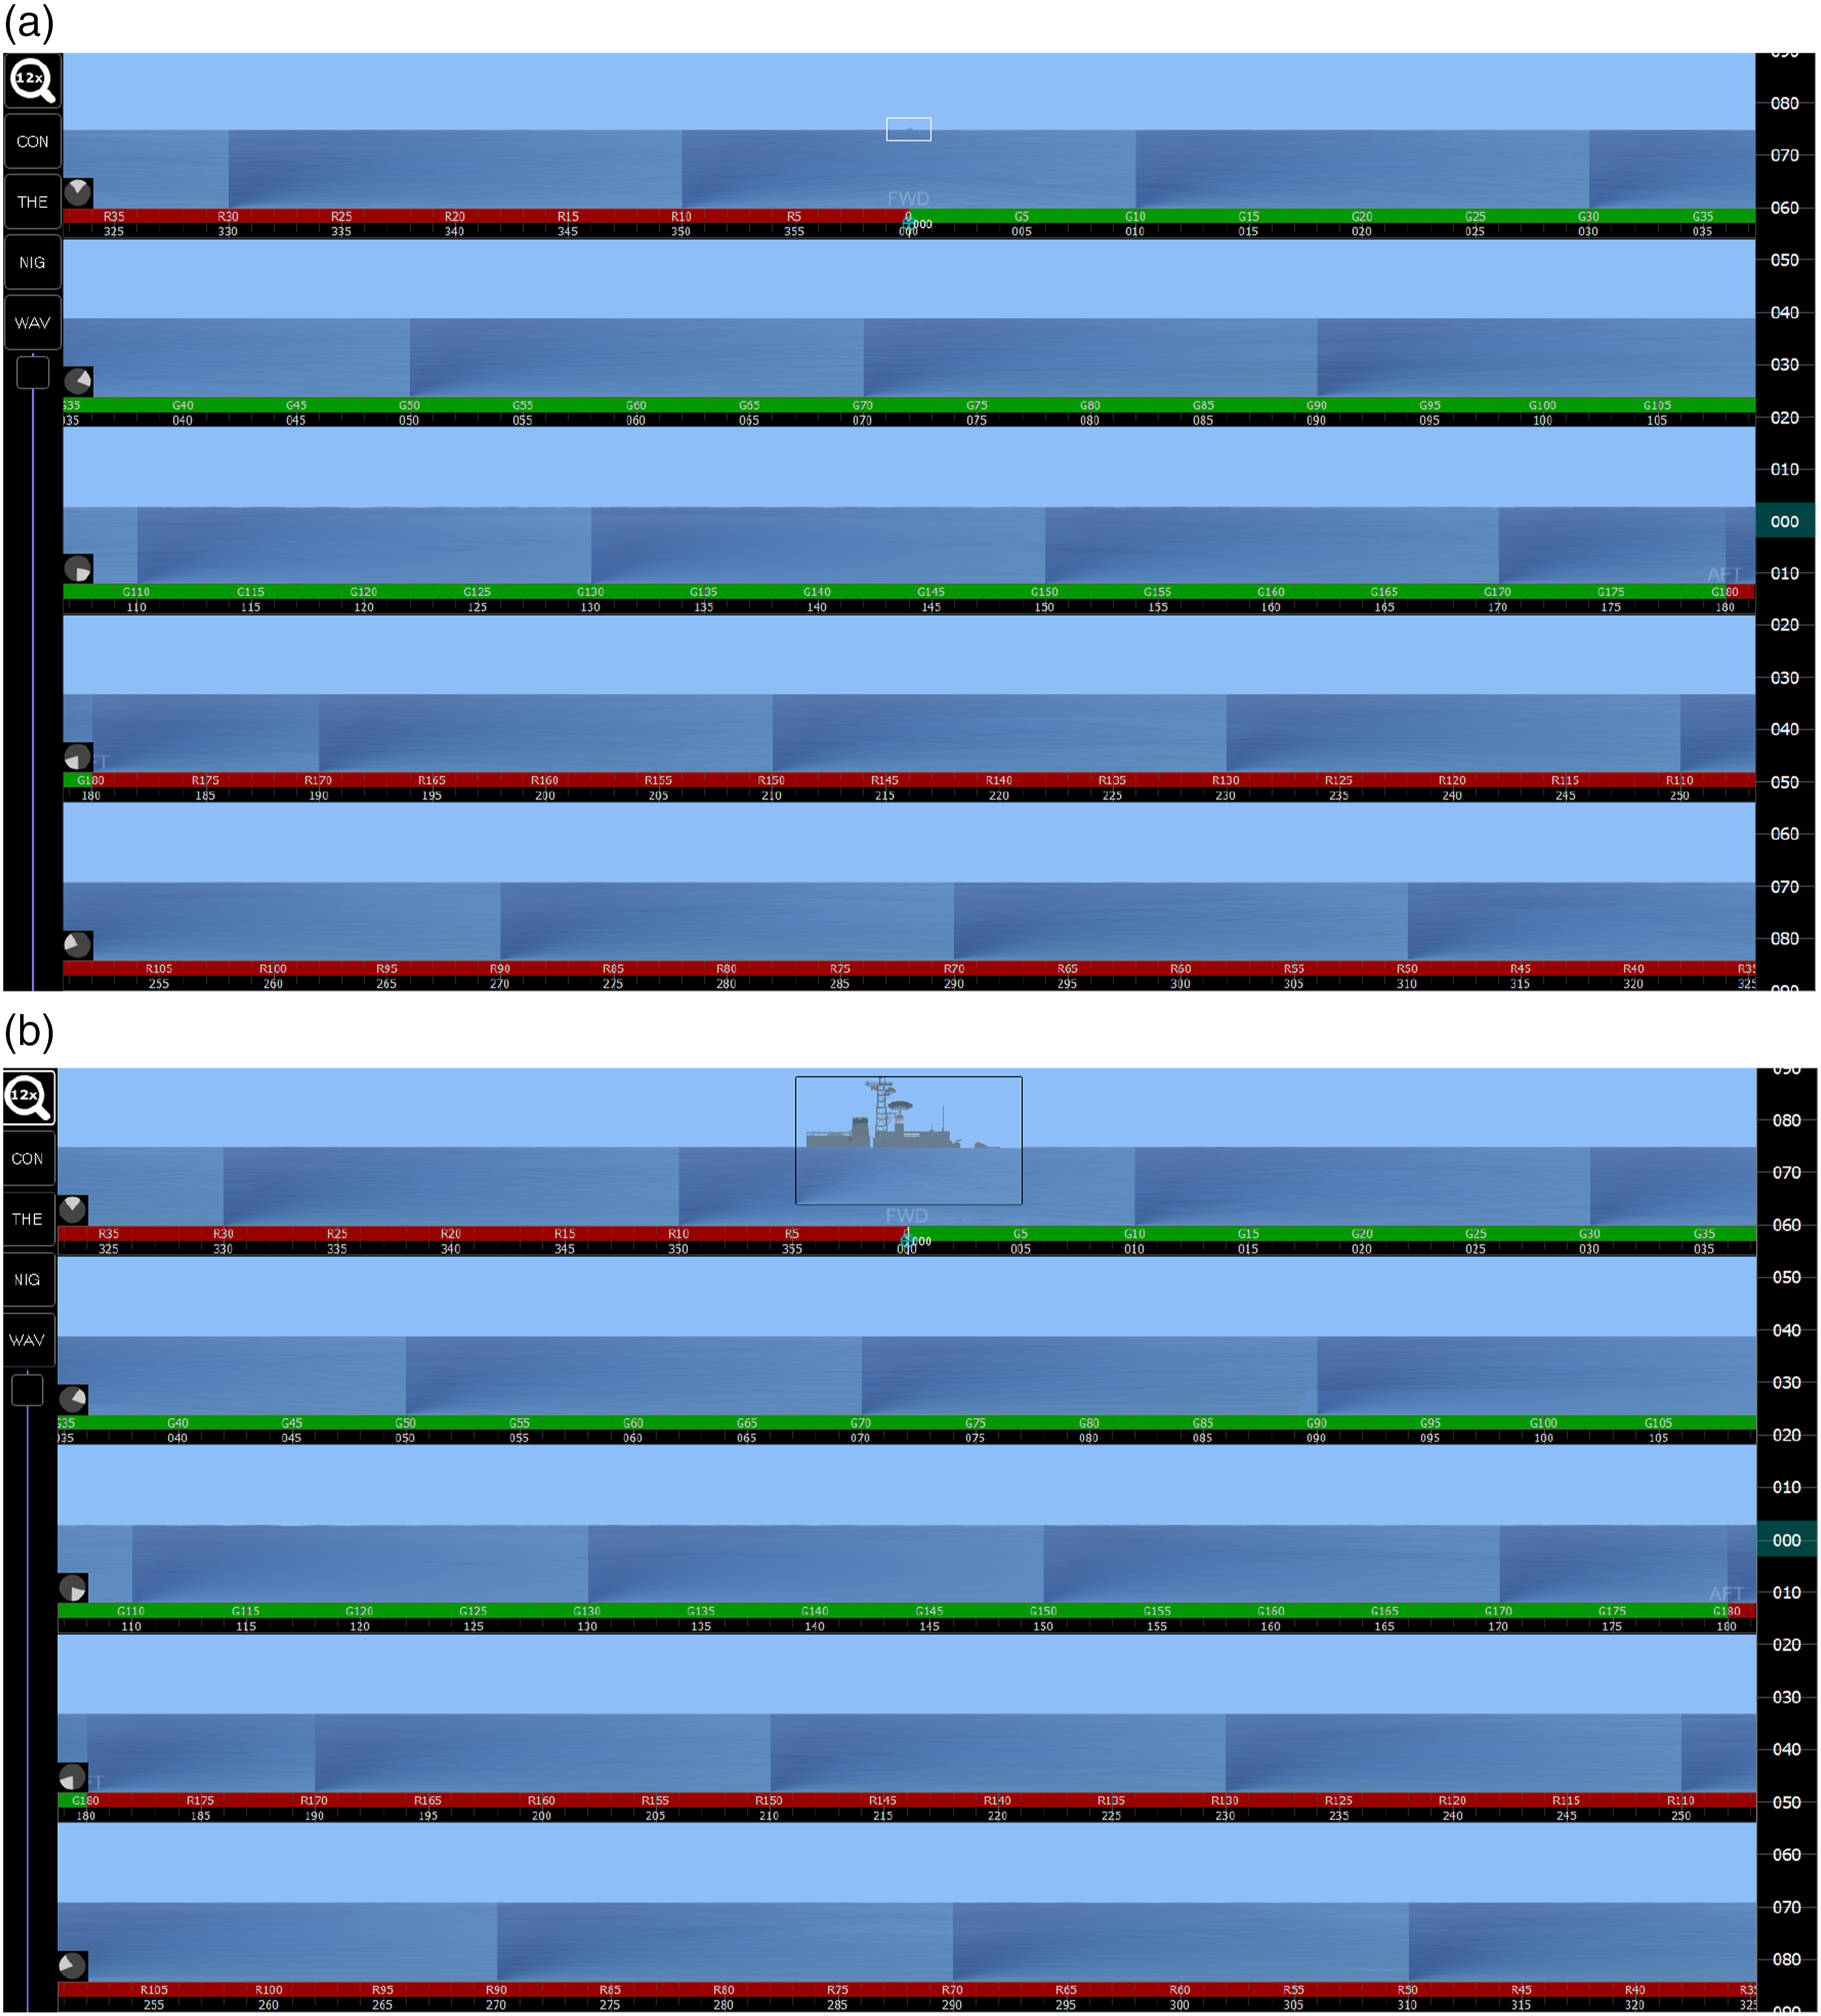
Each digital periscope prototype was designed to present information at either low or high magnification. For OPTIX, the display showed an arc of 36° of the horizon on low magnification and an arc of 3° of the horizon at high magnification (Figure 2). For OPTIMUS, each panel displayed an arc of 75° of the horizon (there was slight overlap over each panel; Figure 3(a) on low magnification. At high magnification, the mouse could be used to move a magnified window to inspect a bearing section on any panel on OPTIMUS. This magnified window showed an arc of 3° of the horizon at its location (see Figure 3(b)). Thus, at low magnification, contacts in OPTIMUS were approximately half the size of contacts in OPTIX, whereas at high magnification contacts in both prototypes were of equivalent size.
Experiment 1 compared contact detection performance, perceived system usability, and perceived workload across the two digital periscope prototypes (OPTIX and OPTIMUS) in scenarios with continuously appearing contacts that required monitoring of periscope displays. Contact distance was manipulated by presenting half the contacts ‘Near’ (average onset range 3.5 kiloyards) and the other half ‘Far’ (average onset range 13.8 kiloyards) from Ownship. The distance manipulation affected the size of each contact in terms of its visual angle and the amount of the contact visible above horizon (e.g. contacts mast only). However, other factors that impact the visibility of far-range contacts (e.g. haze and light scatter) were not modelled, and for this reason, the imagery of both Near and Far contacts was more similar to real-world short-range contacts in good visibility conditions. Participants completed scenarios using low magnification displays, high magnification displays (or the magnification window for OPTIMUS), or ‘hybrid’ magnification in which participants could choose to alternate between high and low magnification.
Method
Participants
Twenty-four participants (10 males and 14 females) were recruited from The University of Western Australia (UWA). Participants took part for compensation of US$20 AUD. The mean age of participants was 27.2 (SD = 8.7). No participants reported prior experience with submarines or related task domains, and all reported normal or corrected-to-normal vision. This research complied with the American Psychological Association Code of Ethics and was approved by the Human Research Ethics Office at UWA (RA/4/20/5883). Informed consent was obtained from each participant in person prior to the experiment.
Prototype Concepts and Stimuli
Each digital periscope prototype was presented on a 1920 x 1080, 27-inch monitor (Figures 1 and 2) and were developed and administered within the submarine Control Room Use Simulation Environment (CRUSE; Michailovs et al., 2023, 2024). The OPTIX (Figure 2) and OPTIMUS (Figure 3) displays were presented on the upper monitor of two vertically aligned monitors, with the lower monitor blank in Experiment 1. Note that, as shown in Figure 4, in Experiment 2, the lower monitor was not blanked and instead provided information panels and digital tools for contact range and course estimation (see further details in Experiment 2). An example of an individual performing the task using OPTIMUS (i.e. on two vertically aligned monitors). In Experiment 1, the lower monitor was blanked, while in Experiment 2, it was not (as pictured).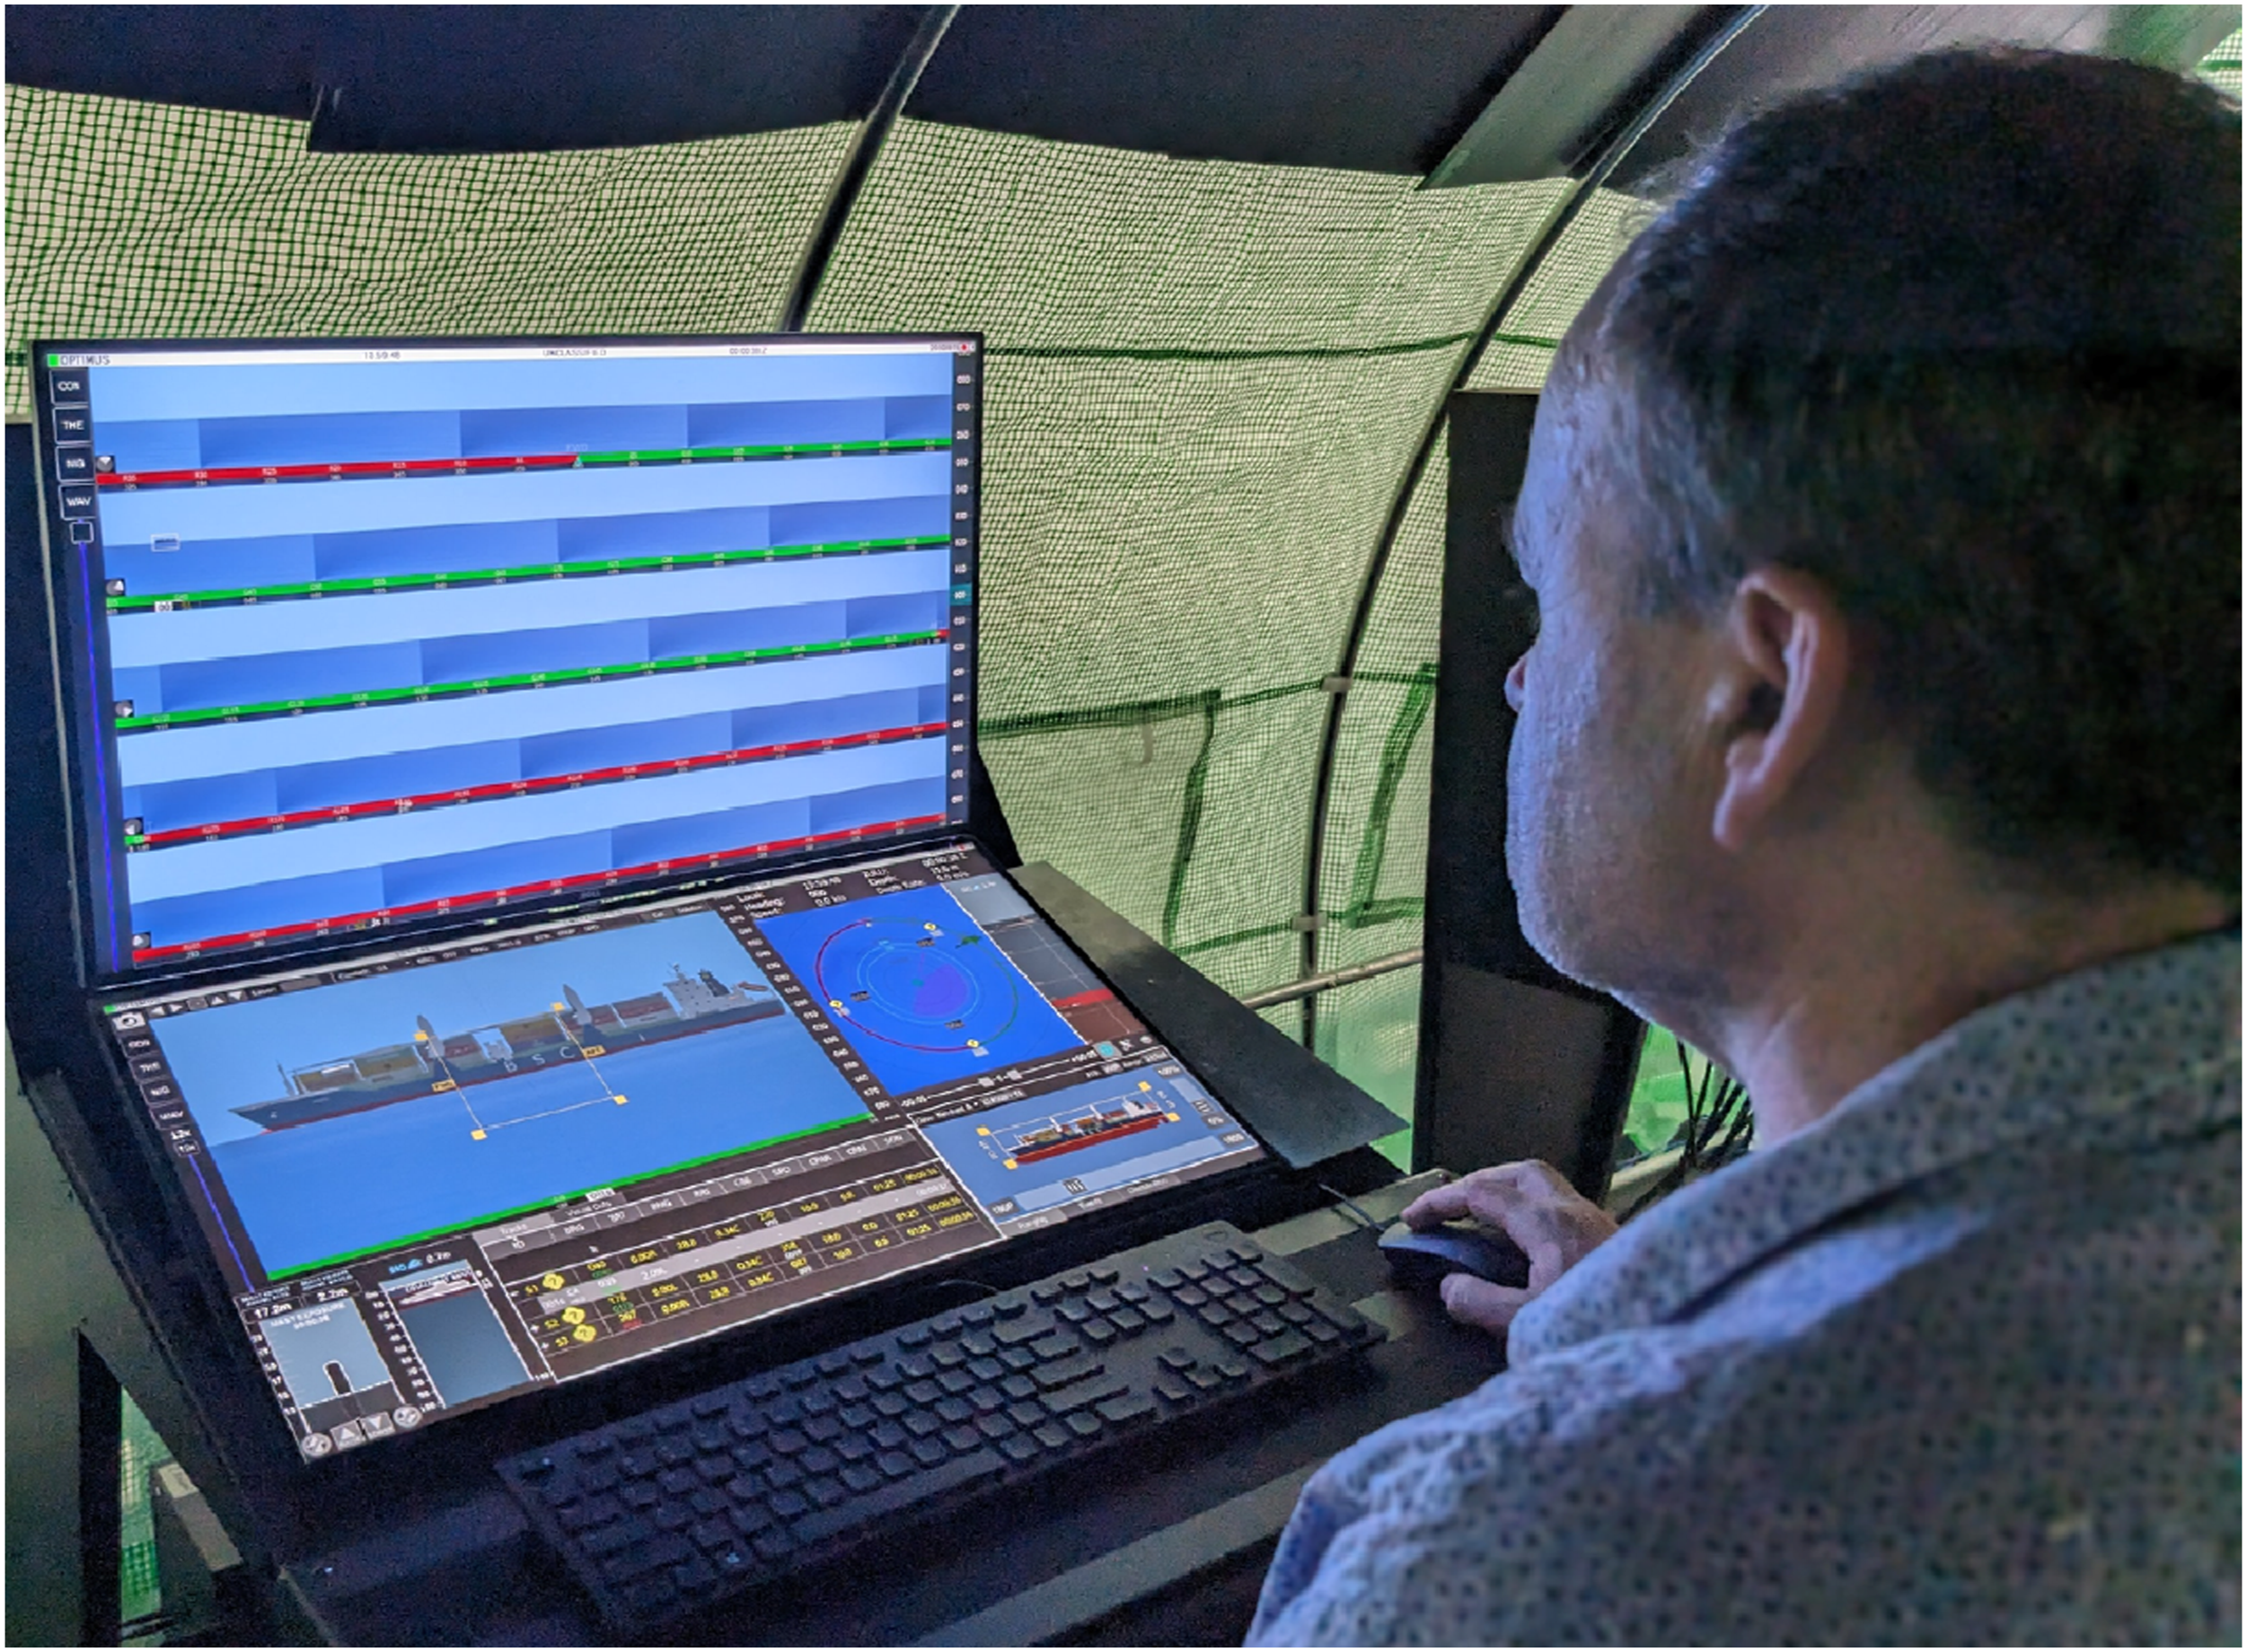
Imagery was created in the Unity graphics engine and the digital periscope prototypes were coded in Python. The same Unity models (contacts) were presented in each digital periscope prototype. Both prototypes expressed range in yards and kiloyards to ensure consistency with submarine systems (1000 yards = 914 m). For OPTIX, in the hybrid magnification condition, the magnification in the field of view could be changed between low and ×12 high, using the plus and minus keys or by selecting and dragging the slider on the display with the left mouse button (see Figure 2). For OPTIMUS, in the hybrid magnification condition, the magnified window could be toggled on and off by holding down or releasing the left mouse button. Participants indicated contacts they had detected by double-clicking on them with the left mouse button. In both digital periscope prototypes, a marker was added to the bearing strip when a contact was detected by the participant. The time at which each contact was detected was recorded by the system. A contact was recorded as detected if the participant double-clicked within 10° either side of the contact. Any contact that was not ‘detected’ by the end of the scenario was considered ‘missed’.
Participants were instructed how to conduct the detection task under each magnification condition. For OPTIX, participants scanned only in low magnification when in the low magnification condition, and used only high magnification when in the high magnification condition. In the OPTIX hybrid magnification condition, participants were encouraged to start with a quick low magnification all around scan before using high magnification. For OPTIMUS, participants in the low magnification condition were instructed to search for contacts with no specific search method recommended (i.e. as preferred). Participants in the OPTIMUS high magnification condition were encouraged to systematically scan the entire field of view (all rows) with the high magnification window and to respond to a potential contact only when they reached it in their scan pattern. This was designed to make this condition comparable to the OPTIX high magnification condition where only contacts in the viewing arc could be marked. In the OPTIMUS hybrid magnification condition, participants were encouraged to do a quick visual sweep of the 360° field of view with low magnification at the beginning of each scenario to detect immediately visible contacts.
Contact Detection Scenarios
Six, 6-min scenarios were developed, each with 20 contacts. Each scenario had the same contact types (e.g. warships and fishing vessels) that were differentiated by consistently presented visual characteristics (e.g. colour, height, and length). Although these contacts features were consistent across each scenario, they appeared at different bearings to counter learning effects. Each contact appeared within one of 20 sectors of 18° around Ownship, with the bearing of the contact chosen randomly except that it was at least 6° from the edge of its sector (equating to the edge of the row). Contact bearings remained constant for the duration of the scenario.
Each participant completed all six scenarios, three scenarios with each of the two prototypes (with one of the three scenarios within each prototype block completed at each of the three magnification conditions). The OPTIX and OPTIMUS prototype conditions were completed in blocks (order counterbalanced across participants), with the order of presentation of the three magnification conditions within blocks determined using a Latin square. Each scenario was assigned to each digital periscope prototype and each magnification at least twice across participants. Participants were randomly assigned to digital periscope prototype presentation order. Contacts were evenly divided between Near and Far. Far contacts gradually came over the horizon towards the Ownship. Eight Far contacts could be detected from the start of the scenario (four were visible under low magnification and four required high magnification), and two became visible later in the scenario. Three Near contacts were visible from the start of the scenario, and the remaining seven abruptly appeared at intervals throughout the scenario (as might be expected to occur if a contact had emerged from behind another contact). Following onset, each contact remained on the display for the scenario duration.
Measures
Contact detection accuracy and time-to-detect contacts were recorded. This primarily reflects the safety aspect of a periscope operators’ role – identifying contacts quickly and accurately is essential for stealthy submarine operation. Accurate detection was defined as clicking within a 10° bearing of a contact and was calculated as the proportion of the total number of contacts detected in each scenario. Contact detection time was computed as the difference between the time a contact was first visible (onset time) and the time it was detected. Onset time was defined as the moment the contact was discernible on the horizon to an operator looking directly at its location. The contact onset times were determined by authors of this paper looking for known single contacts and were estimated separately for each contact for each magnification. This was necessary, as the simulation did not consistently render contacts at very far ranges due to processing constraints, and there was no reliable method to determine a priori when the contact would be visible. In the ‘hybrid’ condition, the onset time for the contact at high magnification was used. We did not use a minimum number of pixels to define target onset time as the absolute number of pixels varied by periscope concept, by design (i.e. an equivalent contact would always be rendered larger on OPTIX). Note that this method ensured the exact same contact-specific target onset times were used in calculating contact detection times when individuals used OPTIX and OPTIMUS, so any error of contact detection time measurement would be a small absolute error, rather than a condition-based error that would introduce an experimental confound.
To broaden our assessment of the impact of the digital periscope prototypes, perceived workload and perceived usability were also measured. The Modified Cooper Harper (MCH: Wierwille & Casali, 1983) scale was used to assess perceived workload. The MCH uses a decision tree to elicit operator perceived workload, on a scale of 1–10. Perceived usability of the digital periscope prototypes were measured using the System Usability Scale (Brooke, 1996).
Analysis Approach
Bayesian statistics are reported. Quantifying uncertainty amongst competing hypotheses (including the null) using Bayesian statistics is a principled and well-supported practice (Vandekerckhove et al., 2018) and avoids some of the critiqued limitations of frequentist statistics (Wagenmakers et al., 2018a; Wasserstein & Lazar, 2016). The key advantage of Bayesian statistics is the ability to quantify evidence for the null hypothesis (as opposed to frequentist statistics only failing to reject it with a p-value point-estimate). In this manner, Bayesian statistics provide a range between which researchers can be certain for or against a hypothesis, rather than only receiving a single point-estimate.
The posterior probability for the winning model (i.e. the likelihood of a specific combination of parameters being the ‘true model’) is reported, with numbers closer to one indicating stronger preference for that specific model. In place of p-values, the Bayes Factor (BF) is reported, which can be interpreted as the strength of evidence for one hypothesis over another (e.g. a Bayes Factor of 10 means one hypothesis is 10 times more likely than the other; Wagenmakers et al., 2018b). The commonly reported standard of BF >3 as ‘weak evidence’, BF >5 as ‘moderate evidence’, BF >10 as ‘strong evidence’, and BF >100 as ‘very strong evidence’ (e.g. Etz & Vandekerckhove, 2016) is followed, avoiding the use of a single arbitrary cut-off for our hypothesis tests.
To distinguish evidence for the alternate versus null hypotheses, BF10 is reported when evidence favours the alternate hypothesis (i.e. that there is a difference or effect), and BF01 when evidence favours the null hypothesis of no difference. When reporting descriptive statistics, the 95% Bayesian Credible Interval (Wagenmakers et al., 2018b) is reported in line with the Bayesian statistical framework used throughout. All analyses were conducted using the free statistical software JASP (Love et al., 2019).
Procedure
Experimental sessions began with verbal instructions outlining task requirements. Participants were then introduced to the MCH and trained to use OPTIMUS or OPTIX, depending on which they were first assigned. All three magnifications were demonstrated, and practice was conducted with hybrid magnification. As the hybrid condition allowed the use of both low and high magnification, participants were able to practice each magnification.
Following training, each participant completed three scenarios with their first digital periscope prototype, using a different magnification (low, high, and hybrid) for each scenario. Prior to beginning each scenario, participants were reminded of magnification requirements.
After finishing the first three scenarios, participants completed the workload and usability questionnaires, and then were trained on the other digital periscope prototype and repeated the experimental procedure.
Results
Data Exclusion
With 24 participants detecting 20 contacts in each of six scenarios (2 Prototypes x 3 Magnifications), there were a total of 2880 detection events. However, the final contact presented approximately 50 seconds prior to the end of the scenarios was detected only 54.2% of the time compared with an average hit-rate of 96.5% for other contacts. This may have been due to the limited time participants had to detect the contact. On this basis, this contact was excluded, leaving 2736 detection events for analysis.
Asymmetric Transfer
To test for asymmetric transfer, we added ‘prototype used first’ as an ‘order’ factor into the two key ANOVAs (on Accuracy and RT of contact detection). For Accuracy, there was no credible evidence for an effect of the order factor or for its interaction with other factors (all BF01 > 15). For RT, there was a credible order main effect (responses were slightly faster for participants who used the Optronics periscope first, BF10 = 90); however, there were no credible interactions (all BF01 > 23), and the overall trend of results between the two order groups was the same. This result likely only demonstrates sampling noise as each group included 12 participants.
Contact Detection Accuracy
Accuracy as a function of Prototype, Magnification, and Distance is presented in Figure 5. A Bayesian ANOVA on these data, controlling for subject-level variance with a random ‘Subject’ effect, favoured a model including Magnification, Distance, and their interaction (posterior probability = .95). There was strong evidence against an effect of Prototype (BF01 = 54.01) on contact detection accuracy. Conversely, there was very strong evidence for an effect of Magnification on accuracy (BF10 > 1000). High and Hybrid magnification did not show any accuracy differences (BF01 = 29.10), but both had greater accuracy than Low magnification (BF10 = 224.18, and BF10 > 1000 for High and Hybrid, respectively). The very strong evidence for an interaction between Magnification and Distance (BF10 > 1000) reflects the fact that accuracy approached ceiling levels for Near contacts, regardless of Magnification, whereas accuracy was poorer for Far contacts with Low magnification compared to High and Hybrid magnification. Detection accuracy for contacts in Experiment 1 by Magnification and Distance. Collapsed across OPTIX and OPTIMUS. Error bars reflect the 95% Credible Interval around the mean.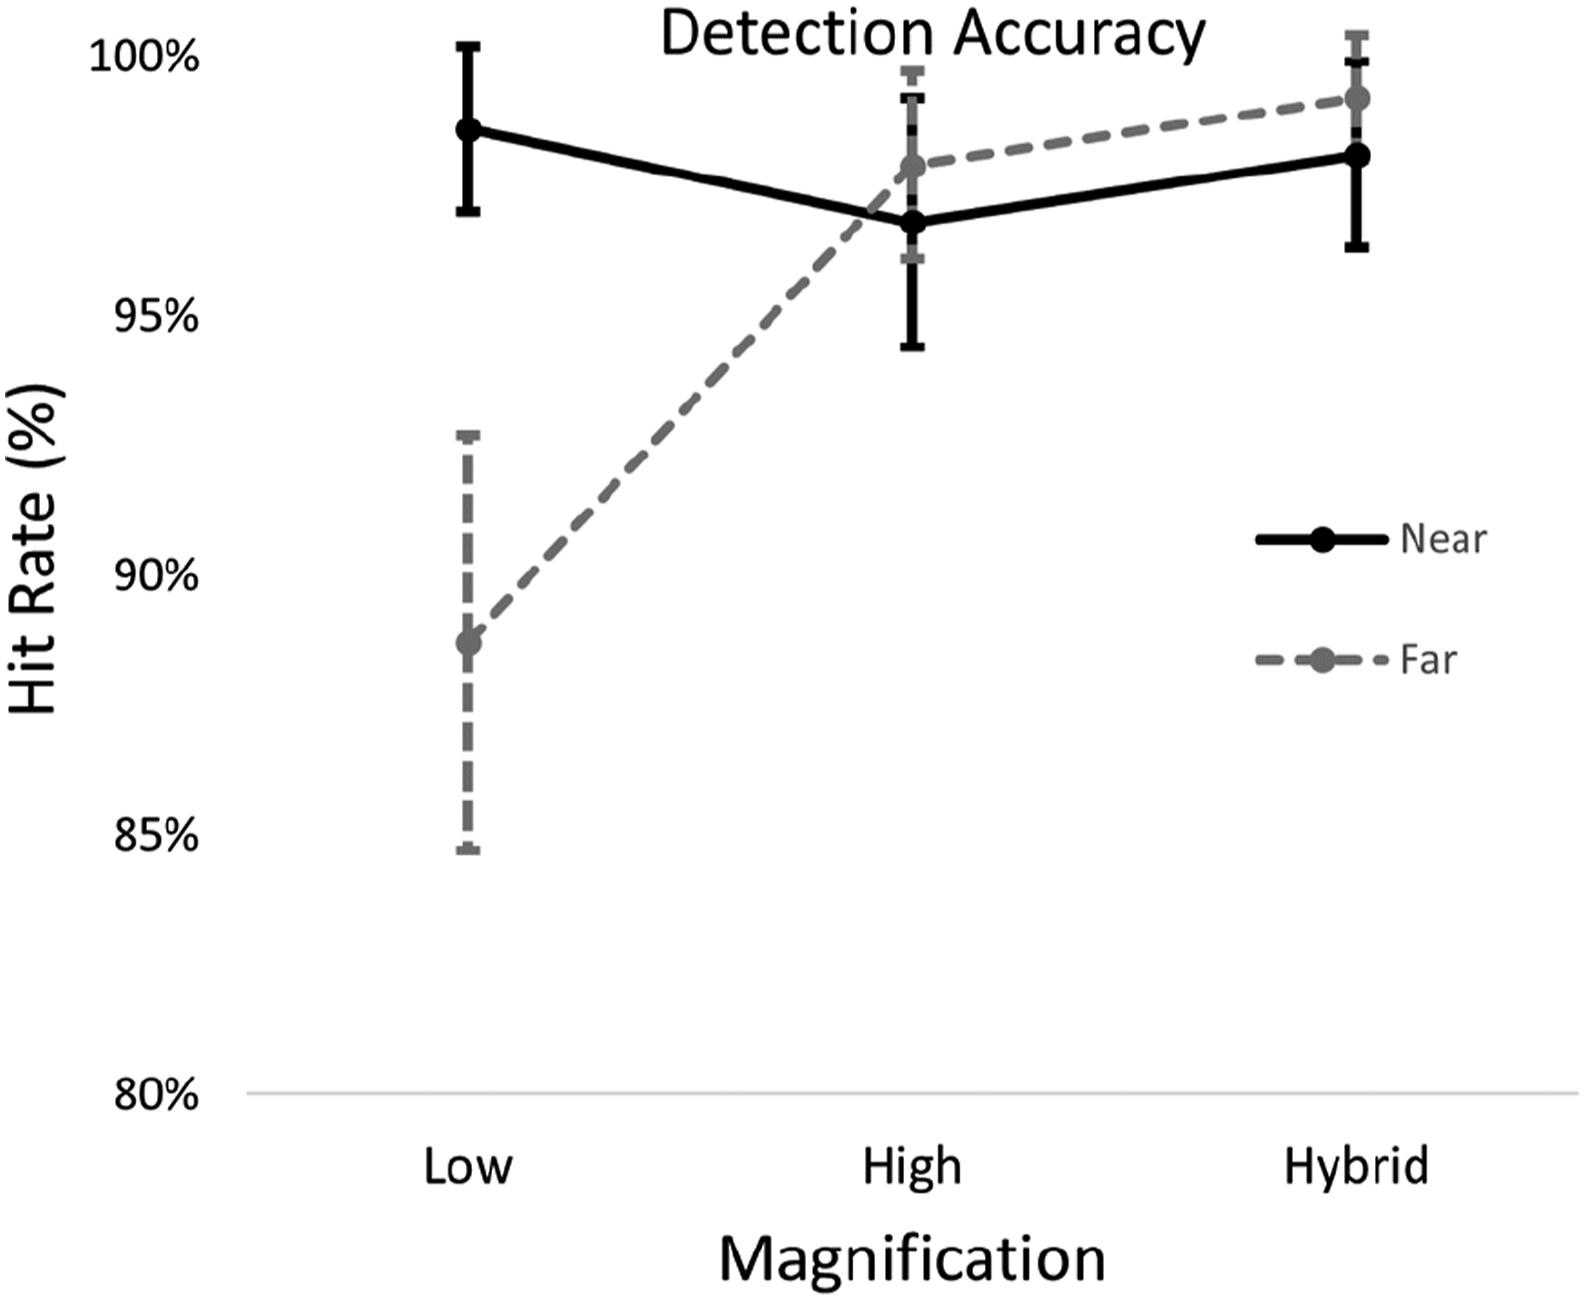
Contact Detection Time
Detection time as a function of Prototype, Magnification, and Distance is presented in Figure 6. A three-way Bayesian ANOVA on these data favoured a model including all three main effects, plus the Prototype x Magnification and Magnification × Distance interactions (posterior probability = .836). There was very strong evidence for the inclusion of Prototype, Distance, and Magnification main effects, and the interactions of Magnification x Distance, and Prototype x Magnification (all BF10 > 100). There was evidence against the interaction of Prototype x Distance (BF01 = 15.87) but inconclusive evidence for or against the three-way interaction (BF10 = 1.96). Detection time for Near (left panel) and Far (right panel) contacts, by Prototype and Magnification. Error bars represent the 95% Credible Interval around the mean.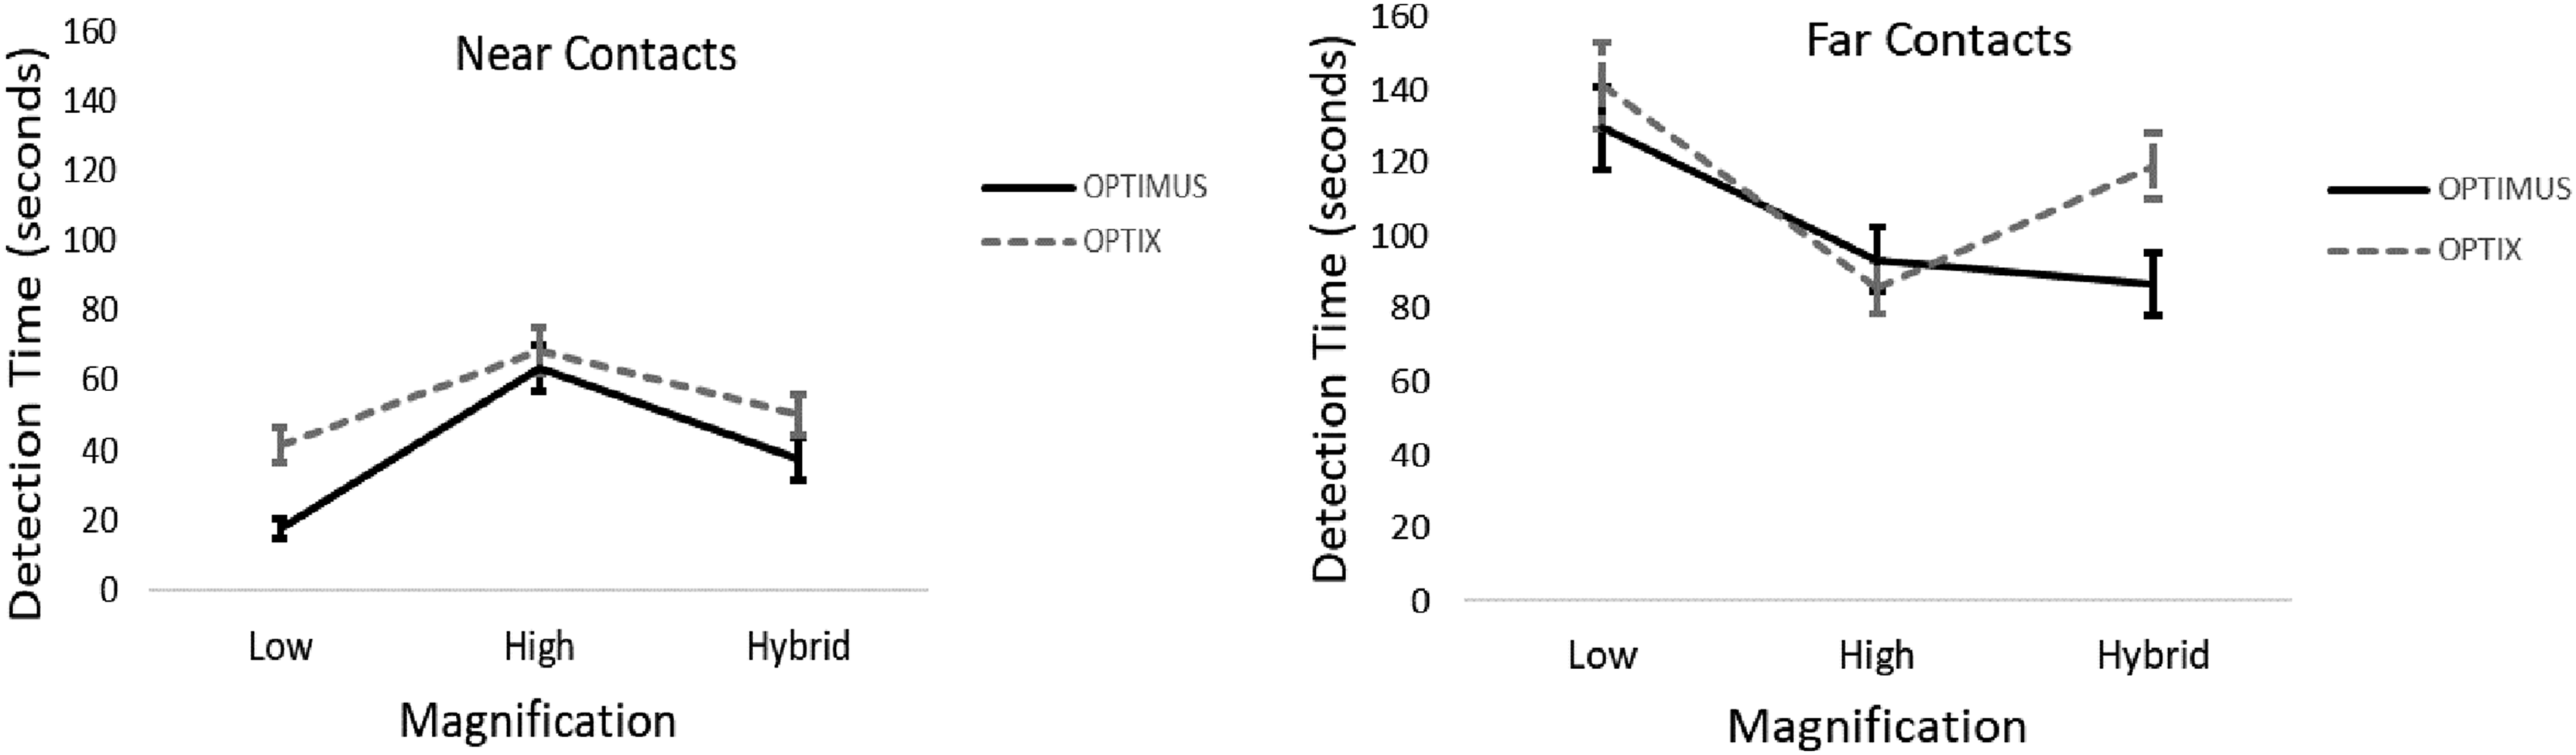
On average, OPTIMUS resulted in faster contact detection than OPTIX. Near contacts were detected substantially faster than Far contacts, while detection under Hybrid magnification was on average faster than High, which was faster than Low magnification (only the difference between Hybrid and Low reached significance after correcting for multiple comparisons). The Prototype × Magnification interaction reflects a small or absent detection speed advantage for the OPTIMUS Prototype (relative to OPTIX) at High magnification compared to that OPTIMUS prototypes strong and systematic detection speed advantage over the OPTIX prototype under Low or Hybrid magnifications (Figure 6, left panel). JASP cannot compute Bayes Factors for post-hoc interactions, but Tukey-corrected p-values showed significantly faster detection for OPTIMUS compared with OPTIX at Low (p Tukey <.001) and Hybrid (p Tukey <.001) magnifications, but not at High (p Tukey = 1.00) magnification, where the performance of the two prototypes was equivalent. In summary, whilst the specific pattern of performance across magnification conditions differs for near and far contacts, the contact detection speed advantage of the OPTIMUS prototype (relative to OPTIX) at Low and Hybrid magnifications is robust.
Perceived Workload and Usability
On the MCH, a higher score (out of 10) indicates higher reported workload. A Bayesian paired-samples t test showed inconclusive evidence for the null hypothesis (BF01 = 2.42) indicating that MCH scores for OPTIMUS (M = 3.26, 95% CI [2.05, 4.78]) and OPTIX (M = 3.78, 95% CI [2.23, 4.77] were indistinguishable. On the SUS, a higher score (out of 10) indicates a more usable system. Three participants failed to complete one question. The results were therefore scored out of 9, and then re-scaled to be in the same range as the other participants. A Bayesian paired-samples t test showed no evidence for or against a difference in the perceived usability between OPTIMUS (M = 77.41, 95% CI [71.60, 83.22]) and OPTIX (M = 71.42, 95% CI [64.35, 78.50], BF01 = 2.14).
Discussion
Experiment 1 compared contact detection between two digital periscope prototypes (OPTIX and OPTIMUS) across Near and Far contacts using three magnifications. Overall, there was no difference in detection accuracy between the digital periscope prototypes. However, OPTIMUS did yield faster detection of contacts compared with OPTIX. The detection time advantage for OPTIMUS compared to OPTIX was exhibited under Low and Hybrid magnification strategies but was absent with High magnification where both systems had restricted 3° field of views. A potential explanation for this interaction is that using low and hybrid magnification strategies in OPTIMUS attracted a more efficient search process as the panorama may have allowed attention to be guided to salient stimuli within the operator’s peripheral vision, while the High magnification condition specifically prevented this from occurring in both digital periscope prototypes. If so, the exhibited OPTIMUS induced performance is essentially equivalent to the serial OPTIX prototype. The OPTIMUS detection speed advantage held for both Near and Far contacts. The pattern of results for Far contacts suggests that the combined benefit of the panoramic display with the hybrid magnification strategy could result in a ‘pop out’ effect, where some contacts were more immediately salient, whereas other contacts were small enough that they required magnification to be identified. In this way, the hybrid magnification of the panoramic (OPTIMUS) prototype seems best tailored to the human visual search system, which combines fast, broad coverage searches (Wolfe, 2021) with more guided, spotlight style searches (Cave & Bichot, 1999). That is, the OPTIMUS prototype provides access to all visual information at once, allowing efficient search for maximal speed advantage, and the hybrid magnification tool facilitates the guided spotlight search component.
Overall, our data suggest that the potential disadvantage of a smaller presentation of a contact in the OPTIMUS 360° field of view compared to OPTIX at low magnification was outweighed by the potential advantage of having continuous access to the 360° visual horizon in OPTIMUS and could be further overcome by access to operator-guided magnification tools. There was no difference between digital periscope prototypes in terms of perceived workload or system usability. It is concluded that for the simulated submarine periscope user task of contact detection under high visibility/contrast conditions, the OPTIMUS 360° field of view prototype offers advantage for faster contact detection without accompanying costs.
Experiment 2
As indicated in Experiment 1, the switch to digital periscope technology opens up options to extend the visual field of the periscope operator. Important as the submarine digital periscope would be for providing a representation of the external world for contact detection, estimating subsequent contact behaviour is as paramount, and is carried out hand-in-hand with contact detection to complete submarine patrols and missions.
In addition to the differences in its representation of the external world, modern technology provides opportunities to add digital tools to aid operators in range estimation (the distance between Ownship and the contact) and course estimation (inferred from contact visual aspect or ‘angle-on-the-bow’). Although, on the face of it, digital aids should be superior to conventional manual estimation techniques, the increased information presentation associated with digital tools and potential associated display clutter/interference/response competition (Eriksen & Eriksen, 1974; Moacdieh & Sarter, 2015; Whitney & Levi, 2011), could increase cognitive load, and this could outweigh the potential advantages. With this in mind, Experiment 2 examined whether these tasks that are more complex than contact detection are better supported by the digital tools available in OPTIMUS compared to conventional manual aids represented in OPTIX. Further, although there was no difference in perceived workload or system usability as a function of digital periscope prototype when detecting contacts, the provision of digital tools for the more complex tasks of contact range and course estimation may decrease perceived workload and increase perceived system usability.
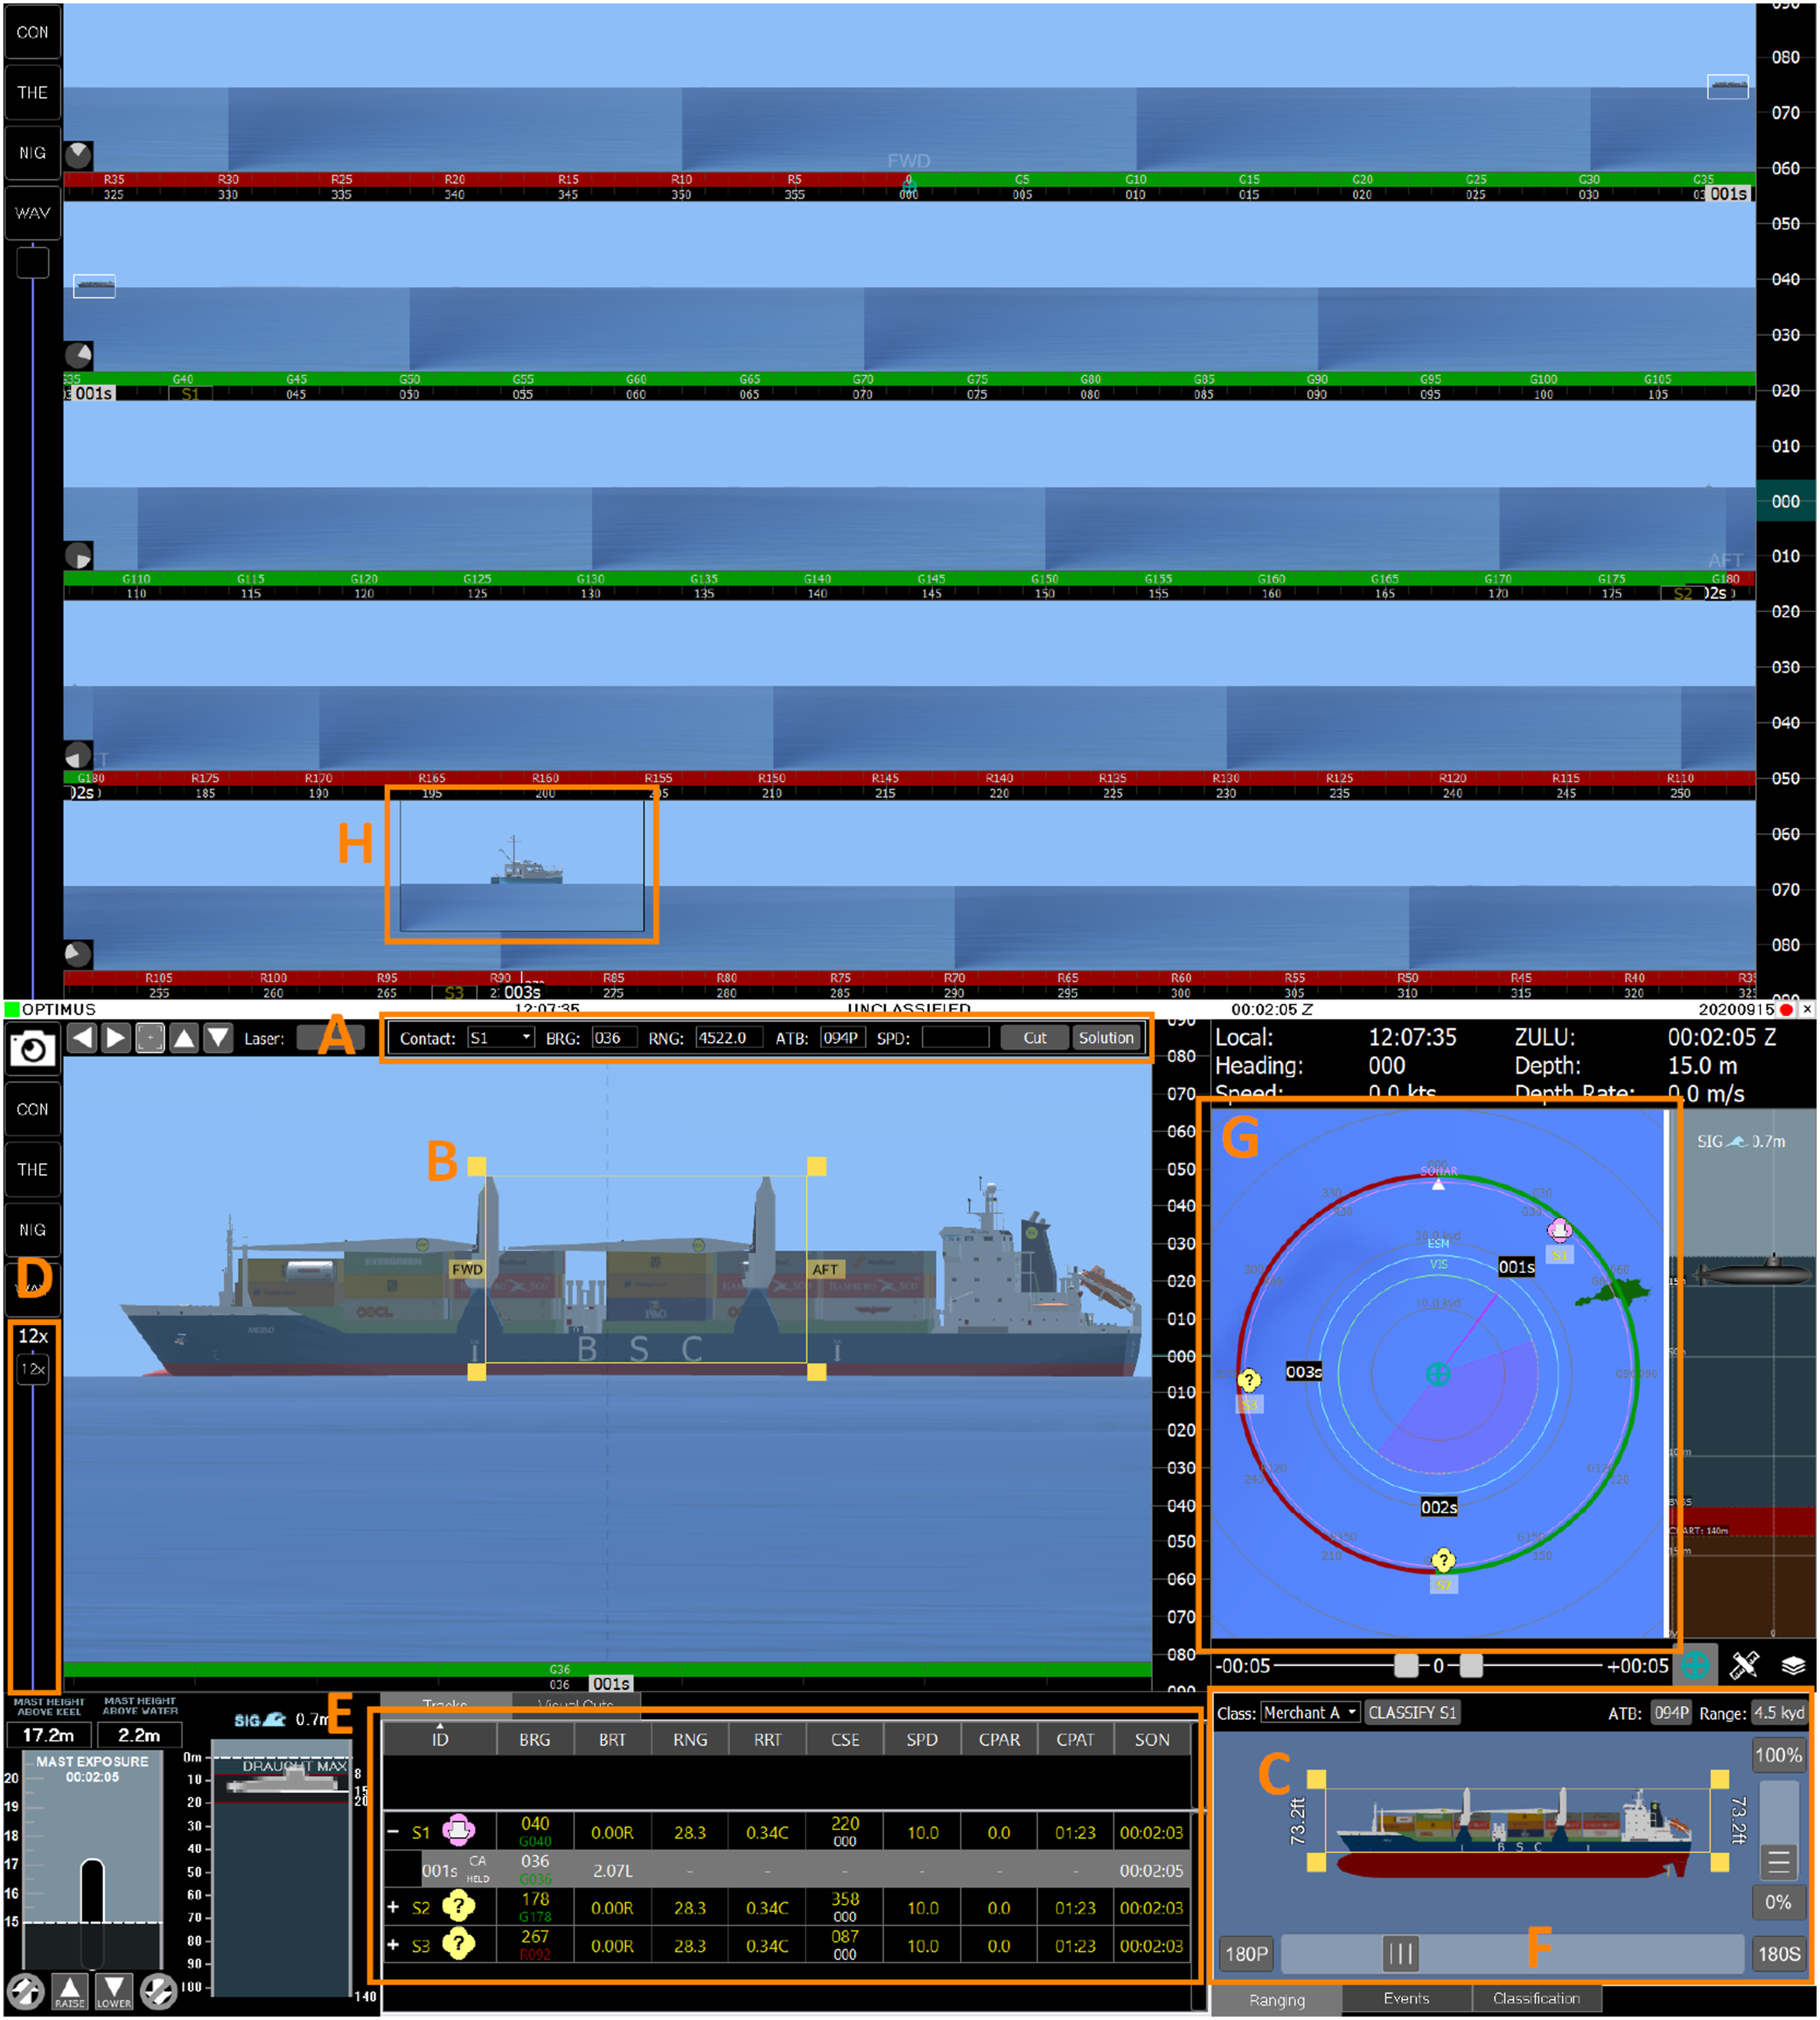
To avoid confounding the effects of digital tools and differences in time taken to detect contacts (as shown in Experiment 1) between OPTIMUS and OPTIX, all contacts were automatically detected and highlighted for participants in Experiment 2. Contact classification was then undertaken by the participants for each highlighted contact using tools common to both OPTIMUS and OPTIX (with minor differences in the physical location of the classification tools on the display). Digital three-dimensional models of potential contacts in the analysis panel were presented in OPTIMUS (Figure 7(c)), which allowed participants to match digital object model features directly to contact images to allow for more accurate contact range and course estimates. In contrast, when using OPTIX participants estimated contact range and course using a combination of heuristics, system calculations, and a physical model akin to procedures used with conventional periscopes (Figure 8). The OPTIX digital periscope prototype as presented on two vertically aligned monitors, with key features marked. (a) Visual cut window. Range information could be sent to this window once operators had manipulated the range bars (b), and angle-on-the-bow (course) estimates were entered manually. (b) Range bars, which operators adjusted to match the lines on the 2D silhouette in the classification database (f). (c) Contact height bins specific to the contact classification. A height bin was selected with reference to the contact’s classification image in the classification database (f) and position of range bars (b). (d) Magnification slider for controlling magnification. (e) Contact tote listing the contacts currently in the system and their associated data. (f) Classification database with height intelligence. Images of different classification types could be viewed in this database, allowing participants to match a visible contact to a classification type. Once a classified contact was selected for analysis, the classification database provided height reference lines for ranging. (g) Geoplot showing a bird’s eye view of the location and direction of travel of Ownship (centre) and surrounding contacts. Unlabelled prototype elements were not referred to in this experiment. The OPTIMUS digital periscope prototype as presented on two vertically aligned monitors, with key features marked. (a) Visual cut window. The range and angle-on-the-bow (course) information in this window automatically updated as operators manipulated the yellow ranging box (b) and range/angle-on-the-bow tool (c). (b) Ranging box in the analysis panel. Operators adjusted the position of the top and bottom lines to self-selected positions on the contact, and then matched these positions by manipulating the ranging box in the range/angle-on-the-bow tool (c) to generate a range estimate. (c) Range/angle-to-the-bow tool showing a 3D model of the currently selected contact’s classification. In addition to the ranging box described above, the slider at the bottom of this tool could be dragged to rotate the 3D model to match the visible contact. This generated an angle-on-the-bow estimate which automatically populated the visual cut window. The range/angle-on-the-bow tool could be toggled to the classification database in order to classify contacts. (d) Magnification slider for controlling magnification in the analysis window. (e) Contact tote listing the contacts currently in the system and their associated data. (f) Classification tab, which switched the range/angle-on-the-bow tool to the classification database (identical to (f) in Figure 5). The panel could be switched back to the range/angle-on-the-bow tool using the “Ranging” tab. (g) Geoplot showing the location and direction of travel of Ownship submarine (centre) and surrounding contacts. (h) Magnified window, which could be controlled by mouse to inspect sections of the panorama. Unlabelled prototype elements were not referred to in this experiment.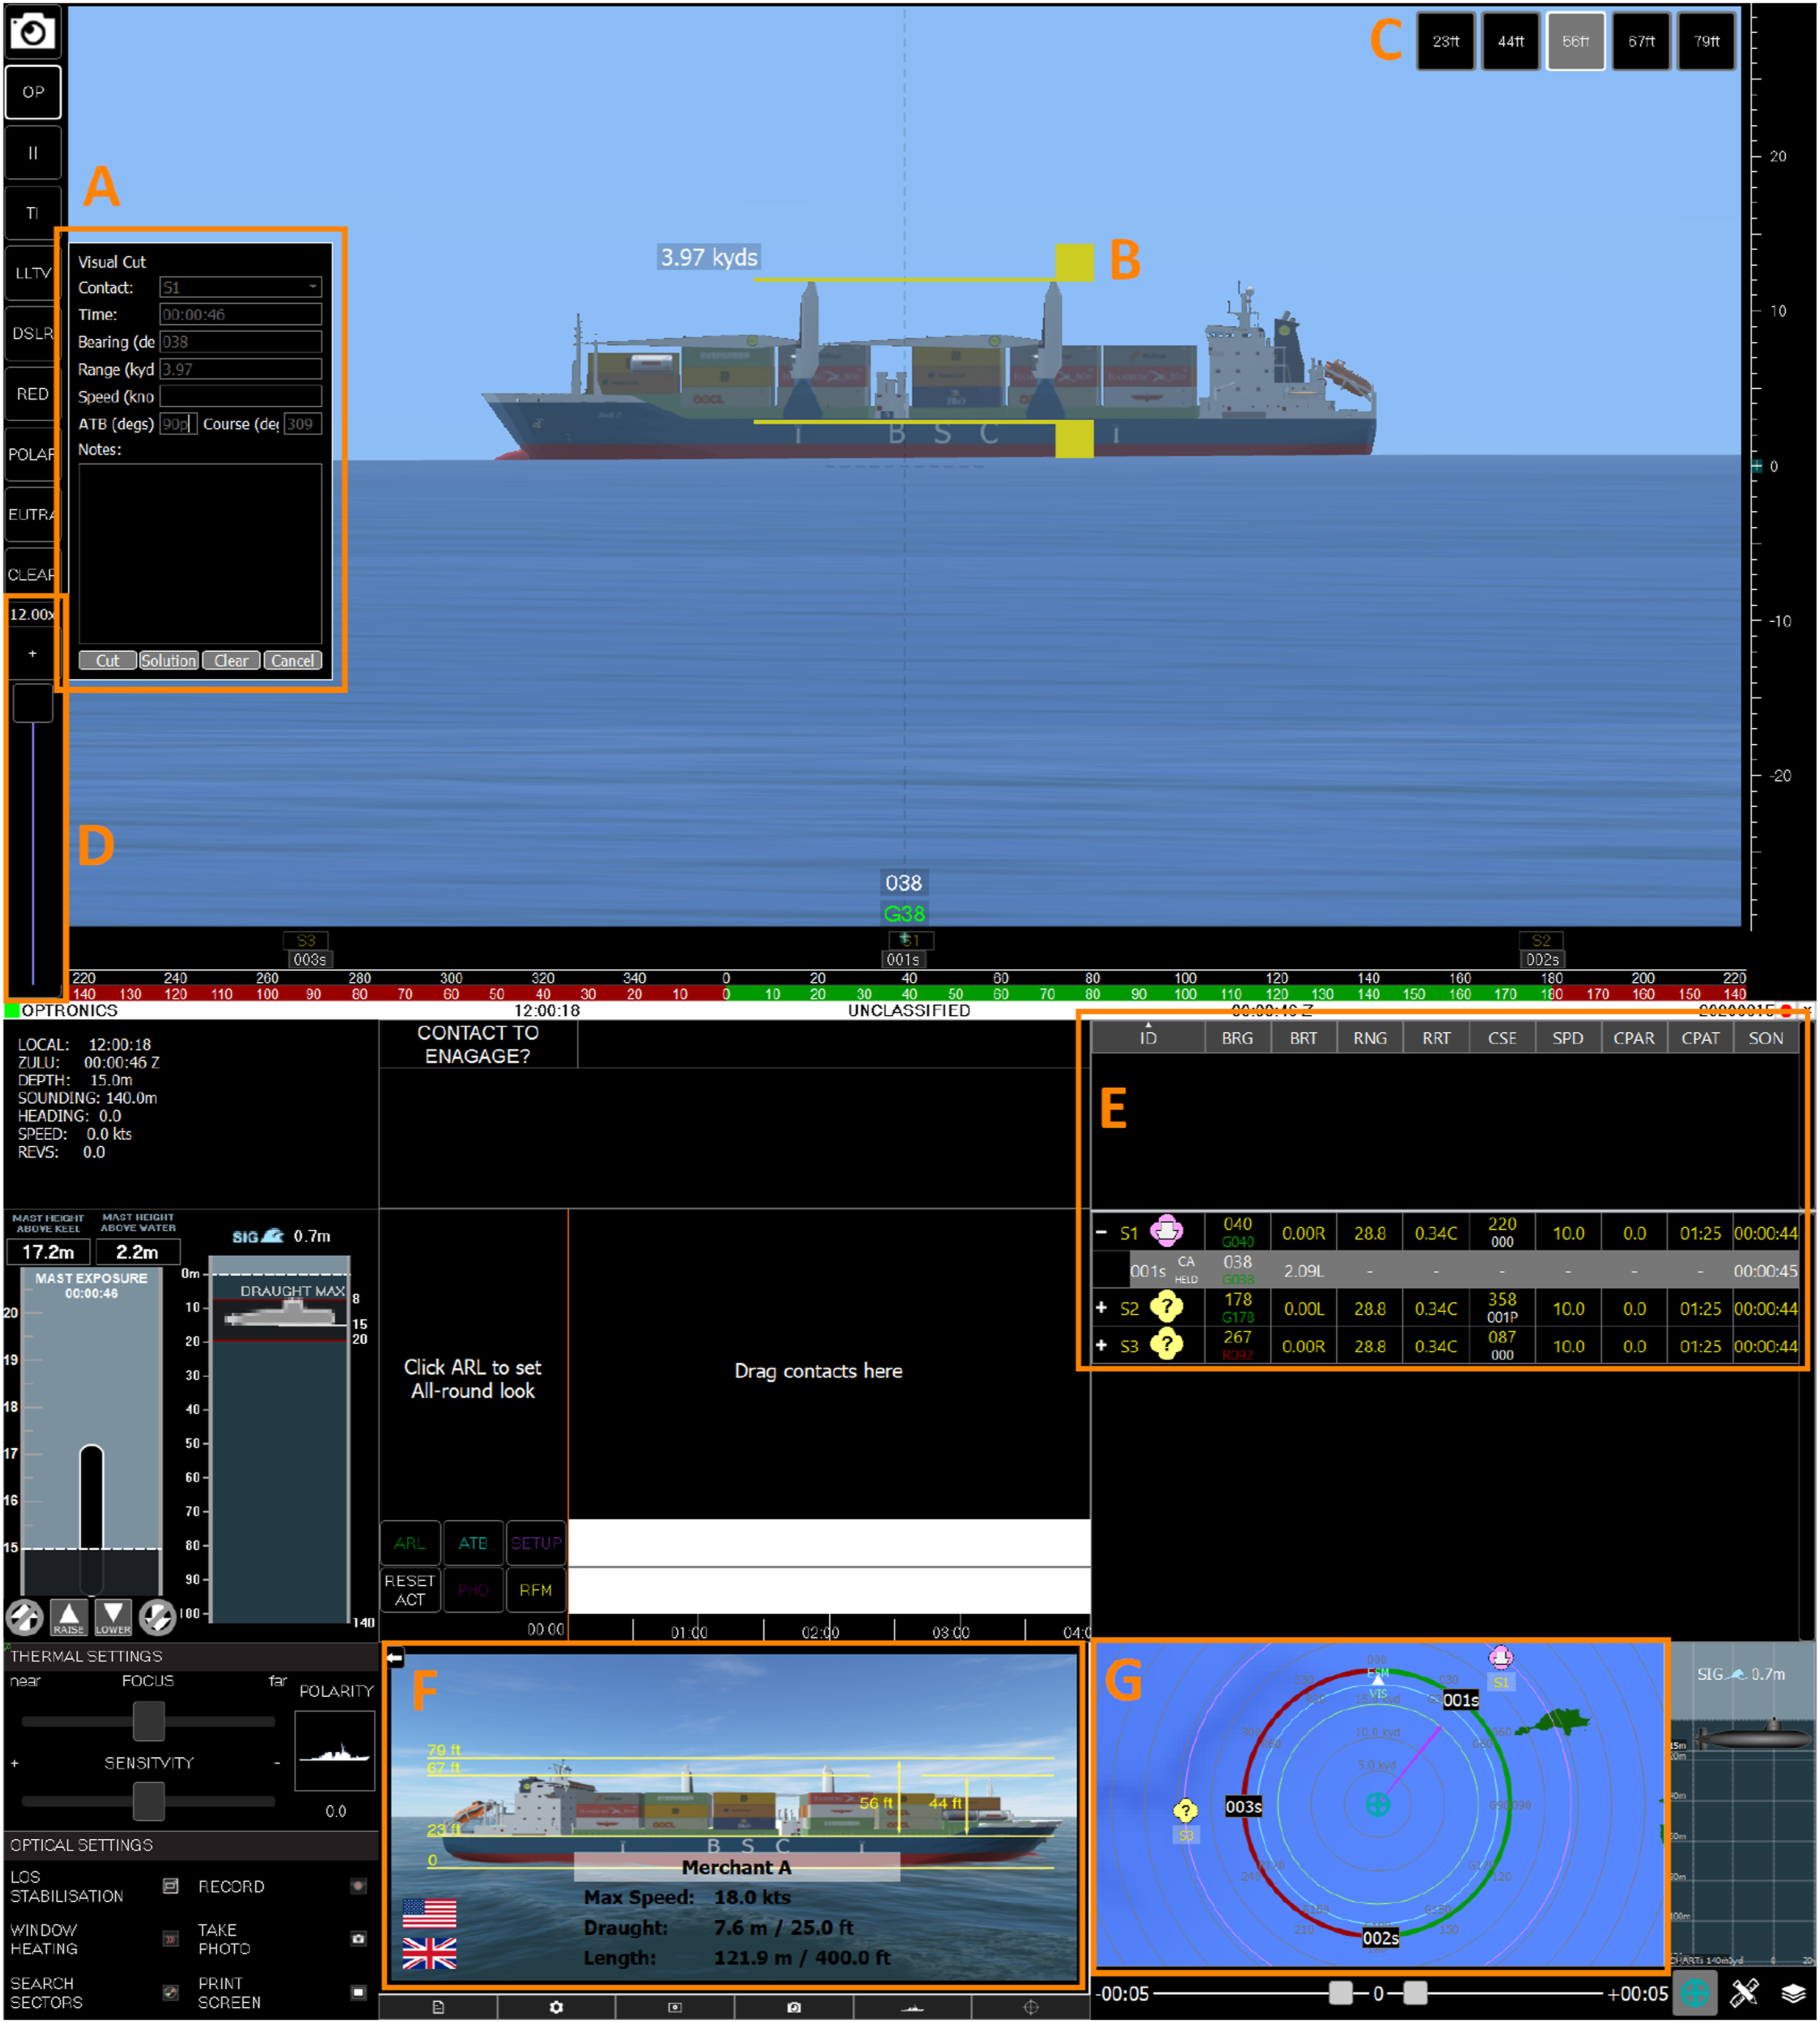
Another potential feature of digital periscopes – automated contact tracking – was tested. For OPTIMUS and OPTIX, in half of scenarios, contacts were ‘auto-tracked’ (the periscope view in OPTIX and the analysis panel in OPTIMUS automatically followed a contact so it did not drift out of frame as it moved relative to Ownship), whereas in the other half, participants had to manually rotate the views to keep contacts in the viewing window.
Method
Participants
Sixteen (10 female and 6 male) participants were recruited from the UWA (none participated in Experiment 1). Participants took part for compensation of US$75 AUD. Mean age of participants was 24.8 years (SD = 5.0). No participants reported prior experience with submarines or related task domains, and all reported normal or corrected-to-normal vision. This research complied with the American Psychological Association Code of Ethics and was approved by the Human Research Ethics Office at UWA (RA/4/20/5883). Informed consent was obtained from each participant in person prior to the experiment.
Prototype Concepts and Stimuli
The two digital periscope prototypes (OPTIX and OPTIMUS) were each presented using two vertically aligned monitors, as in Experiment 1. However in Experiment 2, the lower monitor was not blanked and instead provided a range of information panels and tools, the layout and sizes of which were driven by outcomes of a CWA and human-centred design workshops with submariners (Irons et al., 2019; Schmitt et al., 2013). Figures 7 and 8 present the features of each digital periscope prototype. Note that participants were able to control the magnification level throughout Experiment 2, equivalent to the hybrid magnification condition of Experiment 1.
Participants completed two scenarios using one digital periscope prototype (with and without auto-tracking), followed by two scenarios using the other prototype, with scenario order counterbalanced for both prototype and tracking conditions. In OPTIX, range was estimated by aligning the bars of a range estimate tool (Figure 8(b)) with reference to lines on a standard two-dimensional (2D) broadside silhouette of that class of contact in the classification database (Figure 8(f)) and selecting a corresponding height bin (Figure 8(c)) to generate a range estimate. If the contact was partly obscured by the horizon and/or a height range was chosen on the contact that was not available on the silhouette, the participant needed to add or subtract height values on the 2D silhouette to match the chosen height bin on the periscope view (Figure 8(c)). To estimate course (angle-on-the-bow), participants rotated the physical angle-on-the-bow model (Figure 9) until it matched the direction of the contact on their upper monitor and entered the corresponding angle-on-the-bow. The manual angle-on-the-bow tool used by OPTIX operators. Operators rotated the tool to match the orientation of a contact on their display and noted the corresponding angle-on-the-bow estimate.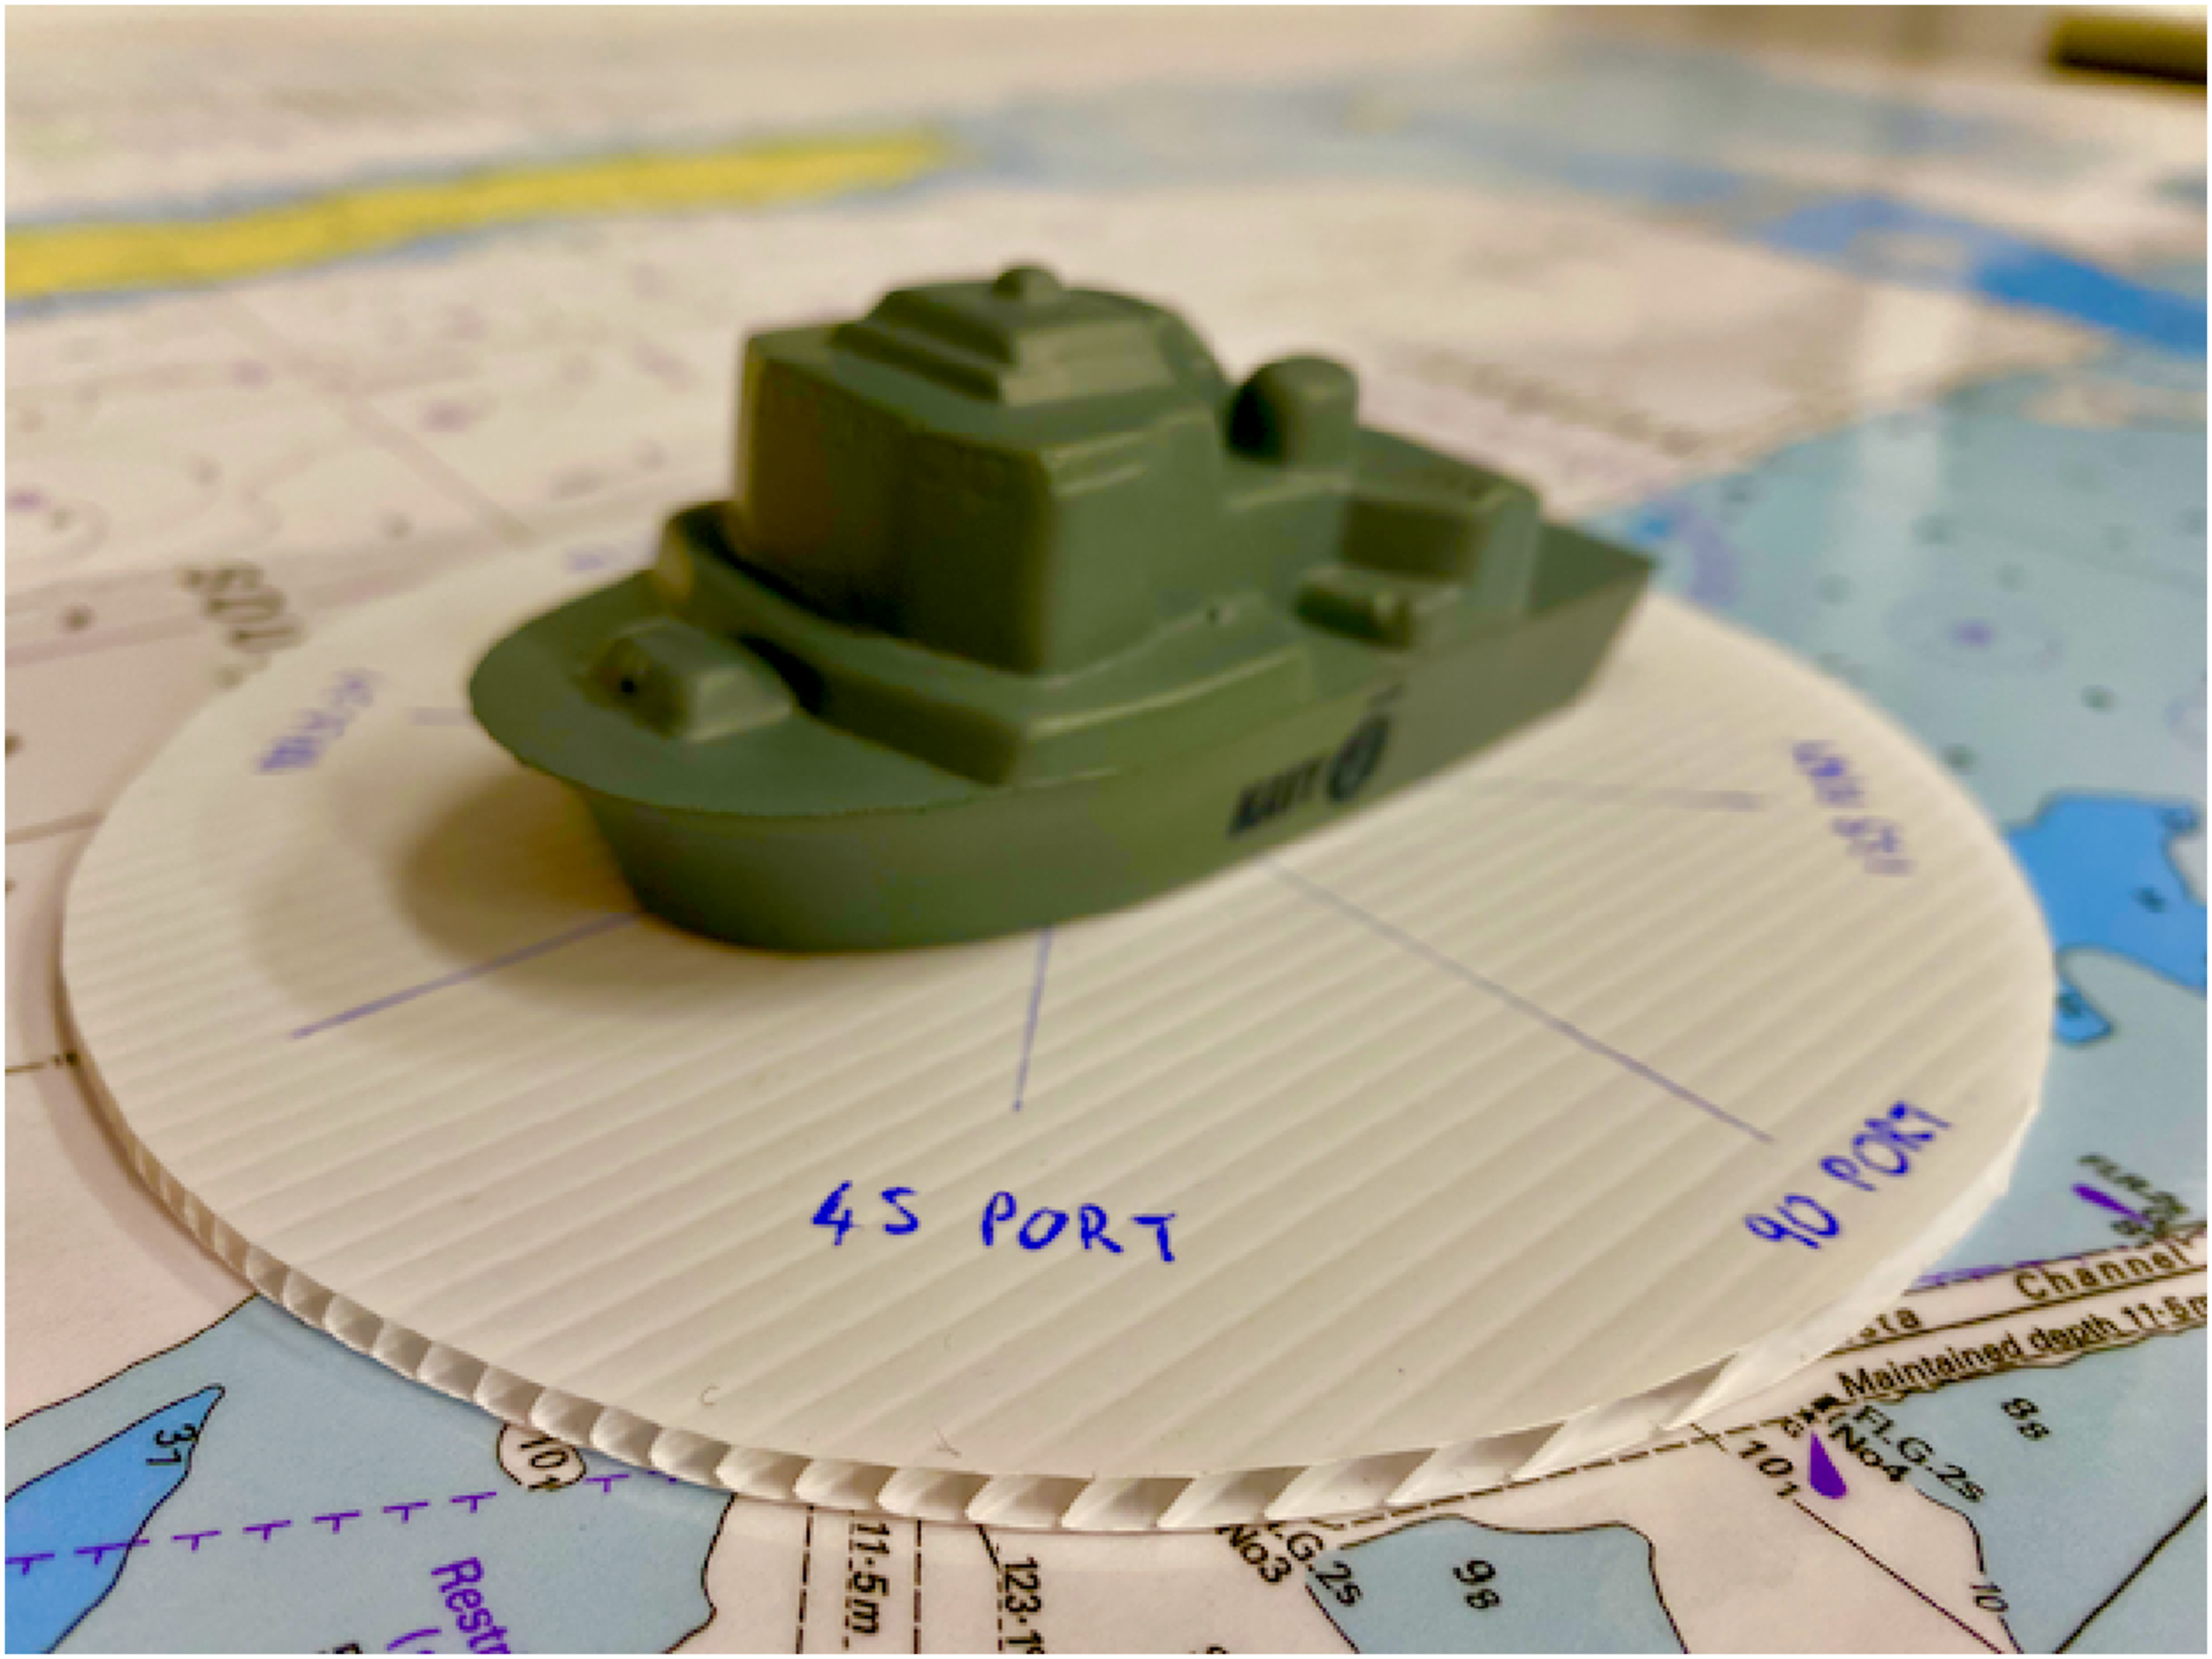
When using OPTIMUS, contact range was estimated by positioning the top and bottom lines of a ranging box (Figure 7(b)) over an image of the contact in the analysis panel, and then positioning a second set of lines to corresponding locations on the three-dimensional (3D) contact model shown in the range/angle-on-the-bow tool (Figure 7(c)). Thus, for OPTIMUS, if the participant had classified the contact, the system could then calculate range and there was no need to select a specific ranging height. When participants used OPTIMUS they did not need to use the physical angle-on-the-bow model. Instead, angle-on-the-bow was estimated by adjusting the angle of the 3D model (Figure 7(c)) by clicking with the left mouse button and dragging the slider until the model matched the visible appearance of the contact. These participant actions populated both range and angle-on-the-bow fields in the range and angle-on-the-bow window.
For both digital periscope prototypes, participants manually entered a range and course estimate for each per contact. This entry was referred to as a ‘visual cut’ and simulated a periscope operator sharing visual estimates with the team. To enter information, participants pressed the ‘cut’ button on the range and angle-on-the-bow window. Participants were asked to submit one cut per contact, and repeat cuts were excluded from analysis.
Scenarios
Two scenarios were generated, each with ten contacts that were automatically marked (detected) on the bearing strip and geoplot. At the start of the scenario, contacts were positioned at evenly spaced bearings, with the classification at each bearing randomized. The speed of contacts was held constant at 5 knots (about 9 km/hr). Contact courses were set so that contacts of the same type had one port angle-on-the-bow and one starboard angle-on-the-bow, one was closing (heading towards Ownship) and the other opening (heading away), and the average angle-on-the-bow was the same across scenarios.
An additional two scenarios were generated by flipping each of the two original scenarios along a North-South line (passing through Ownship) to create mirror image versions. Scenarios were assigned such that participants did not complete a pair of mirrored scenarios on the same digital periscope prototype.
Measurement
Classification accuracy was recorded and classification speed was quantified as the mean time interval between each classification entry (‘inter-classification time’). Range estimation error was quantified as the absolute deviation of the visual cut range from the simulation truth range in yards. Because range estimation was correlated with true range (Pearson’s r = .313, 95% CI [.239, .383], BF10 > 1000), it was divided by true range to create a ‘percentage range error’ that was uncorrelated with true range. Course estimation error was quantified as the absolute deviation of the visual cut course from the simulation truth course, expressed in degrees. The speed of range and course estimation was quantified as the mean time interval between each visual cut (‘inter-cut time’). Perceived workload and usability were measured as in Experiment 1.
Procedure
Experimental sessions began with a twelve-minute video introducing participants to the periscope role, relevant nautical concepts such as port and starboard, and the tasks of contact classification and contact range and angle-on-the-bow estimation. Participants were then trained to use the MCH and introduced to either OPTIMUS or OPTIX (order counterbalanced) and were trained to perform their tasks (with auto-tracking disabled).
Contacts were numbered sequentially and participants were instructed to classify each contact in numerical order. This was achieved by participants in both digital periscope prototypes by matching each contact with a contact type found in the classification database and updating the contact information in the contact tote (Figures 7(e) and 8(e)). Classification automatically changed the contact icon to a fishing, merchant or warship icon, allowing a contact’s classification to be found at a glance on the geoplot (Figures 7(g) and 8(g)). Once all contacts had been classified, participants began estimating their range and angle-on-the-bow. Participants were instructed to complete estimates in order of priority (warships followed by fishing boats followed by merchants). Within each contact type, participants were instructed to prioritize closer contacts.
Following training with one digital periscope prototype, participants completed two scenarios using that prototype with auto-tracking on or off (counterbalanced). Before each scenario, participants were informed that they would either have to manually adjust the viewing window to keep contacts in view (no auto-tracking), or that the system would automatically keep the contact in view (auto-tracking). Scenarios continued until participants had submitted visual cuts for all 10 contacts, which took approximately 15 minutes. After a short break, participants were trained to use the other digital periscope prototype and repeated the experimental procedure with that prototype. Participants completed the MCH after each scenario, and all other questionnaires after the second scenario.
Results
Asymmetric Transfer
To test for asymmetric transfer, we added ‘prototype used first’ as an ‘order’ factor into the key ANOVAs (on Accuracy and RT of contact classification, range error, and course error). Order was not a credible main effect, nor did it interact with any factor in any of the analyses (BFs range from inconclusive to moderate evidence against).
Contact Classification
Accuracy
Over four scenarios, participants provided 640 classification data points in total (16 participants x 4 scenarios x 10 contacts). Accuracy was high (93.1% in OPTIMUS; 96.5% in OPTIX), and a two-way Bayesian ANOVA showed no evidence that either Tracking (BF01 = 16.07) or Prototype (BF01 = 2.67) influenced classification accuracy.
Speed
A two-way Bayesian ANOVA on inter-classification time preferred the model including Prototype only (posterior probability = .86). There was strong evidence for a main effect of Prototype (BF10 = 23.29), and against the inclusion of Tracking (BF01 = 12.08) and the interaction (BF01 = 20.09). Classifications were made faster in OPTIX than OPTIMUS (Figure 10). Classification response time for each digital periscope prototype for auto-tracking present and not present. Error bars represent the 95% Credible Interval around the mean.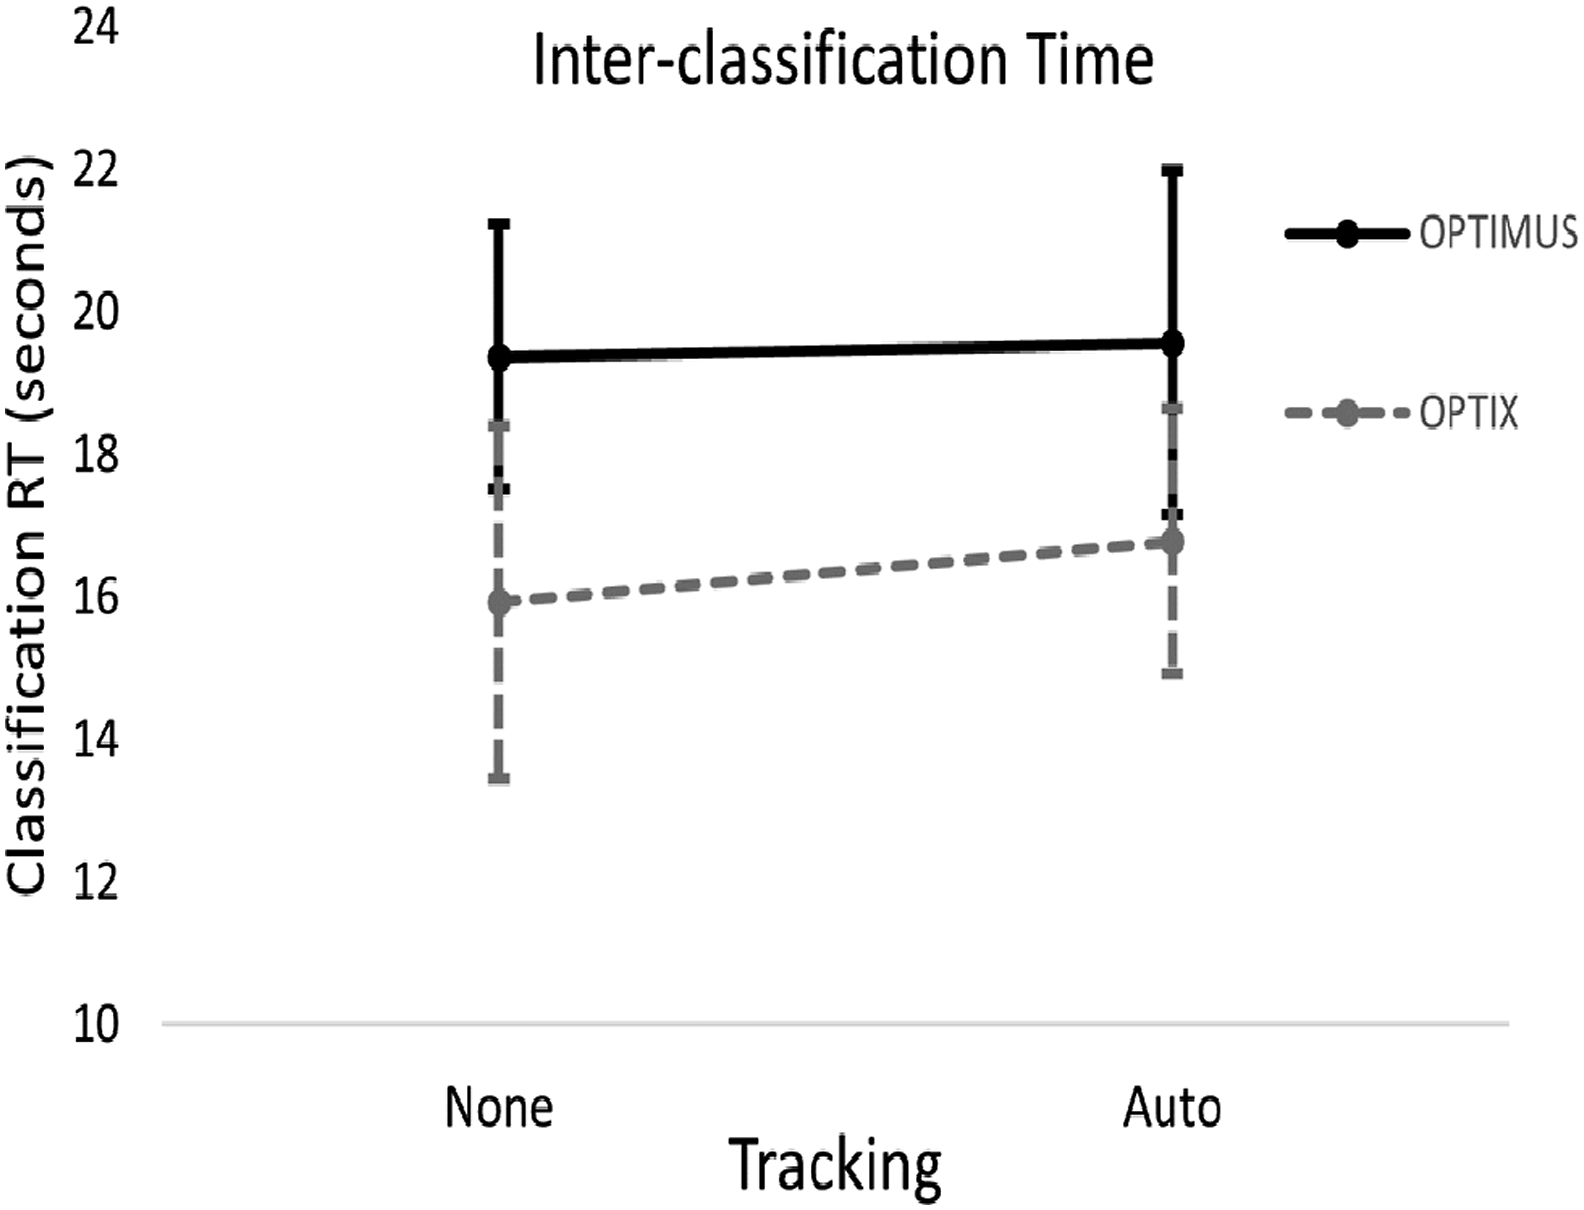
Range Error
Contacts that were misclassified were excluded from analysis of range and course data (leaving 603 valid data points for each). A Bayesian ANOVA on the range percentage error by Prototype and Tracking suggested that the model only including Prototype was preferred (posterior probability = .84). There was very strong evidence for the main effect of Prototype (BF10 > 1000). Range error was approximately half as large in OPTIMUS as it was in OPTIX (Figure 11). There was moderate evidence against both Tracking (BF01 = 7.69) and the interaction term (BF01 = 9.80). Range error as percentage of range for each digital periscope prototype for auto-tracking present and not present. Error bars represent the 95% Credible Interval around the mean.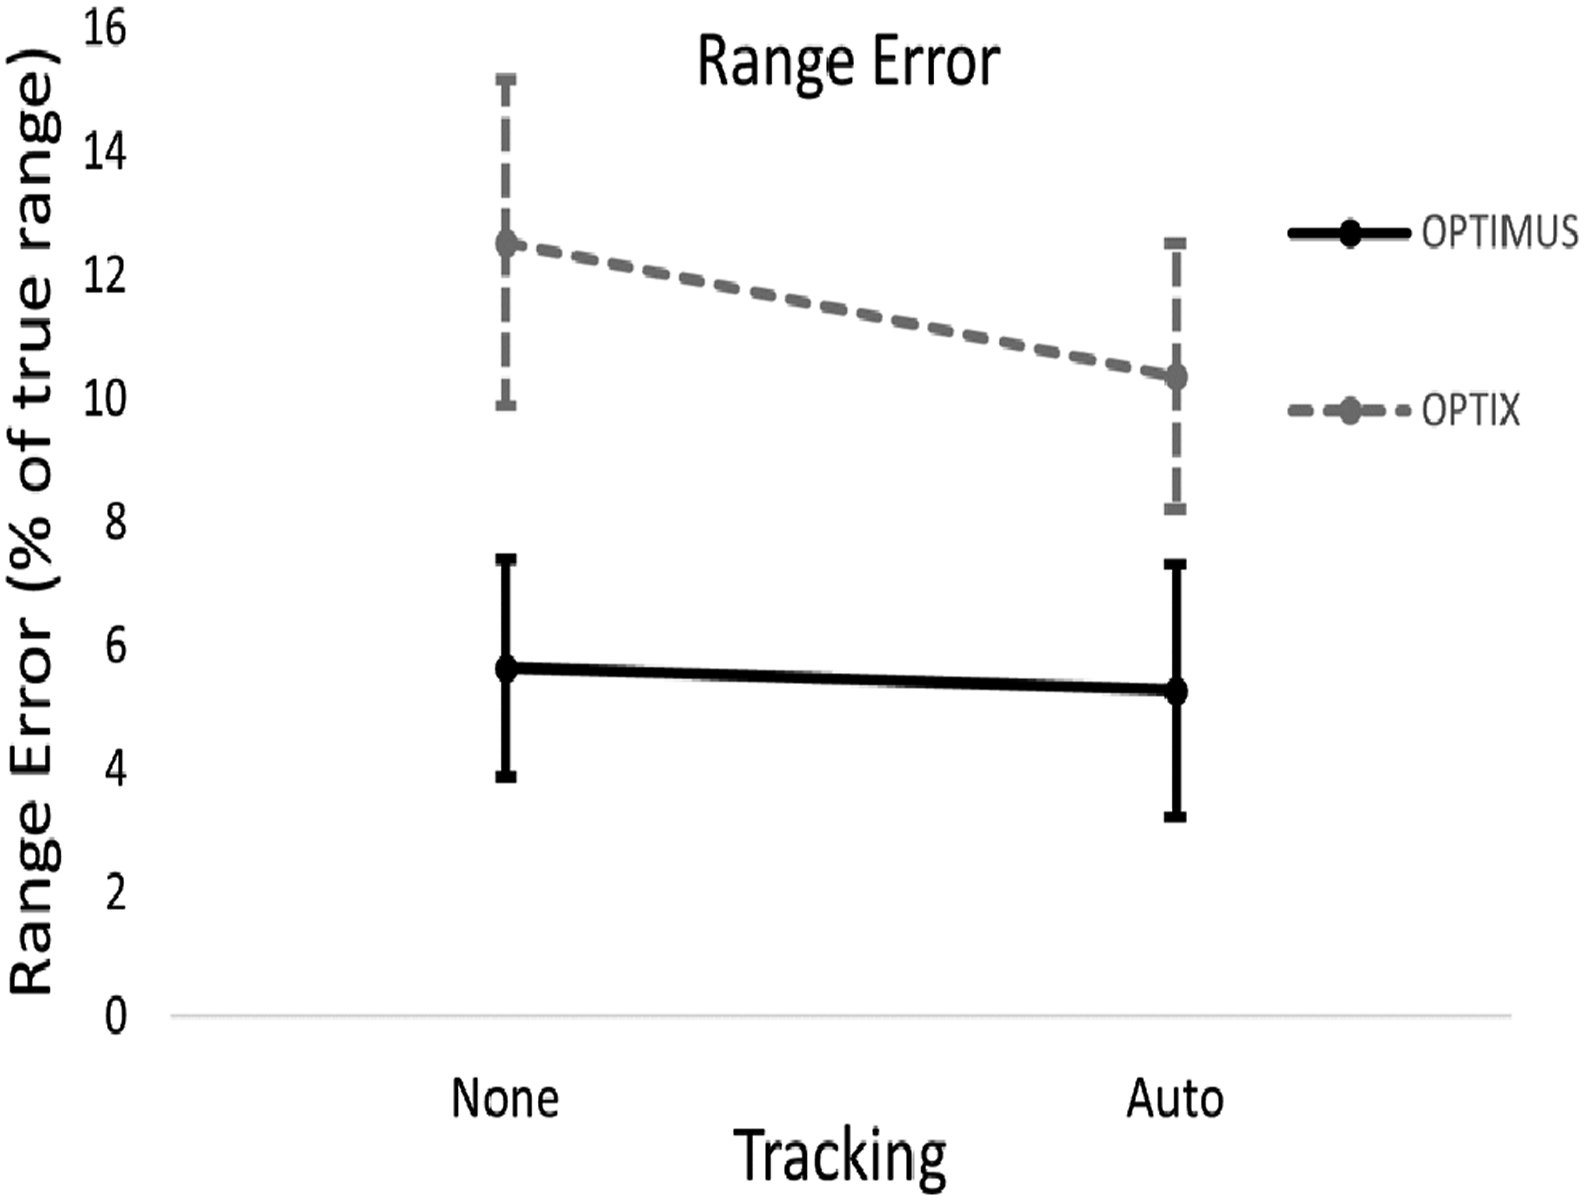
Course (Angle-on-the-Bow) Error
A Bayesian ANOVA on course error data by Prototype and Tracking indicated that the model including only Prototype was preferred (posterior probability >.99). There was very strong evidence for a main effect of Prototype (BF10 > 1000). Course error was approximately half as large in OPTIMUS as it was in OPTIX (Figure 12). There was strong evidence against the main effect of Tracking (BF01 = 10.332) and the interaction term (BF01 = 17.11). Course error in degrees for each digital periscope prototype for auto-tracking present and not present. Error bars represent the 95% Credible Interval around the mean.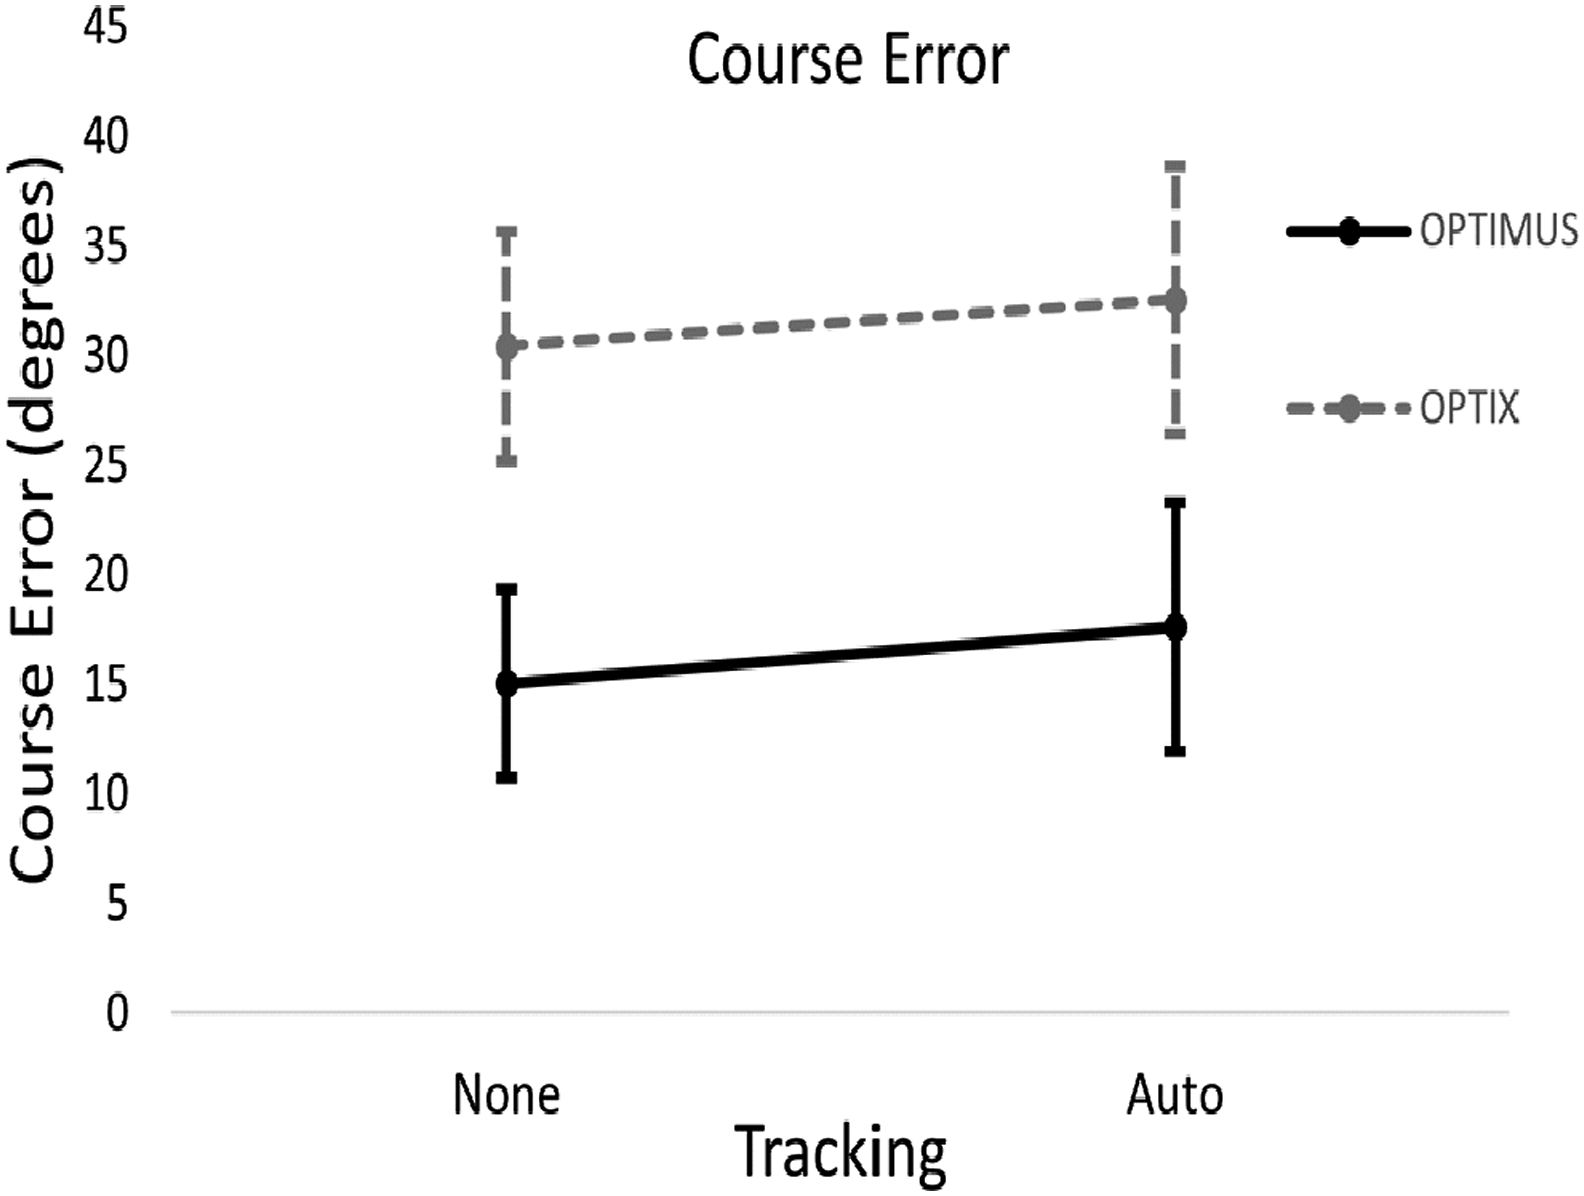
Range and Course Estimate Speed
A Bayesian ANOVA on solution time by Prototype and Tracking preferred the null model (posterior probability = .544). Consistent with Figure 13, there was uncertain evidence for or against the main effect of Prototype (BF01 = 2.3), and strong evidence against the inclusion of Tracking (BF01 = 12.69) and the interaction (BF01 = 42.79). Time to generate solutions (in seconds) for each digital periscope prototype for auto-tracking present and not present. Error bars represent the 95% Credible Interval around the mean. Note, there may be noise in the measurement if participants operate contrary to the order instructed (e.g. computing a solution before classifying all contacts). Increased error bars may reflect violations of this behaviour by some participants.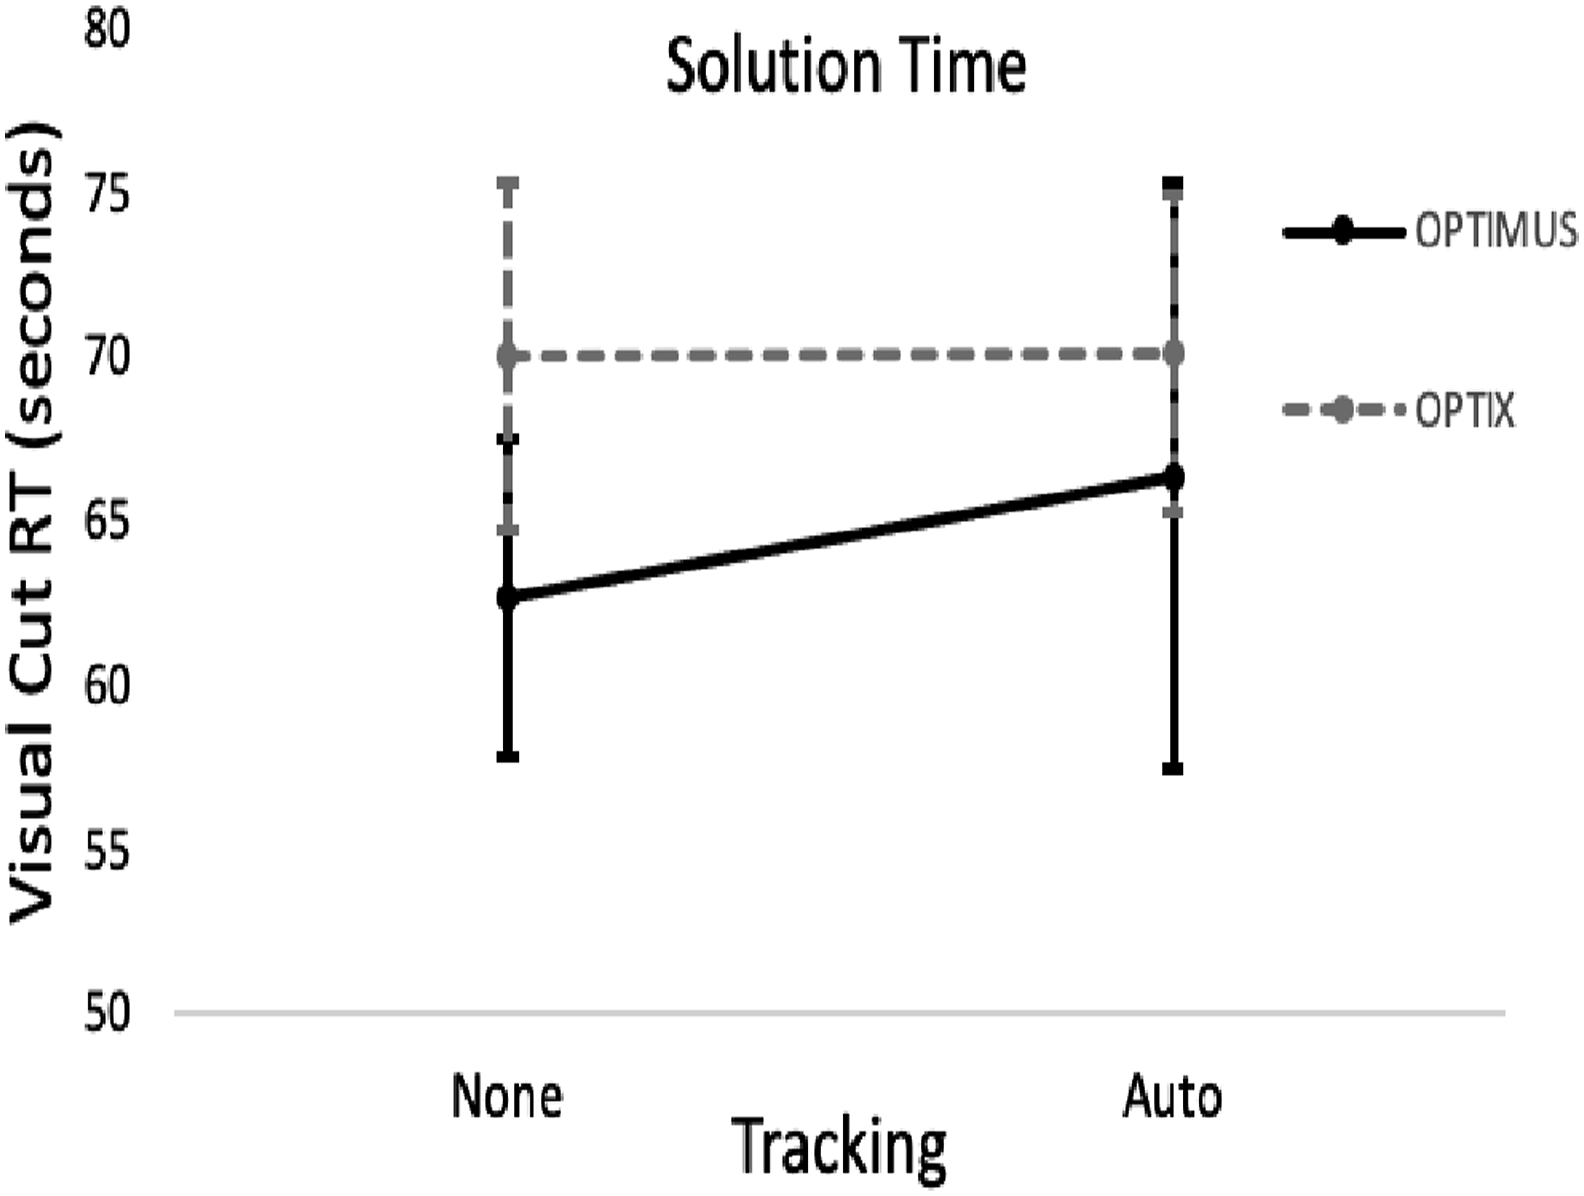
Perceived Workload and Usability
The MCH ratings for each digital periscope prototype was collected separately as a function of the presence/absence of auto-tracking, A Bayesian ANOVA on MCH rating by Prototype and Tracking preferred the model including both main effects (posterior probability = .538). There was very strong evidence for the inclusion of Prototype (BF10 > 1000), but uncertain evidence for the inclusion of Tracking (BF10 = 1.72). MCH ratings were lower for OPTIMUS than OPTIX, and lower when auto-tracking was present compared to absent (Figure 14). The SUS ratings were collected once for each prototype (i.e. collapsed across presence/absence of auto-tracking). Three participants failed to complete a question, and thus SUS scores for these participants were rescaled as per Experiment 1. A Bayesian paired-samples t test showed weak evidence that OPTIMUS (M = 78.91, 95% CI [70.93, 86.87]) was rated as more useable than OPTIX (M = 61.64, 95% CI [51.33, 71.96], BF10 = 4.18). Mean MCH ratings by Prototype and auto-tracking. Error bars represent the 95% Credible Interval around the mean.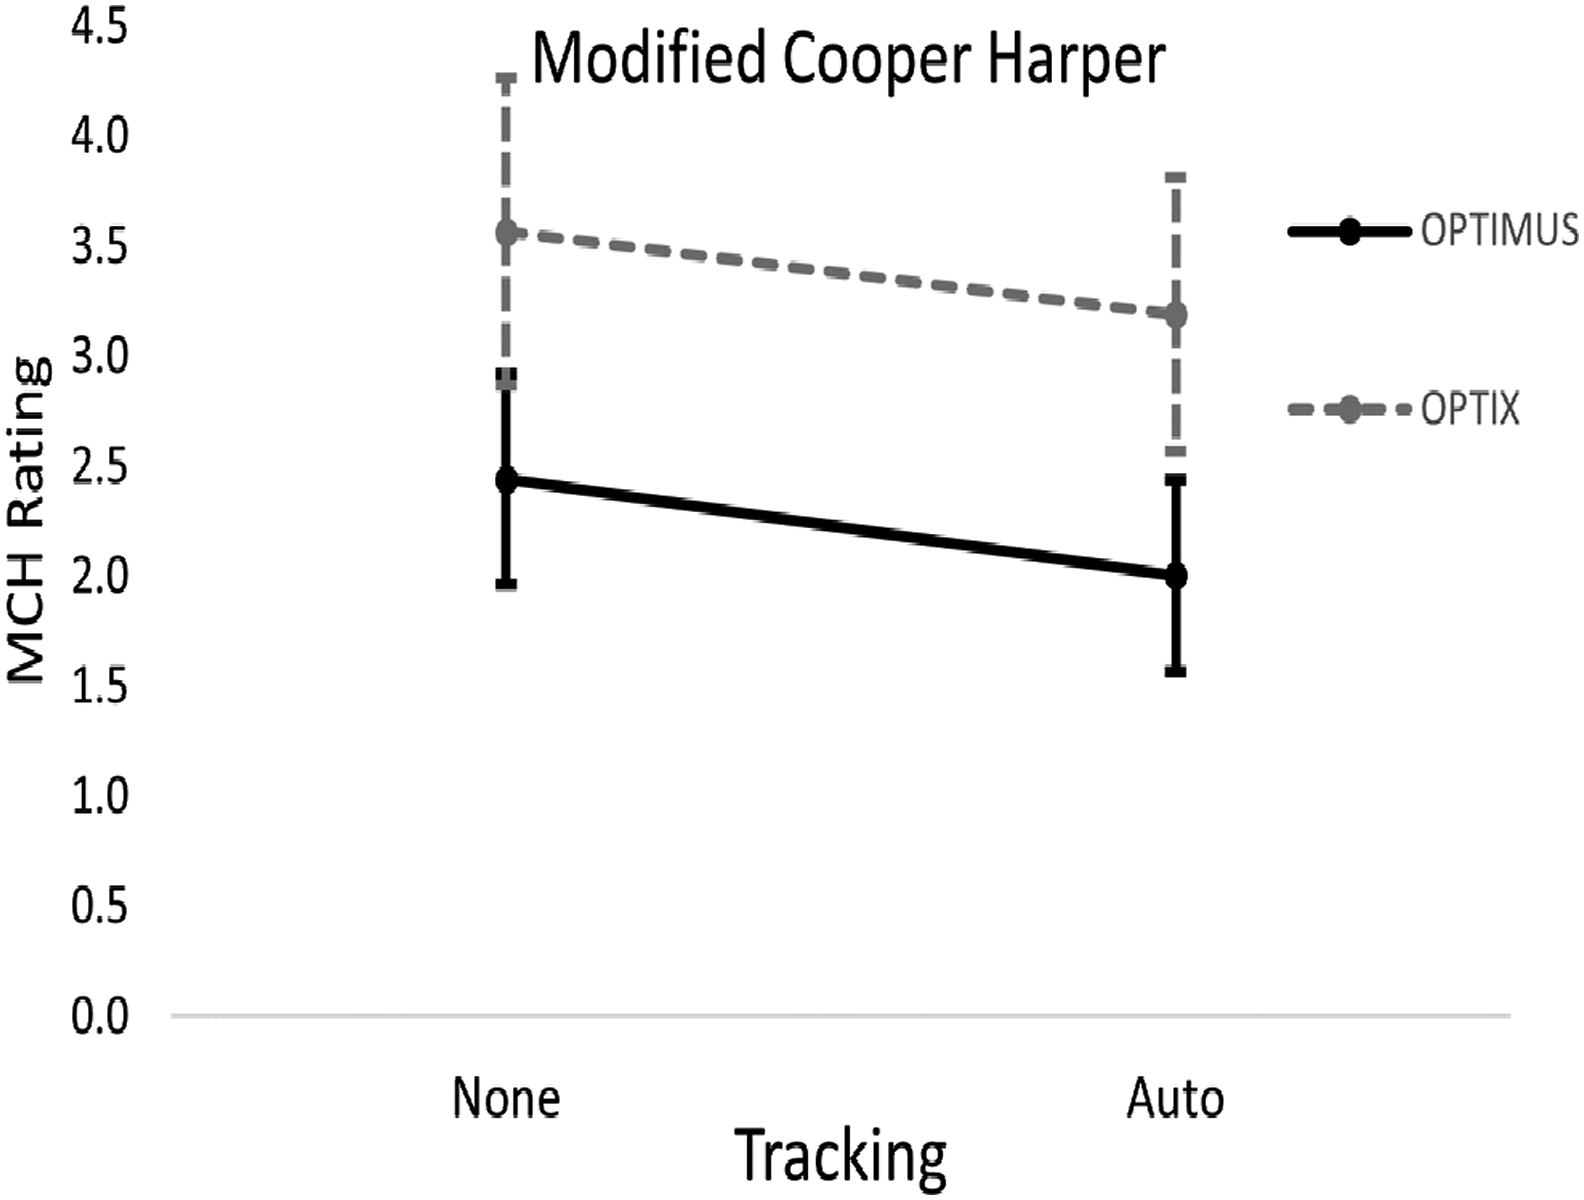
Discussion
Experiment 2 compared contact classification, range, and course estimation between a digital periscope prototype (OPTIMUS) that provided digital tools to assist with range and course estimation, and a digital periscope prototype (OPTIX) that provided limited decision aids in keeping with legacy (conventional) non-digital periscopes. Range and course estimates were approximately 2x better when using OPTIMUS compared to OPTIX. However, no reliable evidence was found that digital periscope prototype impacted the time taken to make these estimates (i.e. solution time). This suggests that the digital tools improved the efficiency of evaluating contact behaviour (as participants generated more accurate solutions in comparable time-frames). In addition, participants perceived workload to be lower when using OPTIMUS compared with OPTIX. There were no differences in classification accuracy across the digital periscope prototypes, suggesting that advantages in range and course estimation in OPTIMUS cannot be attributed to any differences in classification accuracy. In fact, participants took longer to classify contacts when using OPTIMUS. Although the classification tools themselves were identical apart from minor location changes, this may reflect a potentially greater number of clicks to navigate to the OPTIMUS classification panel.
Auto-tracking was not found to provide reliable advantage to any outcome variable for either digital periscope prototype for the tasks we assessed. This outcome may be dependent on the fact that contacts moved relatively slowly and were highly visible. Tracking faster-moving contacts (particularly when closer to Ownship) and less-visible contacts would potentially benefit more from reliable auto-tracking. These possibilities warrant further investigation.
General Discussion
Modern photonics masts offer a 360° field of view and enable digital tools to aid submarine periscope operators in detecting and tracking the behaviour of contacts. However, questions remain regarding whether the potential benefits might be outweighed by the burden that 360° field of view and/or digital tools place on the human perceptual and cognitive systems. To address this, the current studies compared the impact of a digital prototype of a legacy (conventional) periscope with an alternative digital periscope prototype that displayed a larger (360°) field of view (Experiment 1), and that provided digital analysis tools for contact range and course estimation (Experiment 2). The impact of increasing the periscope field of view on contact detection (Experiment 1) and the impact of providing digital tools on estimating contact range and course (Experiment 2) were separately examined. Both experiments also assessed the impact of each digital periscope prototypes on perceived workload and system usability.
Contact Detection
In Experiment 1, contact detection was faster in OPTIMUS than OPTIX. This indicates that although the physical size of contacts on the display was equal (at high magnification) or smaller (at low magnification) in OPTIMUS, providing a 360° field of view speeded contact detection compared to a narrow rotatable field of view in OPTIX. There was no evidence that OPTIMUS negatively impacted perceived workload or system usability.
Overall, the results suggest that a larger field of view could allow operators to more efficiently allocate attention to contacts, and that the additional information in these displays does not constrain the human perceptual or cognitive system. That said, factors such as near sea-surface atmospheric conditions, weather, and lighting (e.g. time of day) impact the visibility and salience of contacts and thus visual search performance (Hogervorst et al., 2013). Thus, future research should examine the extent to which larger field of view displays, like those presented in OPTIMUS, remain superior under reduced visibility conditions.
One possibility, suggested by our results, is to train operators on hybrid magnification search techniques, thus ensuring the continued search advantage of the OPTIMUS panorama view (e.g. the most salient contacts are acknowledged first, then a high magnification serial search pattern is performed to detect less immediately salient contacts). This strategy maps well to theoretical accounts of guided visual attention (Wolfe, 2021) and can help overcome performance decrements when magnification was not available for the larger field of view system. The OPTIMUS hybrid magnification search strategy provides all the benefits of immediate/automatic attention strategies and facilitates the same serial/guided search as conventional periscopes while maintaining the panoramic view in peripheral vision. In addition, any future research with experts could potentially not provide specific search strategy instructions (i.e. magnification use) and instead examine how experts develop and use their own search strategies. Multiple effective strategies may be identified based on prototype design and operational conditions.
Having the entire 360° field of view presented on one monitor (i.e. OPTIMUS upper monitor) could have other untested (unintended) consequences, especially over long submariner shifts or shifts with varied workload. It is possible that fatigue or perceived workload could impact viewing strategies such that operators preferentially monitor panels (rows) of the 360° field of view more easily accessed with manual mouse inputs (i.e. reducing information access costs; e.g. Fu & Gray, 2006; Senders, 1983). Having expert periscope operators participate in follow-on research would be valuable to explore such potential issues and opportunities. For example, experts may want the option to be able to rearrange the multiple panels (rows) presented on OPTIMUS upper monitor as a function of operational demands/context (e.g. putting one panel of special interest near the bottom of the monitor to be more accessible).
Digital Tool Support
In Experiment 2, high classification accuracy was found, but participants took longer to classify contacts when using OPTIMUS, potentially due to needing at least an extra mouse click to access the classification panel if it was located behind the angle-on-the-bow/ranging tool (a practical requirement borne of needing extra screen space to display a magnified image of the selected contact in the panorama).
OPTIMUS, which provided participants a suite of digital tools that might be plausible in future digital periscope systems, resulted in benefits to range and course estimate accuracy, with smaller error (approximately halved) compared to OPTIX. This likely stems from the provision of 3D digital models of contact types, enabling operators to use a feature-matching comparison to estimate contact range and course. For ranging, this meant participants could match the features on the model they chose to anchor digital ranging lines with the identical features on the detected contact. Previous research has shown that matching to a known sample produces finer/more accurate estimates than making absolute judgements of a single visual object (Bell et al., 2013). With respect to course estimates, previous studies suggest that 3D representations can improve perceptual accuracy relative to 2D representations like those that were used in OPTIX (Bell et al., 2015). Further, there was no need to consider actual heights or mentally subtract or add these heights under some viewing conditions to calculate the range in OPTIMUS. Indeed, participants reported lower workload when using OPTIMUS, suggesting the 3D models made it easier to estimate contact range and course.
Although Experiment 2 suggests clear performance advantages arise from digital tool use in the short term, this decision support could come at a cost, including complacency and associated loss of situation awareness (Parasuraman & Manzey, 2010) or skill degradation (Casner et al., 2014). For example, in the longer term, matching moveable lines in the viewing window with the 3D tool, with little to no reference to the physical height of the contacts themselves may interfere with the development of operator expertise. With current systems, operators become increasingly familiar with the heights of certain features of contacts which can facilitate efficient range estimates for familiar contacts and serve as an anchor to estimate the range of less familiar contacts. In the absence of this experience, operators may become reliant on the digital periscope tools, impairing their ability to detect potential errors or failures in digital tool operation, and unable to efficiently estimate contact range and course without the tools operating reliably. Thus, digital tools, like those in OPTIMUS, could provide performance benefits, but future research should examine potential costs under various operational conditions.
Study Limitations
This study used a medium-fidelity simulation with imagery quality and contact models matched across the two digital periscope prototypes. As noted earlier, one limitation is the near-ideal visibility and sea state conditions. The contrast between contacts and their surroundings is often much lower in operational contexts (e.g. when sea state, weather or lighting conditions are poorer). Such conditions would likely increase visual clutter and reduce target salience, thus impairing search efficiency (Duncan & Humphreys, 1989; Liesefeld et al., 2016). In addition, the visual scenes in the digital periscope prototypes were relatively sparse with low contact similarity and density. If contact similarity were higher (i.e. more similar contacts) and density were increased (i.e. more adjacent contacts with similar features), the search advantages afforded by larger field of view might decrease. On the other hand, to the extent that operators could continue to function efficiently under these kinds of sub-optimal viewing conditions, digital tools like those in OPTIMUS might be even more useful than demonstrated in our research.
Another limitation of our work is that the impact of increased field of view and digital tools were examined separately in order to avoid confounding their effects on performance. In reality, operators continue to monitor the periscope for contacts even whilst analysis is undertaken on a priority basis, and the various types of periscope operator tasking overlap and are interdependent. Thus, there is a need to replicate this work under simulated conditions more akin to operational conditions and with participants undertaking tasking that more realistically aligns with that of an actual periscope watchkeeper.
Additional work is needed to examine the impact of digital periscope prototypes on situation awareness. Although contact detection and analysis tasks may benefit from advances in photonics masts and associated digitized displays, as discussed earlier, there may be a cost to situation awareness arising from dependence on digital tools akin to those arising from dependence on automation (Onnasch et al., 2014). More generally, the conventional periscope operator’s physical movement to manipulate eyepieces and handles to change viewpoint could help to maintain situation awareness of each contact’s location relative to Ownship. In other words, the sensory/proprioceptive cues involved in movement may be important for localizing contacts, cues that would be absent when a 360° view is depicted on a single monitor with a seated operator.
Conclusion
This study demonstrated the potential performance advantage afforded by a digitally supported panoramic field of view and digital analysis tools, compared to digitizing the single, narrow field of view used in conventional periscope technologies. The OPTIMUS digital periscope prototype, in providing a larger field of view for potential human perception advantage such as pop-out effects, and providing digital tools matched to operator work strategies, showed robust advantages for contact detection (Experiment 1), and range and course estimation (Experiment 2). Our work demonstrates the potential benefits of considering psychological insights into human perception and cognition in designing future digital periscope prototypes that optimize the relationship between human capability and new technology, rather than applying new technology to legacy (conventional) work systems by default (for discussion see Roberts et al., 2021; Stanton & Roberts, 2020). This general approach is potentially applicable to other related work systems that require object/event detection and analysis such as airport security screening (Wolfe & Horowitz, 2004), radiological screening (Clark et al., 2014), and uninhabited aerial systems image analysis (Abich et al., 2017). There is potential also to use other technological options to support the periscope operator such as an augmented reality interface. However, future research will need to consider the more complex operational conditions in which digital periscopes must function effectively as well as the potential costs of a digitally supported panoramic field of views such as operator complacency and skill degradation.
Footnotes
Declaration of Conflicting Interests
The author(s) declared no potential conflicts of interest with respect to the research, authorship, and/or publication of this article.
Funding
The author(s) disclosed receipt of the following financial support for the research, authorship, and/or publication of this article: This work was supported by the Research Grant (MyIP 9277) from the Defence Science and Technology Group, Australia awarded to Loft, Michailovs, Visser, Bell, and Pinniger.
Data Availability Statement
The data that support the findings of this study are available from the corresponding author, [SL], upon reasonable request.