
Abstract
Introduction
The human body consists of 206 bones, which play a vital role in providing support for movement by connecting to the muscles. Within the fibrous tissue of bone ligaments, there is spongy bone marrow. The development of bone cancer begins when healthy bone cells undergo a transformation, becoming malignant. 1 In most cases of bone cancer, tumors in the bone serve as the primary symptom. These tumors tend to grow slowly and can potentially spread to other parts of the body. As a result, bone tissue can become compromised, leading to increased fragility in the bones. In 2018, there were 3600 newly diagnosed cases of bone cancer in the United States, with approximately 48% of patients succumbing to the disease.
Cancer is diagnosed through a series of comprehensive tests conducted by doctors. In the early stages of bone cancer detection, X-ray imaging diagnostics are commonly employed. Cancerous bone exhibits a distinct surface appearance on X-ray images due to variations in X-ray absorption compared to healthy bone.2-6 The severity of bone cancer is characterized by its stage and grade. To assess the progression of the disease, doctors calculate the growth rate of tumors, which reflects the extent of bone destruction. Accurate diagnosis of bone cancer requires substantial medical expertise. It is a time-consuming process and leaves room for potential errors in the doctor’s assessment.
Improving the survival rates of cancer patients can be achieved through various methods, with early detection being of utmost importance. This study presents a system that utilizes the support vector machine (SVM) method in image processing to identify tumors and classify malignancies. Previous research has successfully employed similar techniques to develop automated systems assisting medical practitioners. Automated machinery offers speed and reliability in this context. The growth of an automated system involved preprocessing, side identification, and feature extraction, all accomplished through the utilization of an SVM and a digital snapshot processing technique.7-10 In the aforementioned study, a fully automated approach for prognosing human bone conditions was established. This involved employing a neural network with a deep learning architecture to categorize bones as healthy or fractured.11-14 The model demonstrated proficiency with a large and enhanced image dataset. The augmentation system created images that closely resembled those in the training and testing datasets, ensuring avoidance of bias in overall performance. To maintain fairness, k-fold cross-validation could be implemented.
Asuntha and Srinivasan 15 employed the GLCM function for bone fracture detection. However, their results indicated that using GLCM as the sole textural feature is insufficient for reliable identification of malignant bone. The prediction of cancer hotspots is significantly influenced by entropy and skewness. High costs of entropy are observed outside the cancerous area, whereas within it, the cost is minimal. The hog feature in images provides pixel outlines and directions. In our approach, we combine multiple methods and textural cues to accurately identify and label both malignant and healthy bone. SVM is utilized to categorize long bones, particularly focusing on cancer-free bone regions. A strategy has been developed to distinguish bone cancer in MR images using mean pixel power, achieving an 85% performance, which can be further improved.16-19 Sharma et al. 20 utilized MRI images to differentiate between cancerous and noncancerous tissue. They employed a texture feature extraction and clustering method based on the -method to separate the tumor into its constituent parts. By removing the tumor component, the overall range of pixel intensity can be calculated to obtain an approximate estimate of the tumor’s pixel value. Tumor growth is detected by calculating the average pixel value. If the median pixel value exceeds the threshold, the condition is classified as malignant.
Alférez et al. 21 propose an alternative strategy for segmenting brain tumors utilizing fuzzy-based and approach algorithms. Reddy et al. 22 introduced a distinctive method for differentiating tumor size from bone malignancy stage using evolved region computation. This method employed the place-evolved computation to delineate the region of interest. The number of pixels within the extracted tumor area serves as a reliable indicator of tumor size. However, precise prediction is challenging due to the dependence on the snapshot and the variability of the seed point’s absolute pixel value at the tumor level.
Tiwari et al. 23 have employed MRI images for the detection and staging of bone cancer. They implemented a denoising technique to remove noise by clustering pixels based on shared features. The severity of cancer is predicted using the fee 245 and suggested pixel depth. A region of interest (ROI) is extracted from the image and compared to a threshold value to estimate the tumor size. Similarly, Dash et al. 24 proposed a method to calculate the total number of tumors associated with a specific disease. Their approach involves segmenting the ROI within the malignant region, which aids in estimating tumor size. To address the identification of bone cancerous growth, Rupert et al. 25 developed a novel approach based on clustering principles and a growth popularity metric for cluster boundaries. Sobel edge detection was employed with a defined cutoff value. The tumor area is isolated by applying a clustering computation exclusively to the border pixels identified by the Sobel edge locator. Jabber et al. 26 have also developed similar methods for detecting bone cancer in MRI images using medical image processing techniques. Their suggested preprocessing procedures involve noise removal and clutter reduction using the Gabor filter. Superpixel segmentation and multilevel segmentation are utilized for effective segmentation. Following filtering, edge identification and morphological processes are applied. Important image features can be extracted after the finalization of superpixel segmentation at the 2D level.27-30 These derived features are then utilized for bone cancer identification. Shrivastava et al. 31 have conducted ongoing research on fundamental therapeutic approaches. Their publication focuses on standardizing the release of potentially harmful stem or progenitor cells. These studies have demonstrated the importance of considering abnormalities in bone marrow. These approaches have the potential for scalability, enabling the generation and isolation of new problem-solving methods.
Bone cancer is a devastating disease that claims numerous lives each year. Early detection and classification systems are essential for diagnosing most malignancies at an early stage. Early identification is considered the most significant predictor of survival in most cancer cases. The scientific diagnosis of cancer is a challenging and complex process. In this study, we present a system that utilizes image processing methods for the detection and categorization of cancerous growths. This approach significantly reduces the time required for identification and classification of most malignancies. Jermyn et al. 32 employed image processing methods to enhance contrast in cancer images, allowing for focused examination of specific details. The edge detection method has been successfully implemented. In our research, we propose a rapid and reliable model for identifying bone cancer cells. Courneya et al. 33 identified tumors as a significant health concern and developed a system to assess the prevalence of bone diseases. Their prediction system, utilizing MATLAB-based exploratory connection and execution,34-38 predicts the rate of cancerous growth in the past decade. They enhanced a clustering technique based on graph cuts to differentiate between malignant and healthy cells. Differentiating between bone cancer and healthy bones has been an ongoing challenge, but these researchers have devised a method that utilizes multiclass irregular texture in the latest survey to quantitatively distinguish between the two. The studies incorporate a bone CT dataset captured using the digital imaging and communications in medicine (DICOM) system.
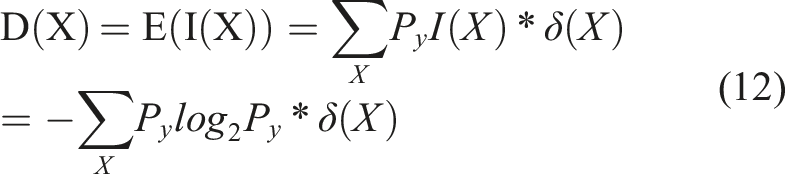
This study focuses on the utilization of cutting-edge AI techniques for organizing and ensuring the accuracy of tumor assessment. Clinical image processing, as a subfield of artificial intelligence (AI), plays a vital role in medical diagnostics. Image processing has simplified the diagnosis of various medical conditions, such as ulcers, car accidents, and tumors. Artificial intelligence methods are employed to enhance images and identify abnormalities. Notably, significant progress has been made through the application of machine learning techniques. This paper explores different AI clustering methods, emphasizing the use of segmentation tactics to optimize results. The model is trained using extracted texture and shape features, with a focus on selecting appropriate functions and employing diverse function-optimization approaches to enhance model performance. Rigorous testing is conducted to identify unique textural and geometric attributes to be incorporated into the proposed methodology. These capabilities enable precise differentiation between healthy bone and malignant bone. Detecting bone cancer requires the consideration of various factors responsible for the development of bone cancers, such as bone density, color, and texture. Several studies have provided guidance on bone cancer detection, emphasizing the extraction of relevant features to achieve accurate segmentation and locate the central part of the bone. Machine learning techniques are crucial for identifying these features and distinguishing between healthy and malignant bone. The current research evaluates the region of interest (ROI) using various segmentation techniques, including Canny, Prewitt, and Sobel. Additional sets of features, namely “HOG,” “Entropy,” “Energy,” “Gini Index,” “Skewness,” “Comparison,” “Correlation,” and “Homogeneity” (derived from E(X) and D(X) respectively), are analyzed to demonstrate different patterns. Finally, these features are utilized to compare the effectiveness of Random Forest and Support Vector Machine (SVM) models. The SVM outperforms Random Forest due to the inclusion of the feature set “HOG, Entropy, Energy, Gini Index, Skewness, Comparison, Correlation, Homogeneity constructed from E(X) and D(X),” resulting in superior outcomes.
The paper presents several key contributions that enhance the classification performance of diagnosing human bone images, even with limited datasets, employing multiple methods to differentiate between malignant and healthy bone images. Data augmentation is one such method, which involves applying various modifications such as rotations, flips, scaling, and translations to the original dataset. This augmentation expands the training data, enabling the model to generalize better to new scenarios. Transfer learning is another powerful approach that leverages models pre-trained on large datasets like ImageNet. By fine-tuning the last few layers or adding new layers on top of the pre-trained model using a smaller dataset specific to human bone images, the model benefits from the knowledge learned from the larger dataset, leading to significant performance improvements. Regularization techniques, such as L1 or L2 regularization, dropout, and batch normalization, are employed to mitigate overfitting and enhance generalization. These methods reduce noise and irrelevant features in the training data, allowing the model to better generalize to unseen data. Cross-validation is utilized to assess model performance and fine-tune hyperparameters. By dividing the data into multiple groups and training the model on different combinations, its resilience and effectiveness on unknown data can be tested. Ensemble learning combines predictions from different models to improve accuracy and robustness. Building an ensemble of models using techniques like bagging, boosting, or stacking can enhance classification performance. In the study, Support Vector Machine (SVM) and Random Forest, two machine learning techniques, were compared using various predefined feature sets. SVM emerged as the most effective method for human bone diagnostics. By considering these methods, an effective and reliable classification model for human bone imaging diagnosis can be developed. The proposed method exhibits enhanced sensitivity towards malignant bone, making it a valuable complementary tool for medical professionals to gain additional perspectives in their assessments.
Methodology
The approach is depicted in Figure 1. The system accepts an X-ray image as input, facilitating rapid and cost-effective diagnosis. Different types of images after processing.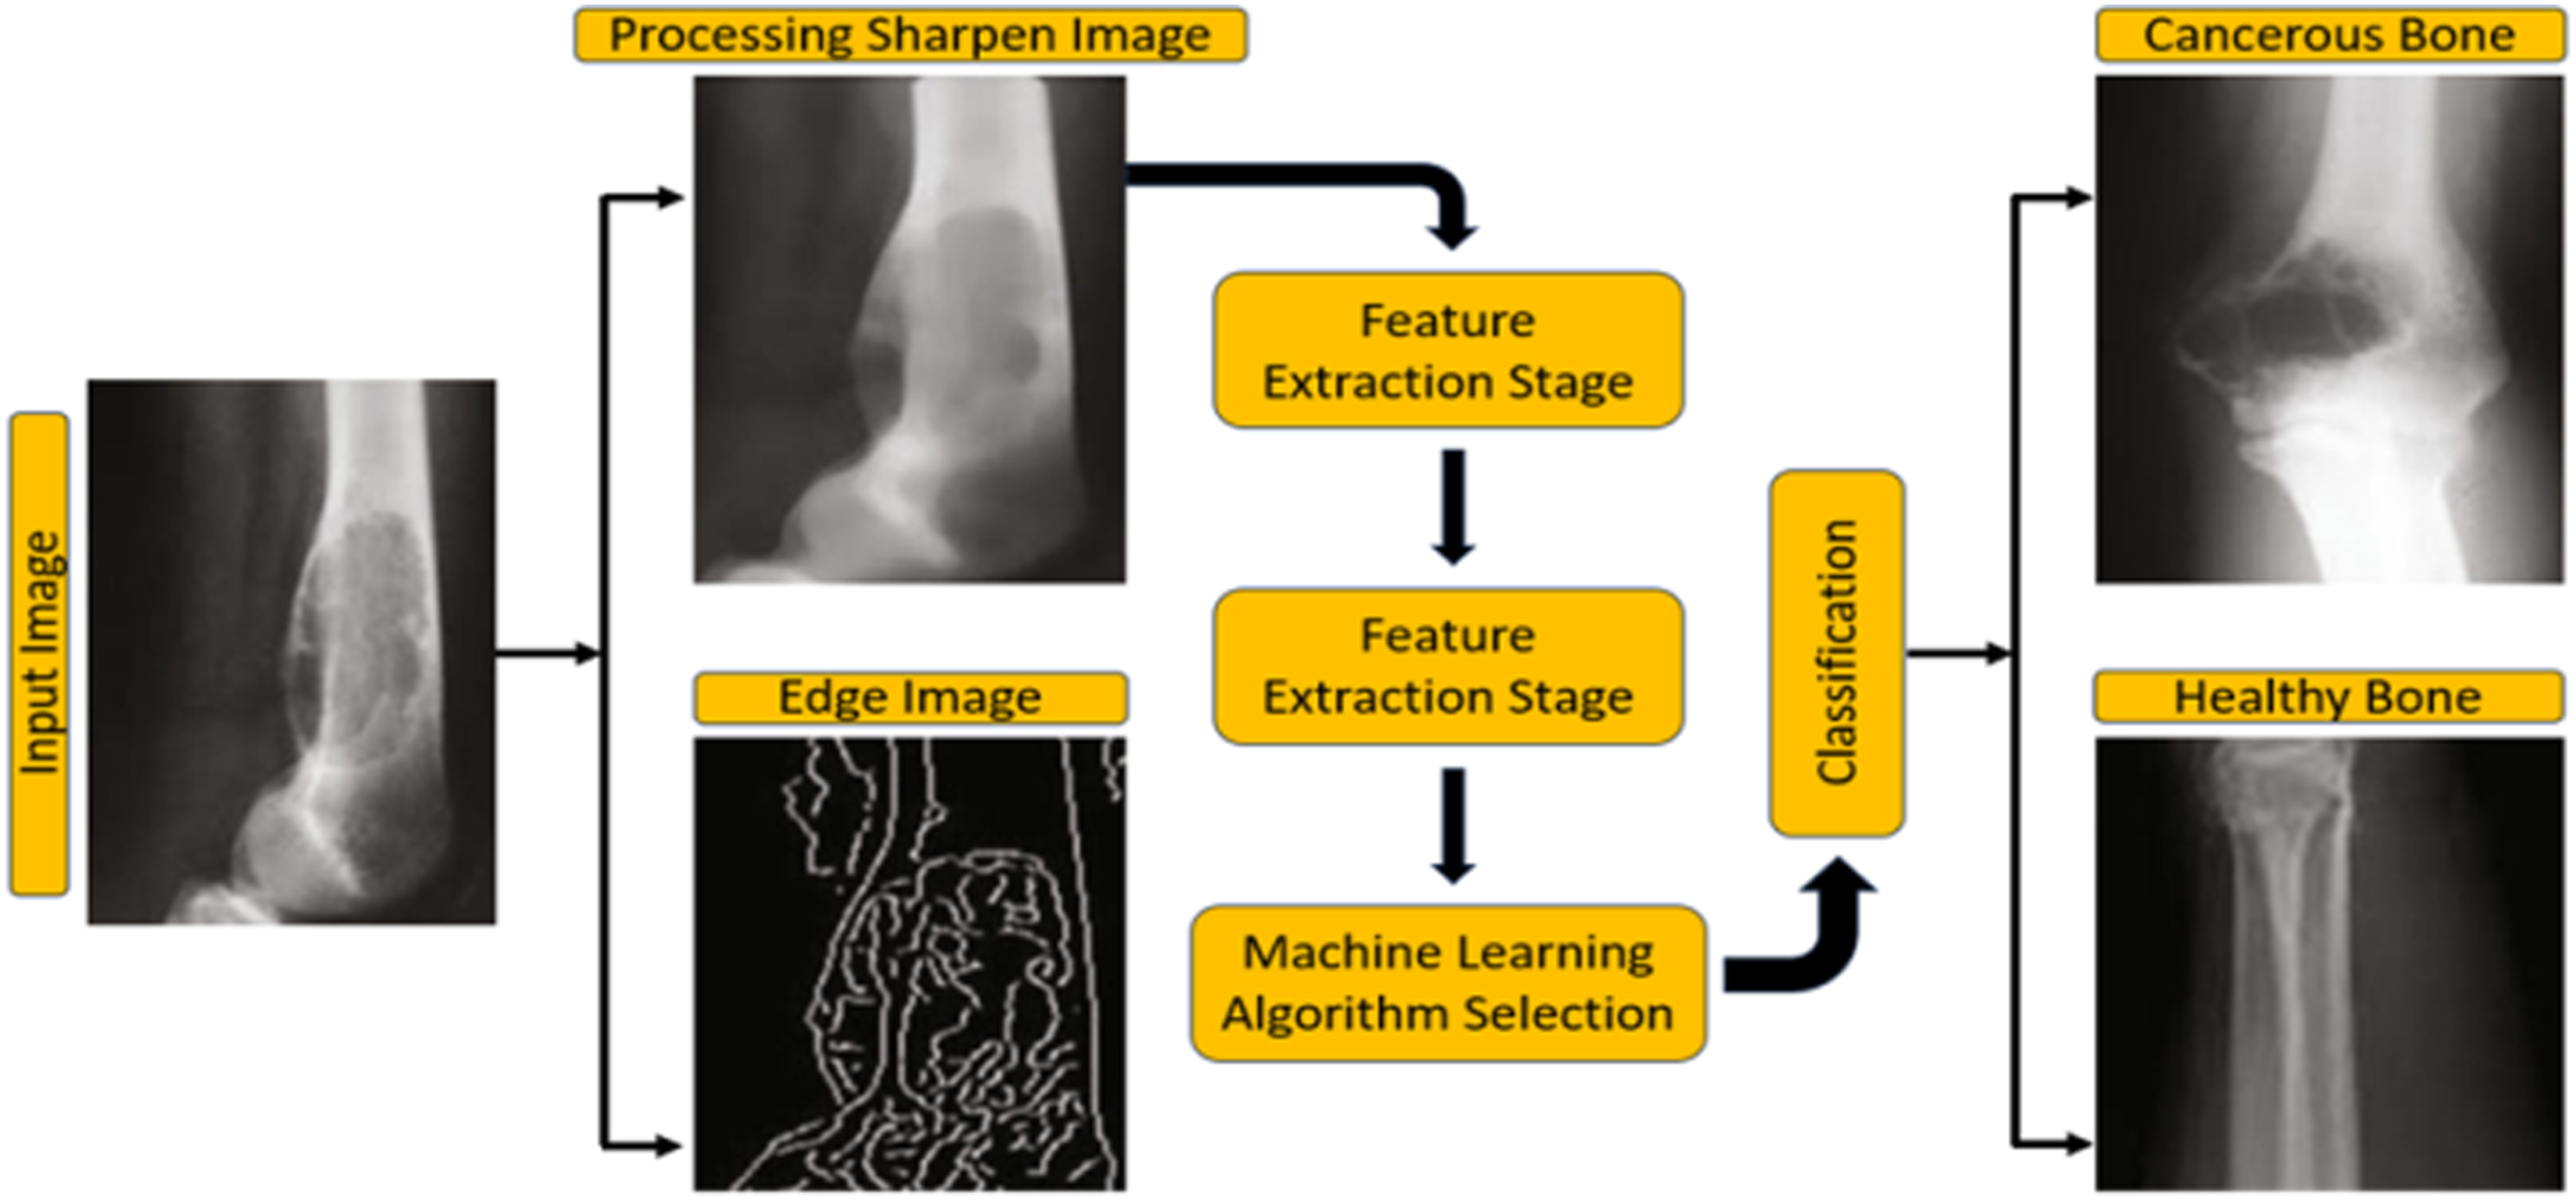
Preprocessing
The X-ray image may appear blurry. Therefore, enhancing the image sharpness enhances its perceived brightness.
Image Segmentation
The initial step in defining objects is the segmentation of the image. The reliability of the segmentation process directly affects its overall accuracy, making it crucial and beneficial for object identification. To facilitate the segmentation process and gather data from objects, the image is initially divided into pixels. In this research, the Canny algorithm was employed to categorize the images. The Canny edge detection technique was chosen as it produces sharper edges compared to Sobel and Prewitt, thereby maximizing the return on investment. However, it is important to note that this research has certain limitations due to the restricted dataset. Additionally, it should be noted that the effectiveness of Canny edges diminishes as the dataset size increases.
34
These differences are illustrated in Figure 2. Different types of Sobel based images after processing.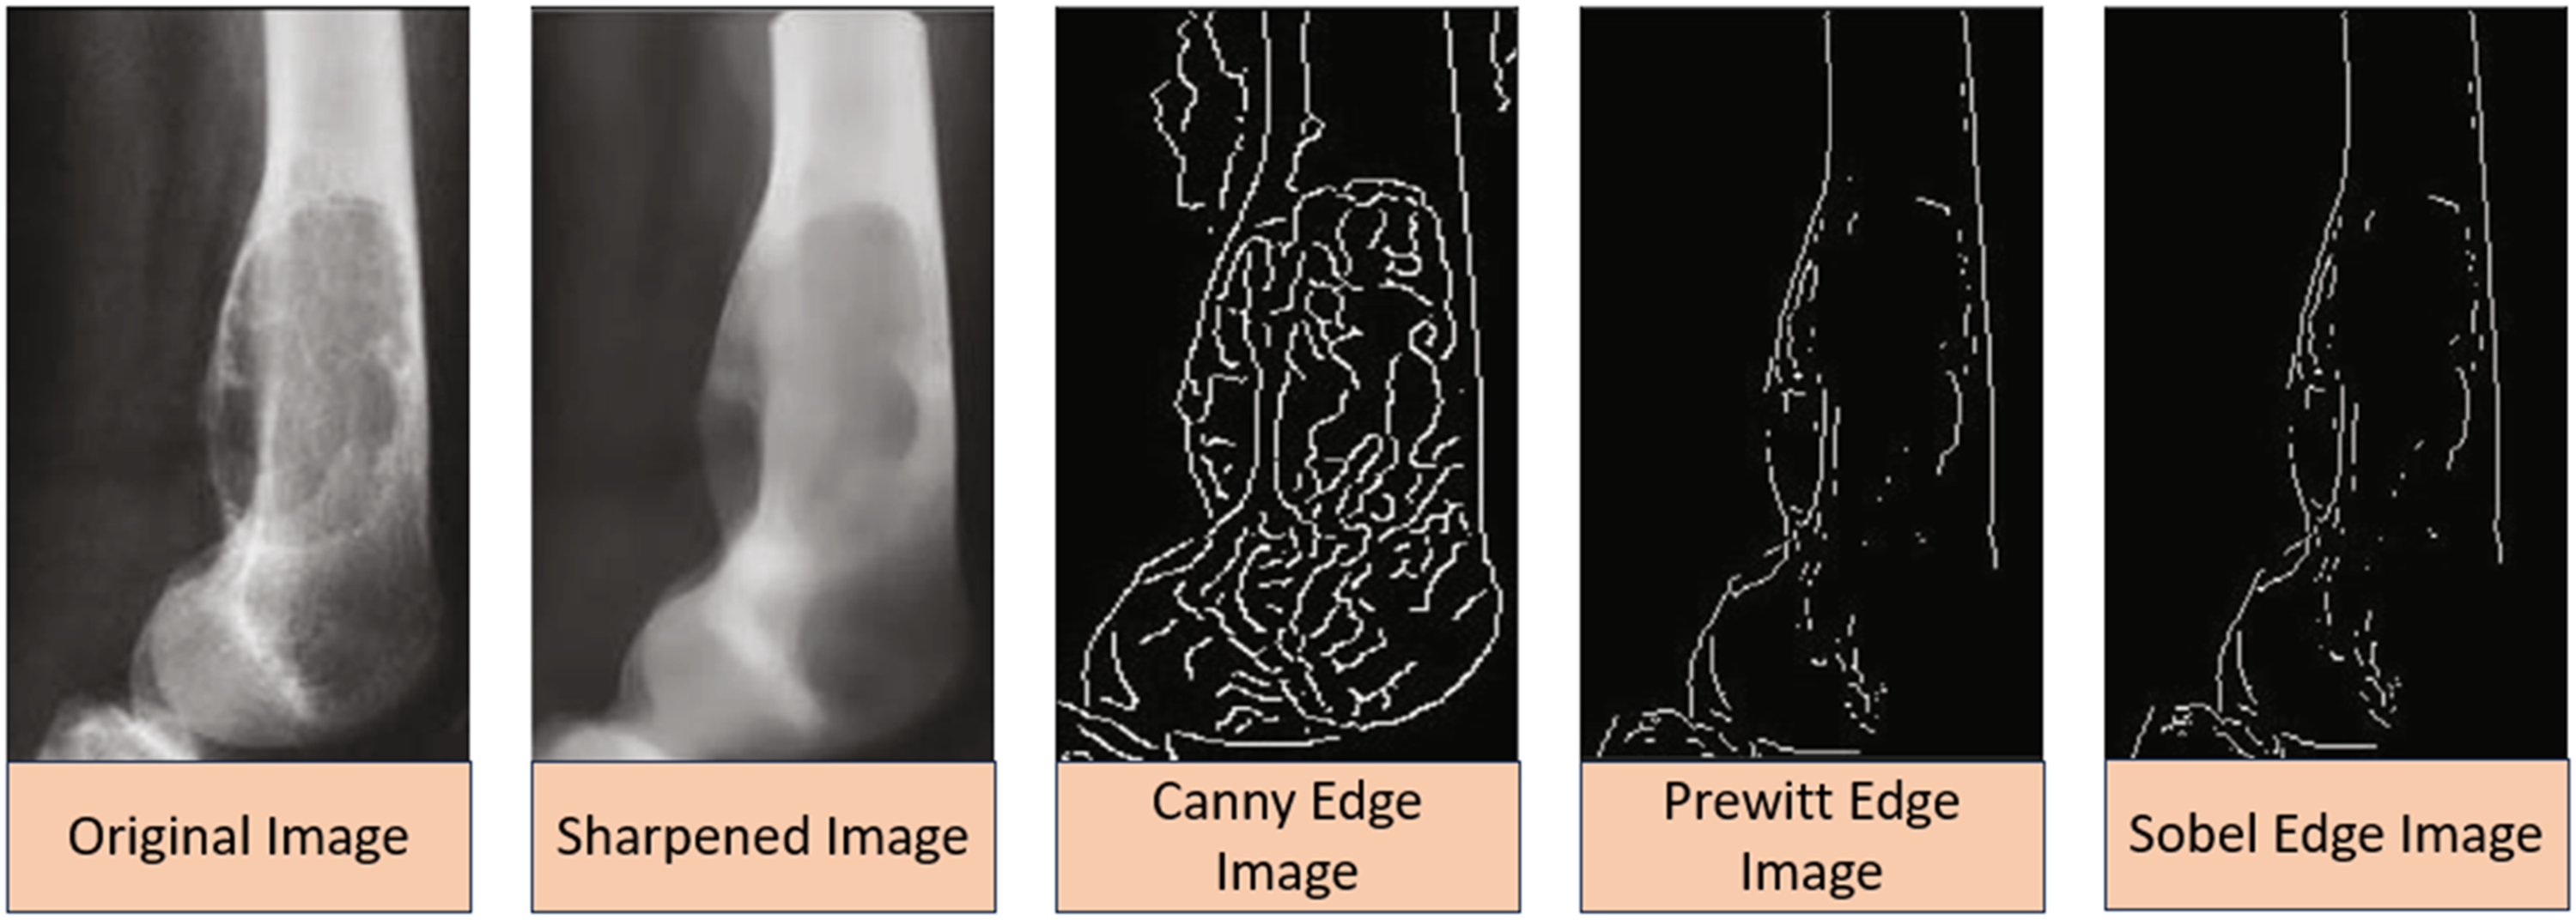
Feature Extraction
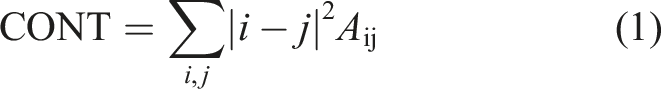
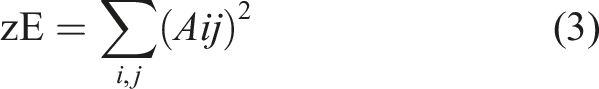
The texture descriptors initially proposed by Hall-Beyer have undergone continuous refinement. In Haralick’s description, a pair of pixel events is identified from each element (i, j) of the GLCM matrix A. 39 By quantifying the variations in the fragmented image, four specific texture parameters are calculated: entropy, contrast, energy, and homogeneity.
Contrast: Indicates the level of variation in the image, specifically the difference between the highest and lowest intensities observed horizontally.
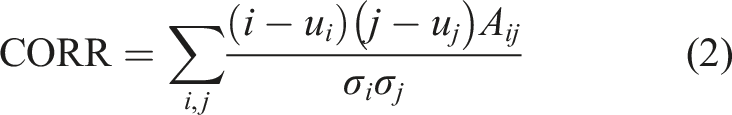
Consistency: Quantifies the degree of similarity between neighboring pixels throughout the entire image.
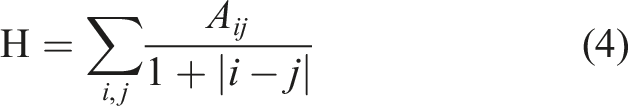
Homogeneity is a statistical measure that quantifies the level of uniformity or smoothness in a given image or dataset.
40
It provides information about the similarity or variation in neighboring segments or regions within the image. In image analysis, homogeneity is commonly used to assess the texture or contrast within different parts of an image. A higher homogeneity value indicates that adjacent pixels or segments have similar intensity values, resulting in a smoother and more uniform appearance. Conversely, a lower homogeneity value suggests greater variation and contrast between neighboring regions. The calculation of homogeneity can vary depending on the specific context or algorithm employed. One approach involves computing local variances or differences between adjacent pixels or segments and then aggregating these values to derive a measure of homogeneity. The interpretation of homogeneity is subjective and relies on the particular application or image analysis task. For instance, in medical imaging, high homogeneity in certain regions may indicate homogeneous tissues, while low homogeneity could signify irregularities or anomalies. It is important to note that different image processing techniques or algorithms may have their own distinct measures or definitions of homogeneity. Thus, the exact calculation and interpretation of homogeneity may vary depending on the specific context in which it is utilized.
Skewness is a statistical measure that assesses the asymmetry of a probability distribution. In image analysis, it can be employed to evaluate the orientation of pixel intensities. Skewness is calculated using the Fisher-Pearson coefficient of skewness formula: Sk = (3 * (mean - median))/standard deviation. Positive skewness (Sk > 0) indicates a tail skewed towards higher values, whereas negative skewness (Sk < 0) suggests a tail skewed towards lower values. A skewness value of zero indicates a symmetric distribution. It is important to note that this formula assumes a Gaussian distribution, and preprocessing of image data may be necessary to obtain accurate results.
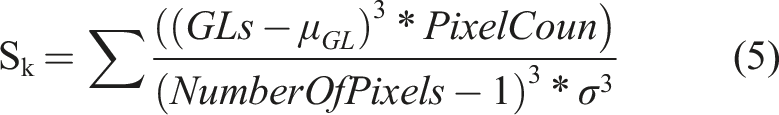
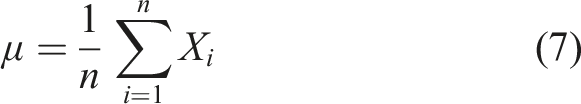
In the formula,
The discrepancy is influenced not only by the number of farm servers positioned outside and on the left side of the model but also by the distance between them. When there are numerous lights in close proximity to the left side of the model, it may not significantly impact the lights on the main side. However, as the distance increases, it gradually becomes more apparent, resulting in a concentration of positive distortions towards the left.
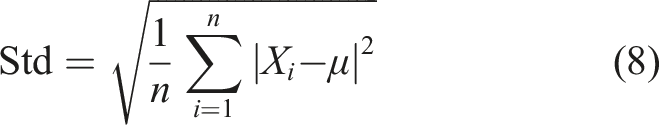
The variance is defined as follows
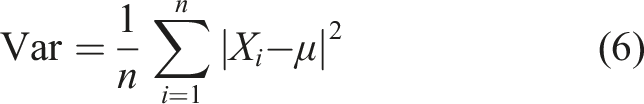
The standard deviation is determined by calculating the square root of the variance. It is mathematically defined as follows:
Entropy: Predicting the extent of cancerous bone growth poses significant challenges. To address the categorization task, balanced Shannon entropy is employed. Shannon entropy has been widely utilized by experts to tackle similar challenges. In this study, the image is resized to 70 × 70 pixels based on the results of various planning activities and tests. Additionally, the image is rotated by 35° in this particular scenario.

The energy levels in the bone marrow are relatively low. Conversely, the entropy level is high on the non-cancerous side of the image. To fulfil the necessary requirements, the separation entropy has been improved by incorporating the standard deviation.
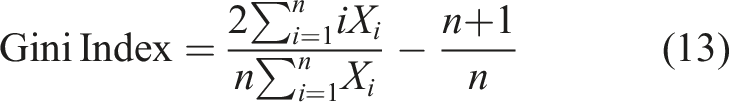
Income Inequality Metrics
The income inequality index is utilized to assess the disparity in financial distribution among wage and salary cycles. In this study, the Hough transform is employed to represent salaries as an adder grid. The elongated line of appointments in the image indicates higher salaries, while the optimal spread within the Hough adder framework signifies a pattern of inequality. Uncertainty is quantified using the Gini index (GI), which is determined as follows
Support Vector Machines Model
The diagnosis and classification of bone cancer were conducted using support vector machines (SVMs). Linear SVMs are typically employed for binary classification tasks, whereas multivariate SVMs are utilized for multivariate classification problems. In this study, a linear SVM was employed to classify cancer cells and distinguish healthy bones.
Consider a vector
If we represent the cancer and health information as ({(pi, qi), i = 1, 2, 3, 4, …, n}), the support vector machine generates the decision function F(x) to accurately classify the input data. For a new pattern P ∈ Rd, the corresponding classes after classification are denoted by y ∈ {+-1}.
A hyperplane is employed to separate the classes, and it can be represented as: <u.p + b> = 0; where u ∈ Rd and <u.p > denotes the inner dot product of
Random Forest Algorithm
Random Forests utilize an ensemble learning technique that involves multi-node decision trees for regression and a class mode or mean estimate. The random forest algorithm was developed to implement the standard method of aggregating bagging or bootstrap to tree learners. Instead of using a training set x = x1, x2, …, xn with labels y = y1, y2, …, yn, a random sample is used to augment the training dataset and is compared to the components multiple times (typically 100 times). This process is repeated for b = 1, …, 100.
The classification prediction of a random forest tree, denoted as Rb(x), is as follows.

Result and Discussion
In the research study, two experiments were conducted: one involving the use of the HOG feature set and the other without it. Each experiment utilized one of two different machine learning models, namely random forest and SVM. Furthermore, the performance of the model was assessed using five-fold cross-validation.
Published Data for Dataset
The data for the bone X-ray imaging investigation was collected from multiple institutions, including the TCIA (Cancer Imaging Archive).
Performance Evaluation
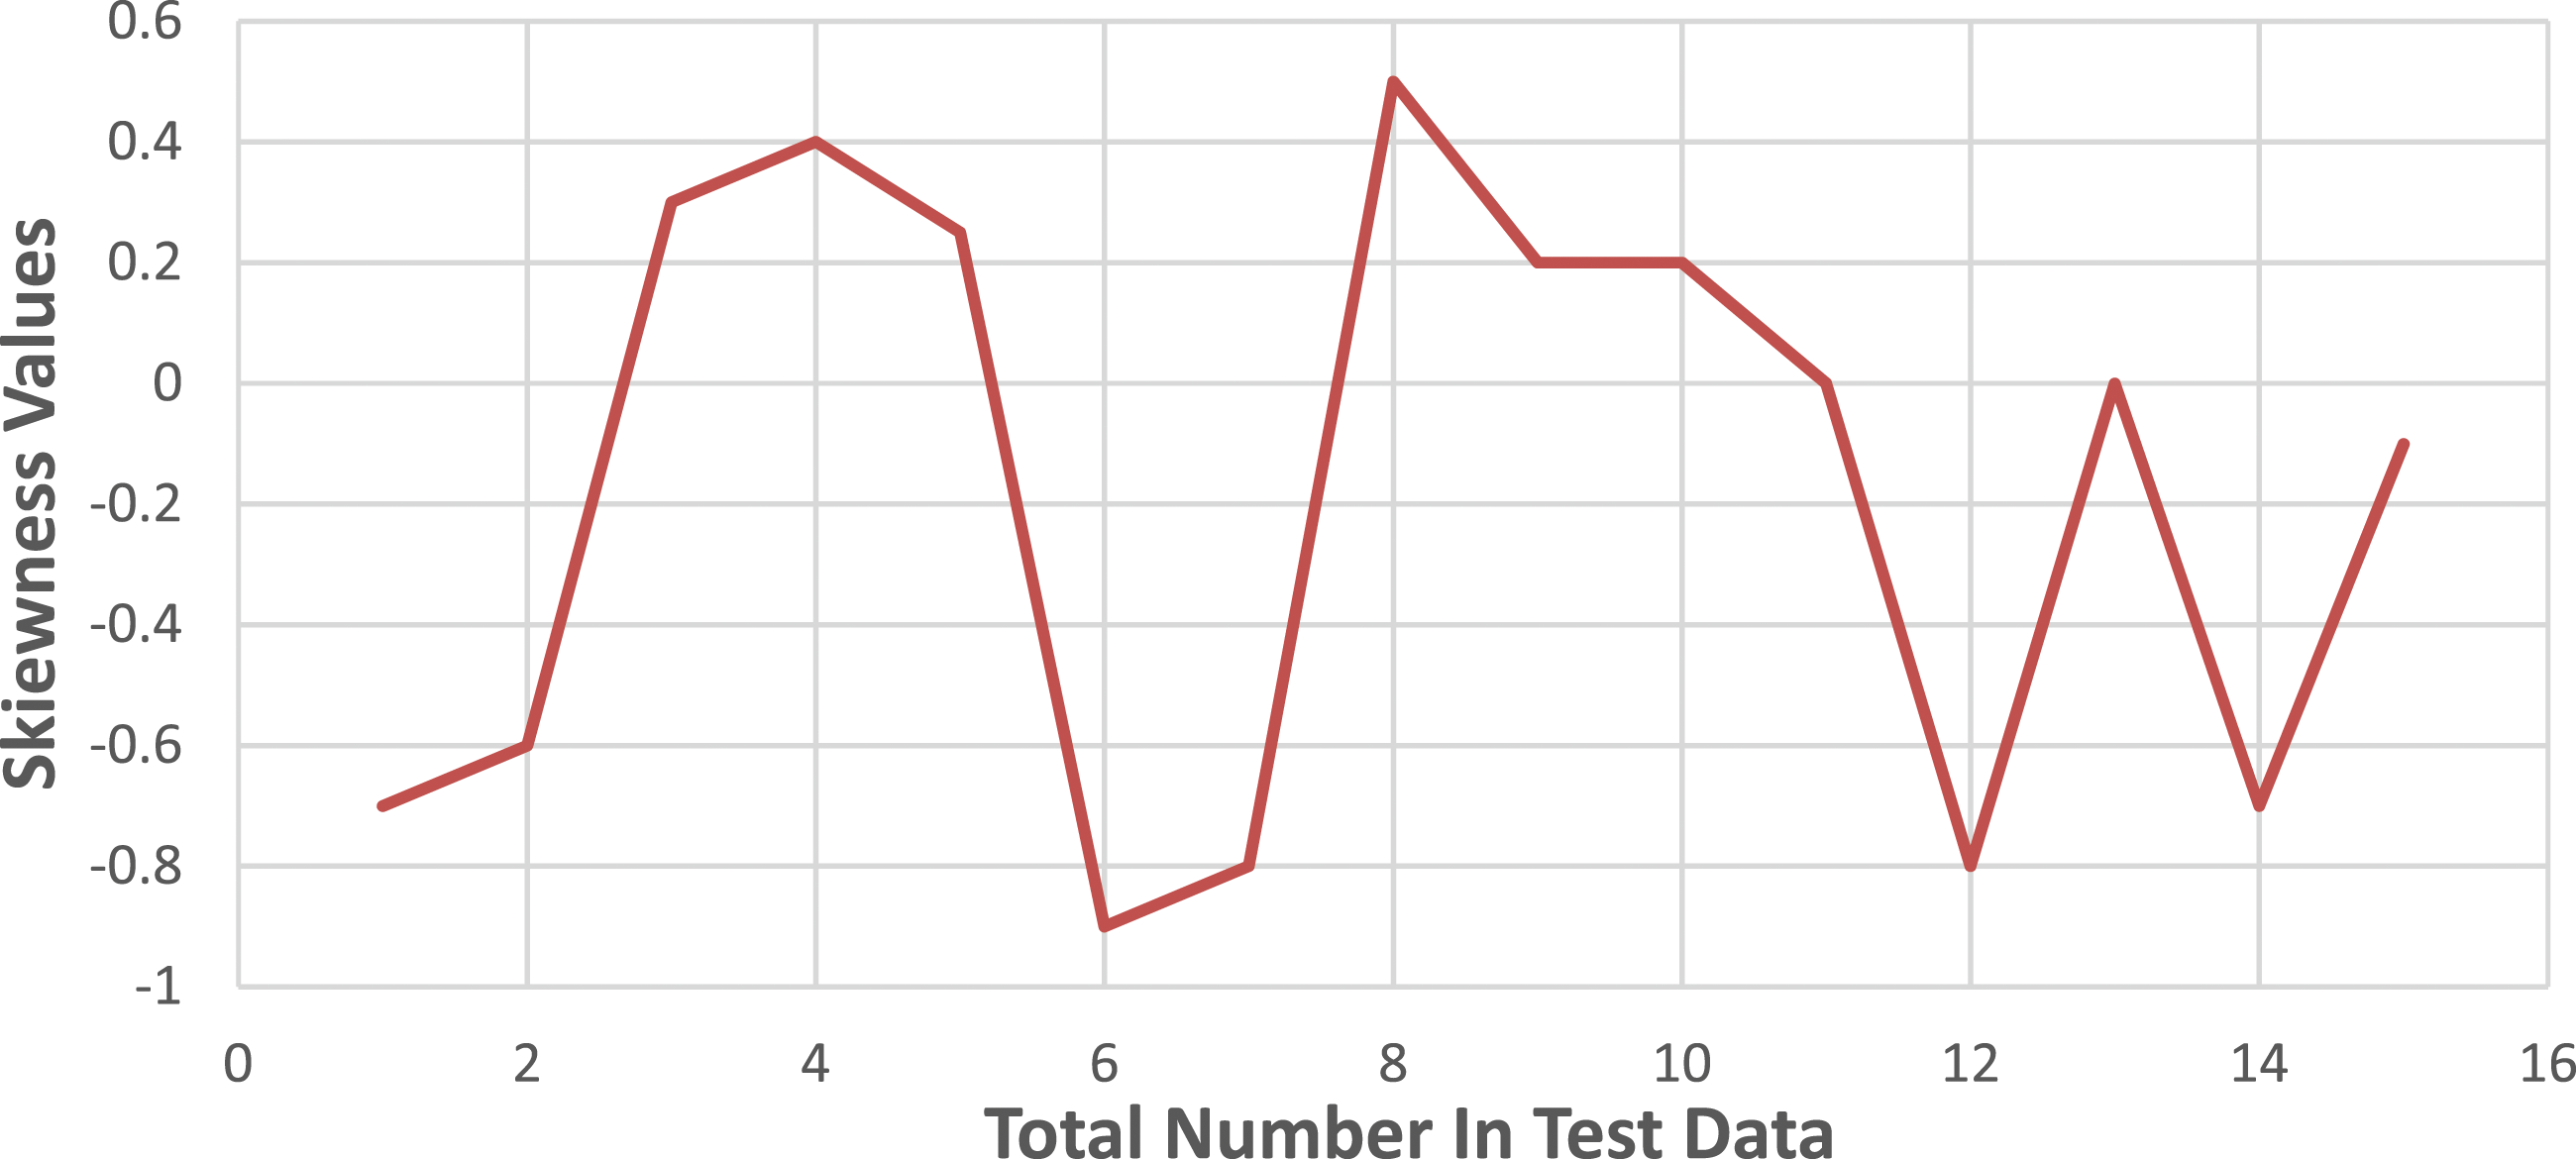
The proposed software was developed using the Microsoft Windows 8 operating system and MATLAB16 (a) with 16 Gigabytes of Random Access Memory (RAM). The study material consists of 67 photographs, while the test material includes 42 images. Since the X-ray pictures are sourced from various origins, it is necessary to eliminate any noise present in the images. A suitable denoising filter is applied for this purpose. The skeletal images are then separated using the Canny edge detection method. Features are extracted from both cancerous and healthy tissue images. SVMs are employed for training and classification tasks. Skewness of an image indicates whether its pixels are evenly distributed or not. Malignant bone exhibits a smaller size compared to healthy bone due to the uneven distribution of pixels observed in cancerous bone.
Let’s consider i = 1 to 45 for the images of cancerous bones and i = 46 to 65 for the images of healthy bones. The skewness values of the training photos are depicted in Figure 3, while Figure 4 represents the skewness values observed in the test photos. It is observed that both cancerous and healthy photos, as well as the test and training photos, exhibit a similar pattern of skewness values in the bones. Skewness patterns in training data. Skewness patterns in test data.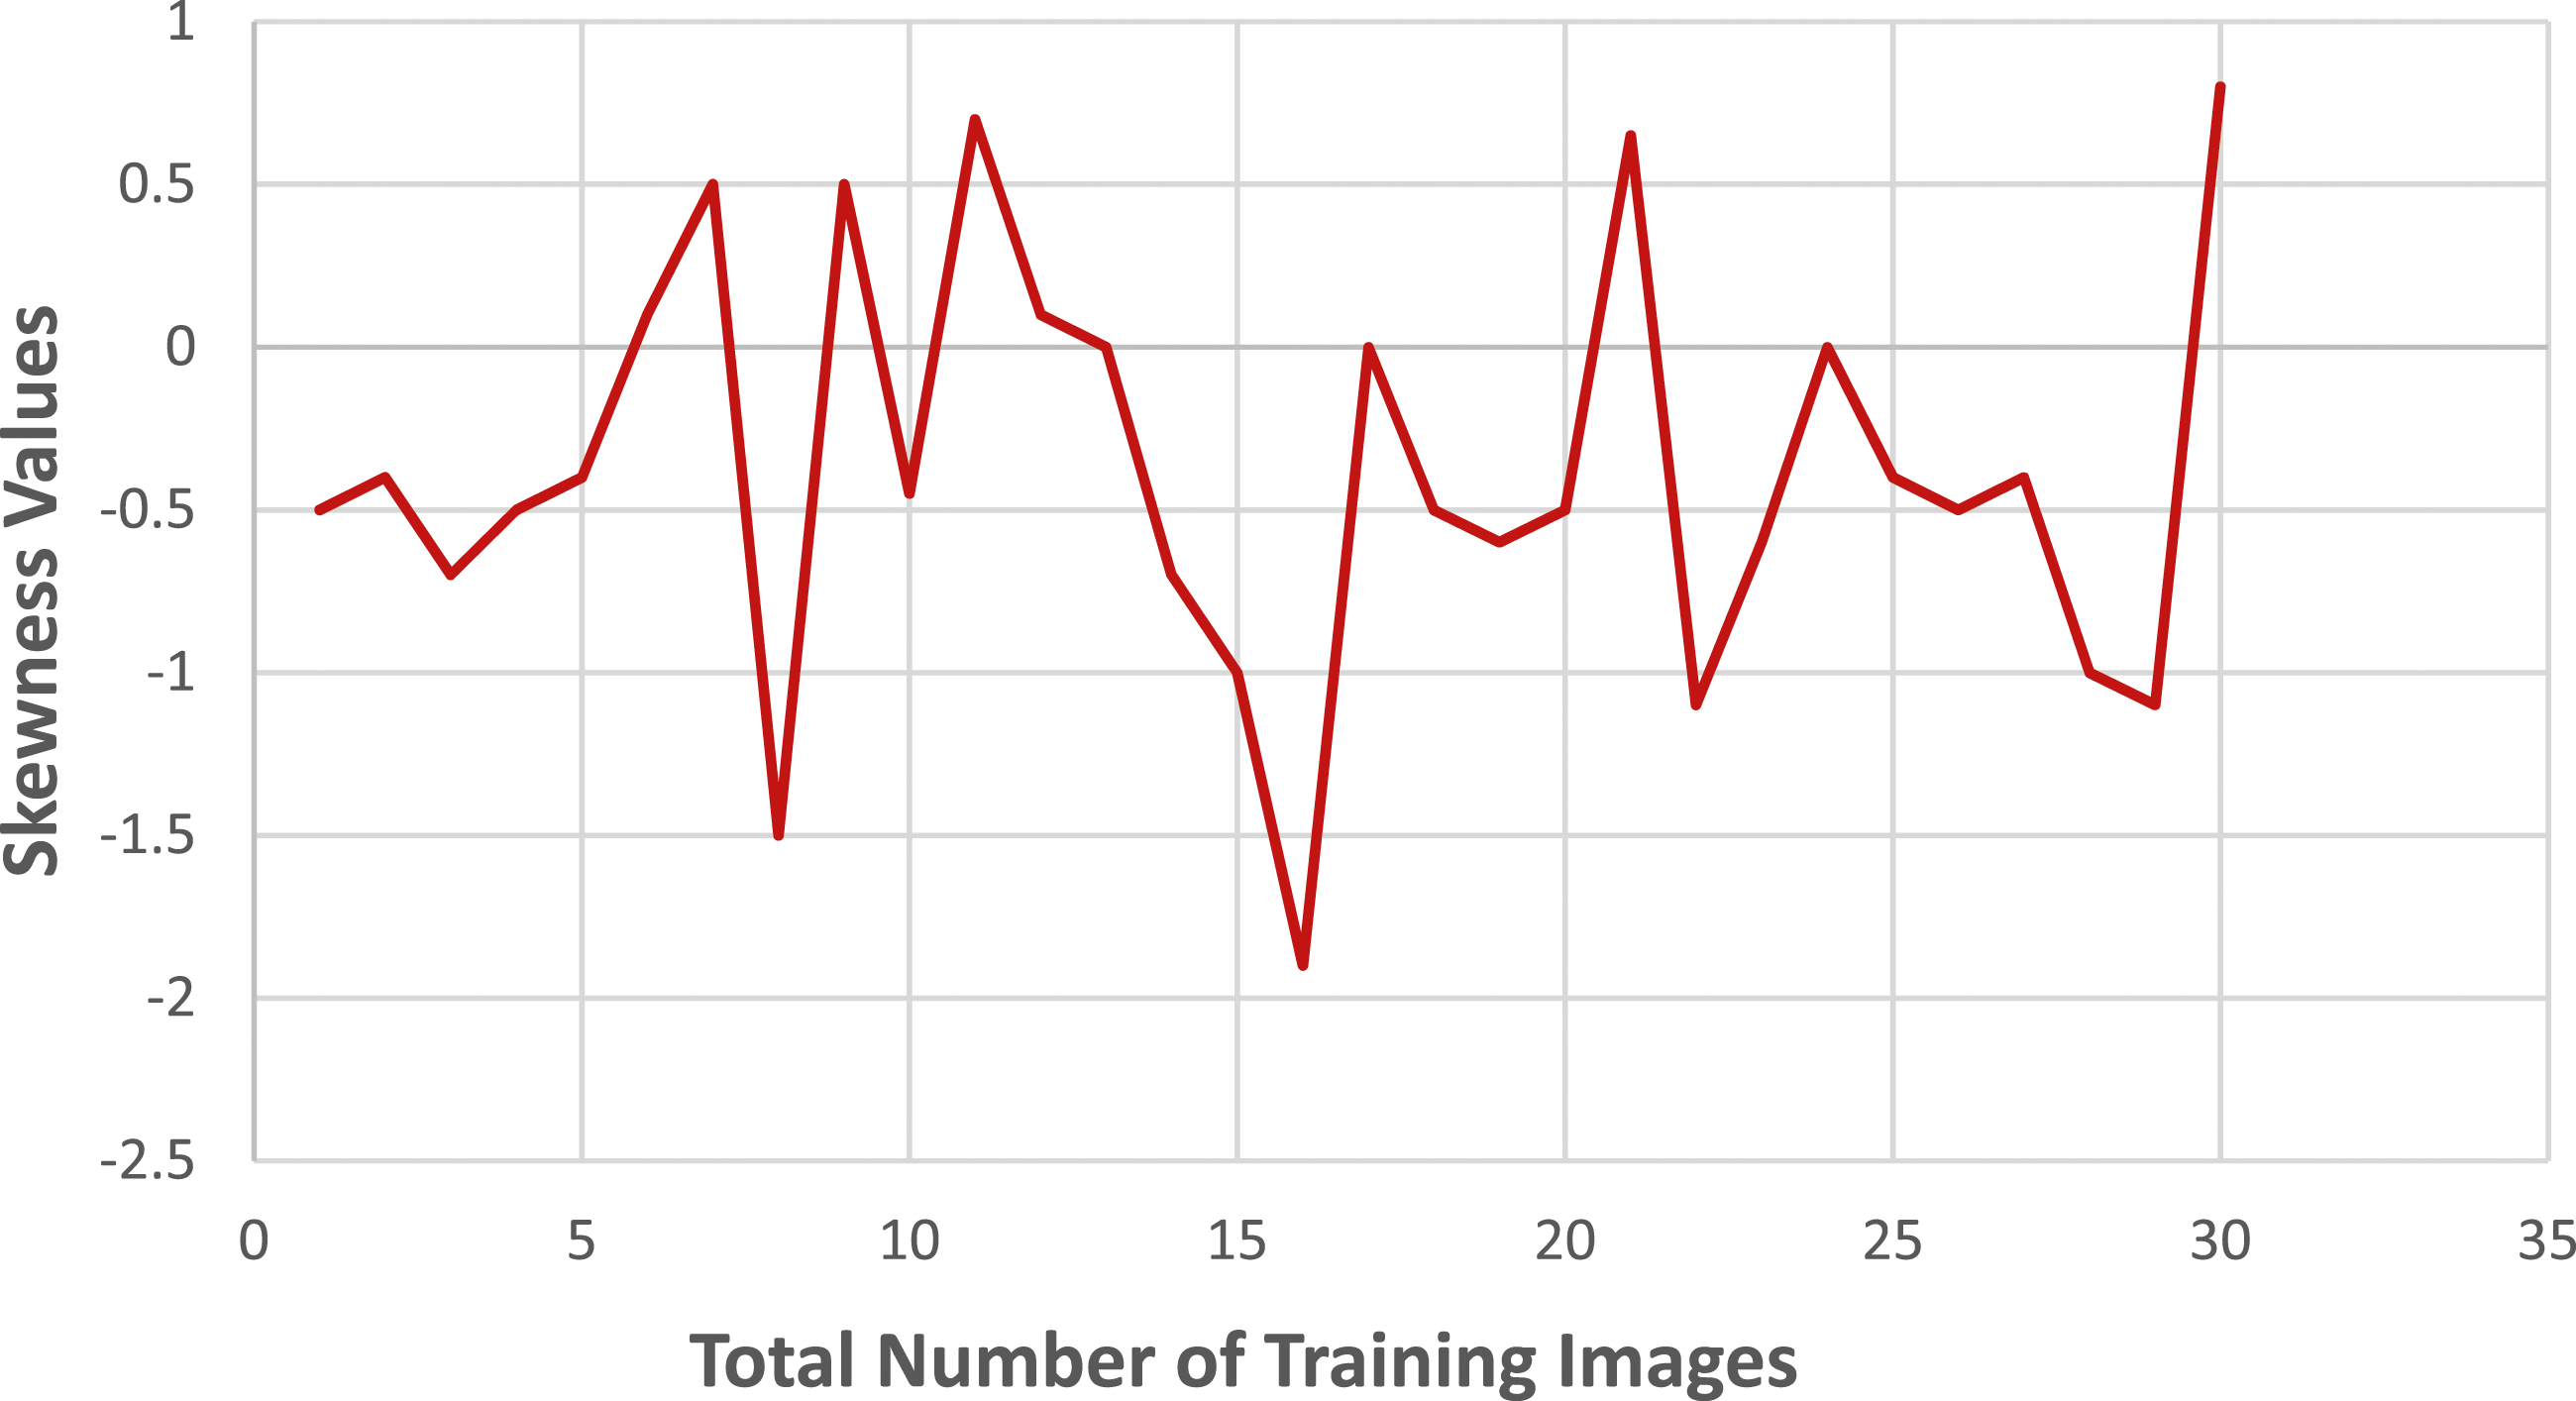
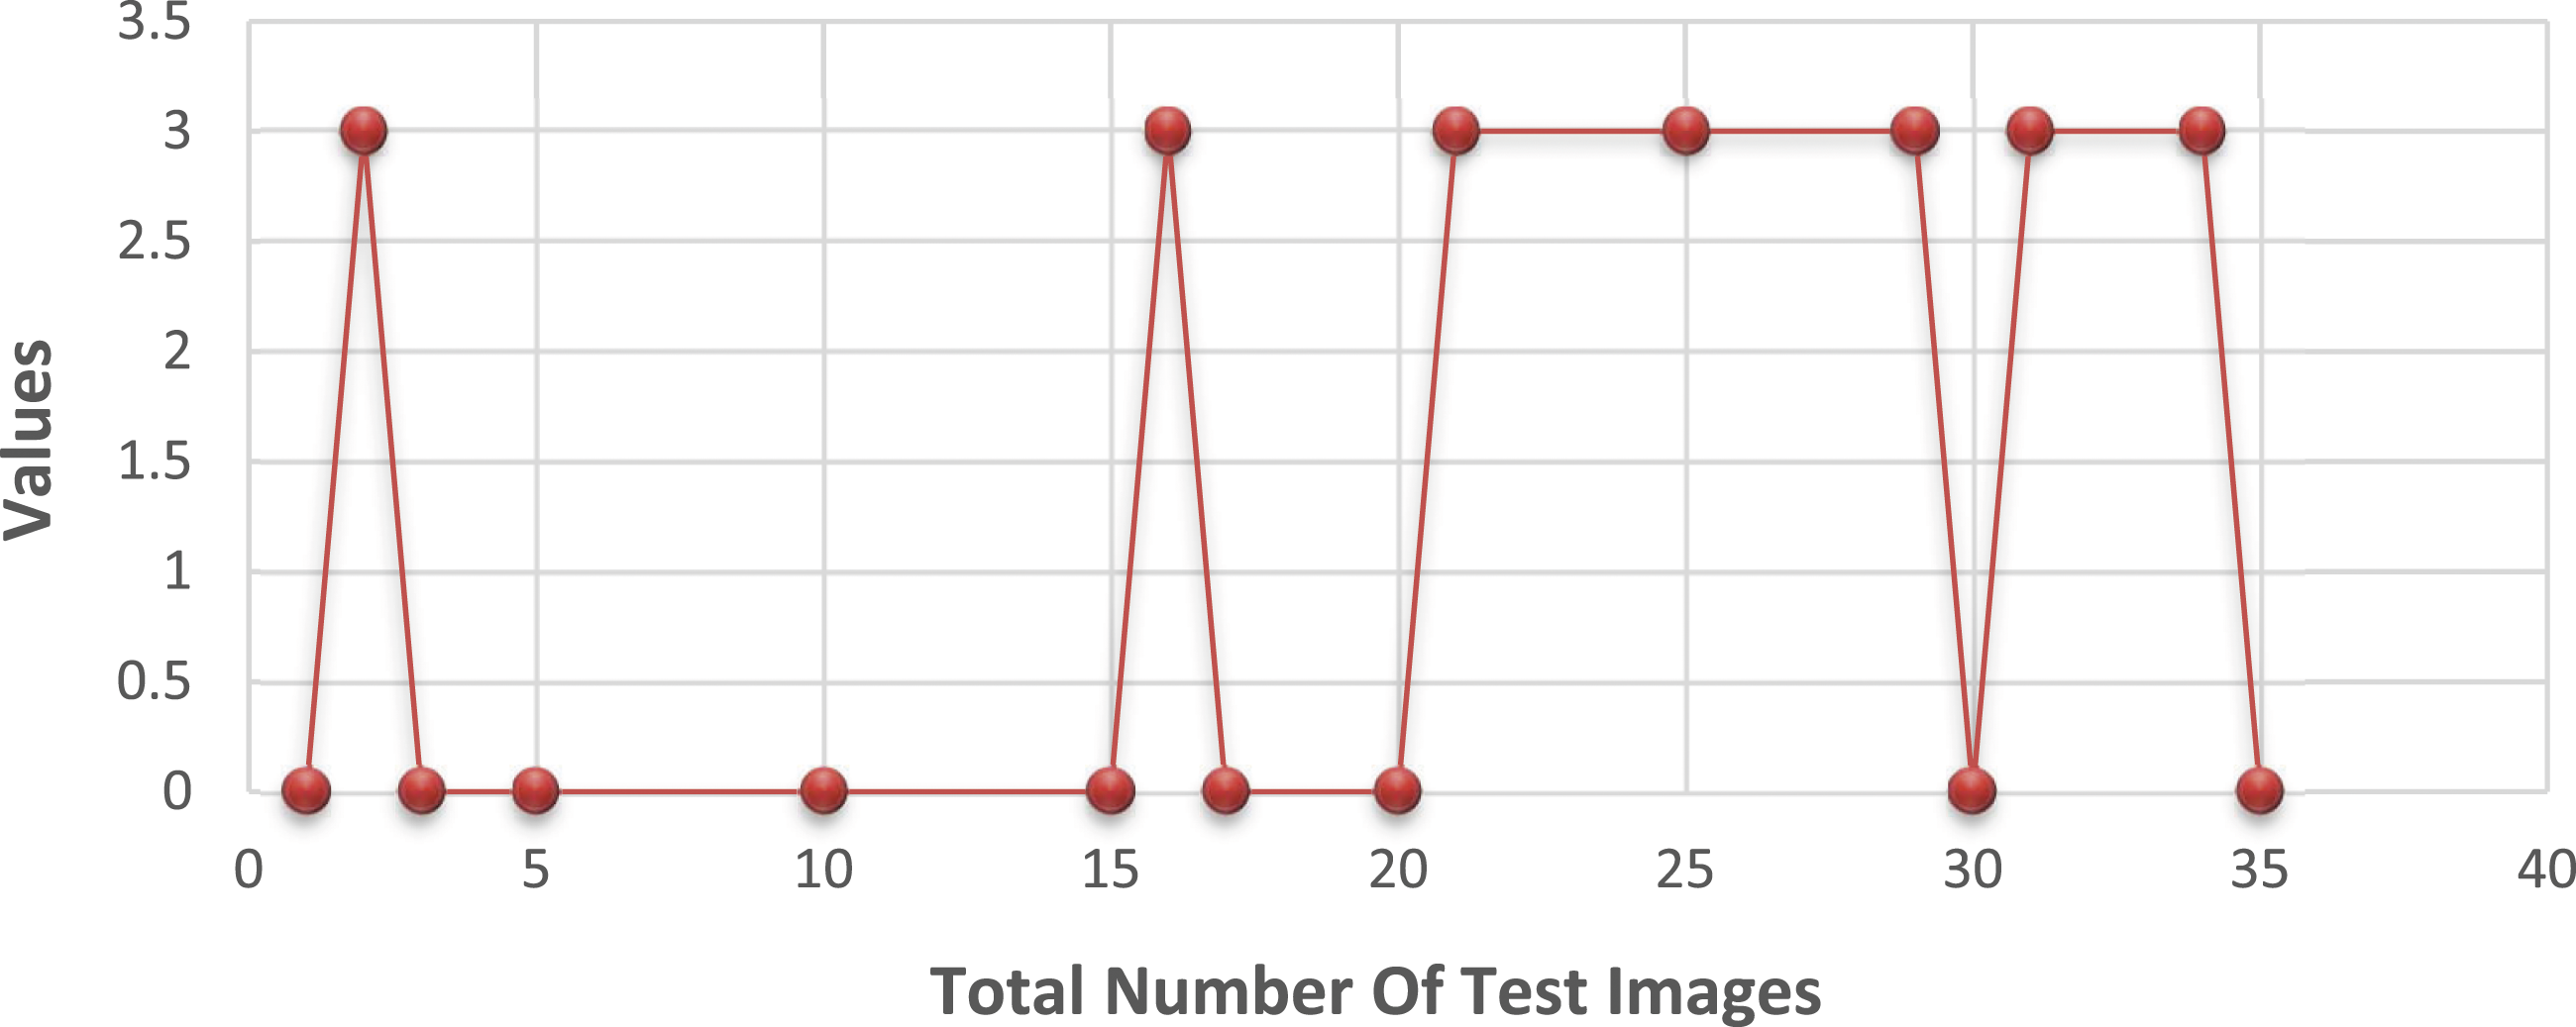
Performance Evaluation With Histogram of Oriented Gradients Feature
When it comes to training and deployment, HOG functions play a crucial role. They generate a new image by extracting gradients and orientations from the original image and combining them. The HOG descriptor assigns a histogram to each section of the image. As a first step, the image size is reduced to 25 × 25 pixels. After conducting several trials on the dataset, the window size of each bounding box was adjusted to a value of 3, and the number of histogram splits was increased to 6. Changes in the reference image were analyzed based on the gradients in the x and y directions for each pixel. In Figure 5, it is observed that the HOG-based data yielded negative detection results for bone cancer in all 20 photos and for bone loss in 2 out of 20 images. In Figure 6, porcine features were not used for training and testing materials due to 2 out of 20 cancerous bones being negative and 3 out of 20 healthy bones being negative. Test data result with the HOG feature. Test data result without HOG feature.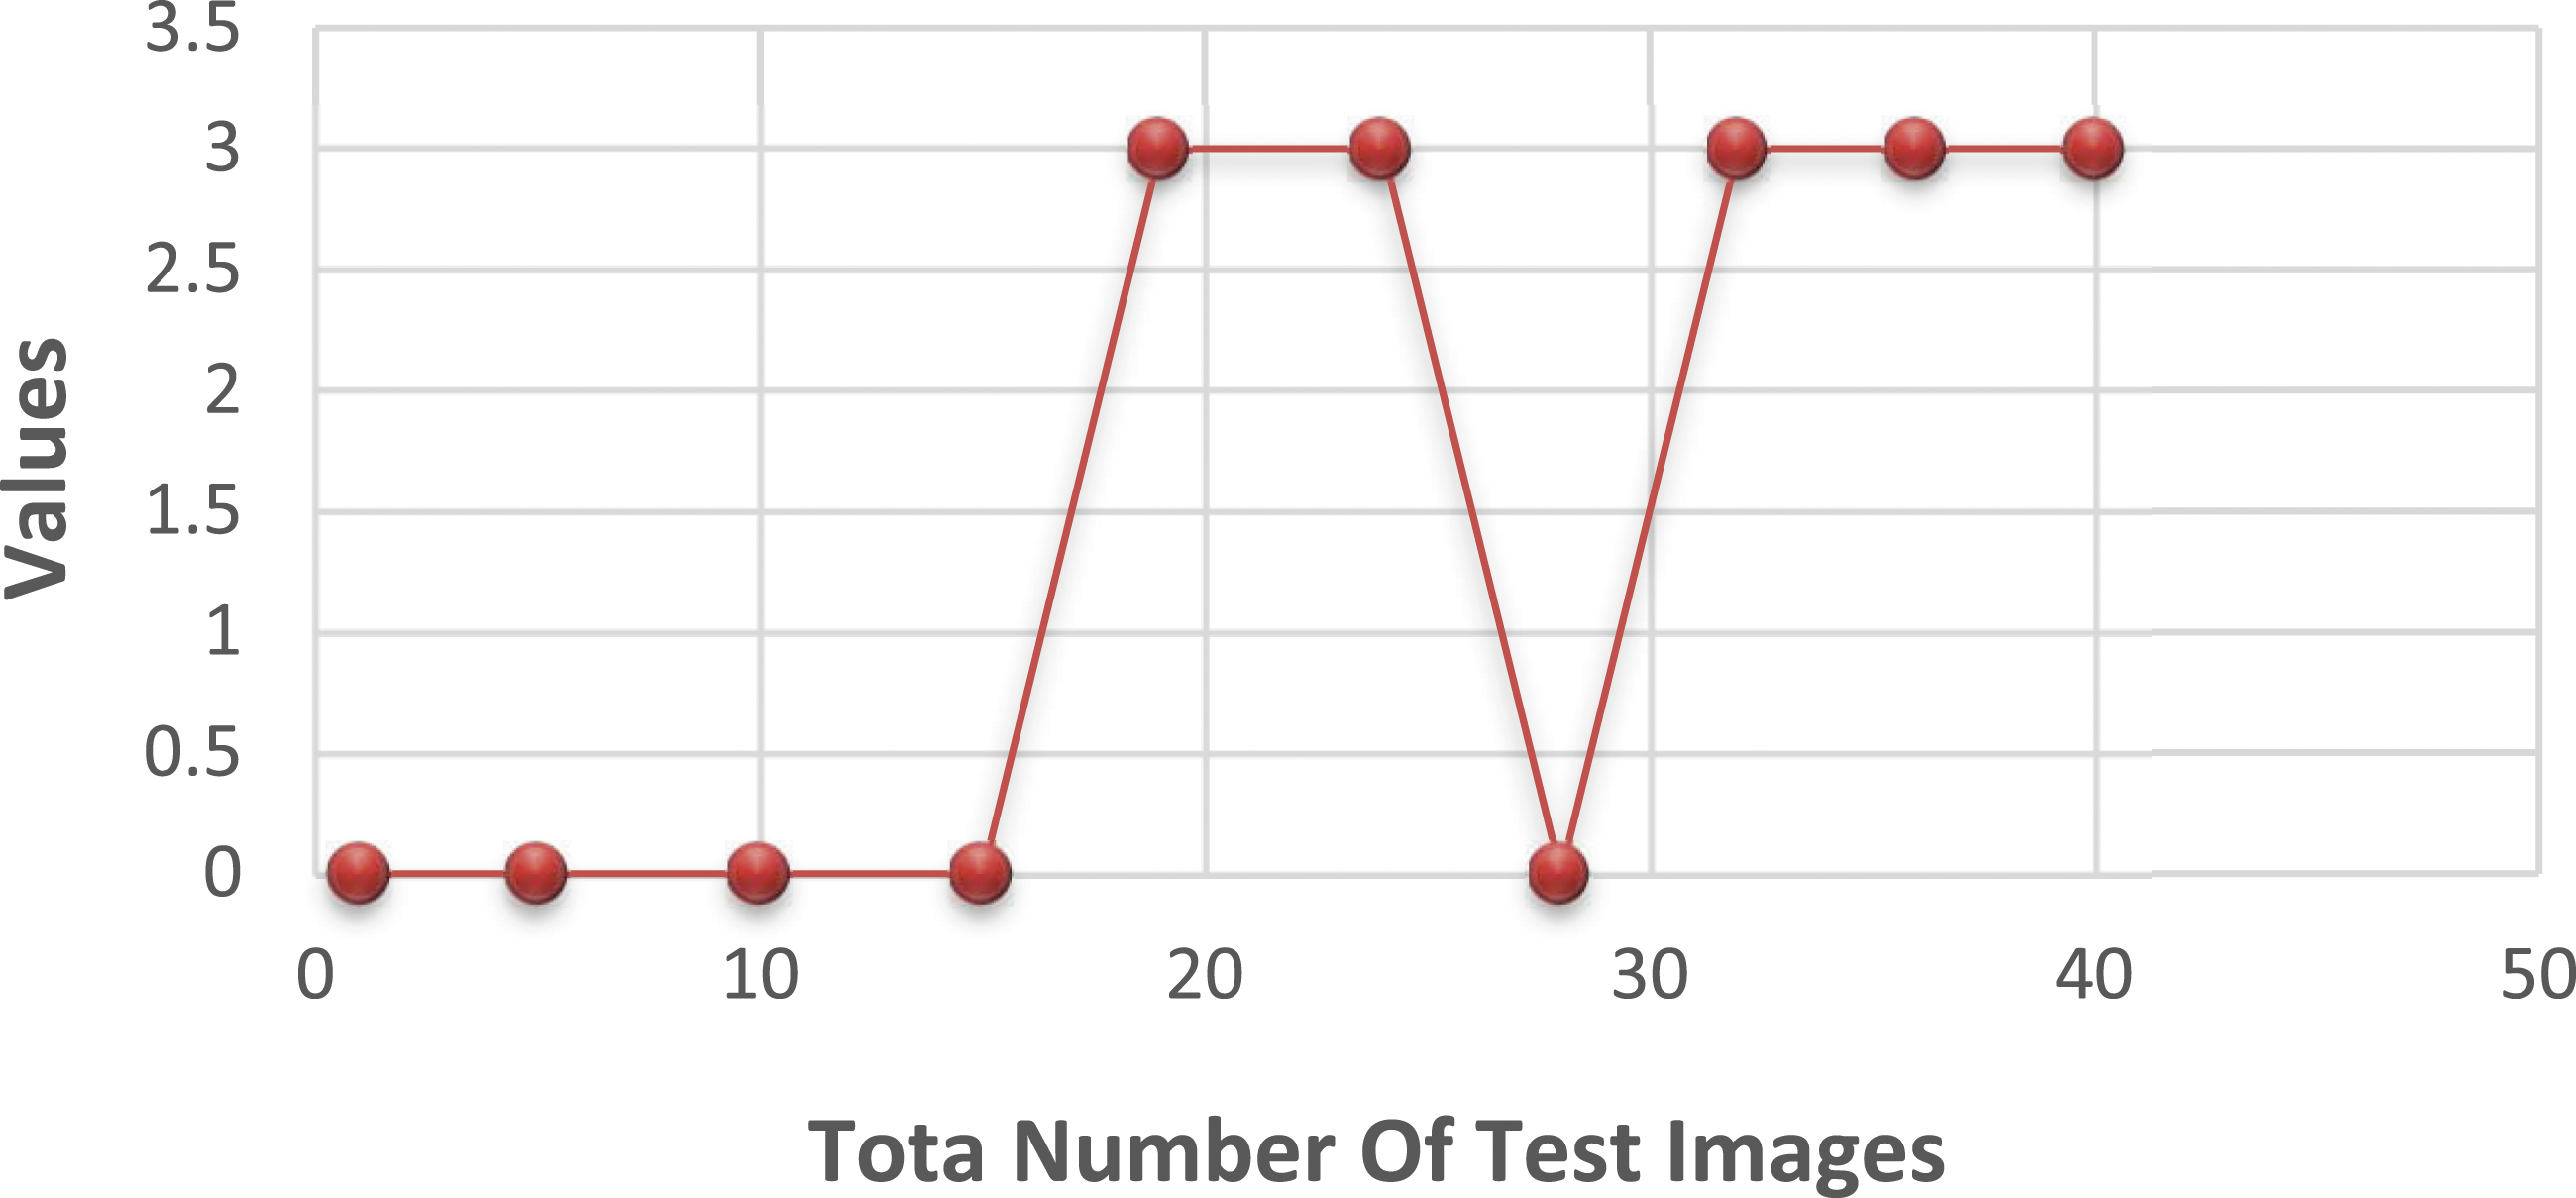
Hog Feature Confusion Matrix of Data.
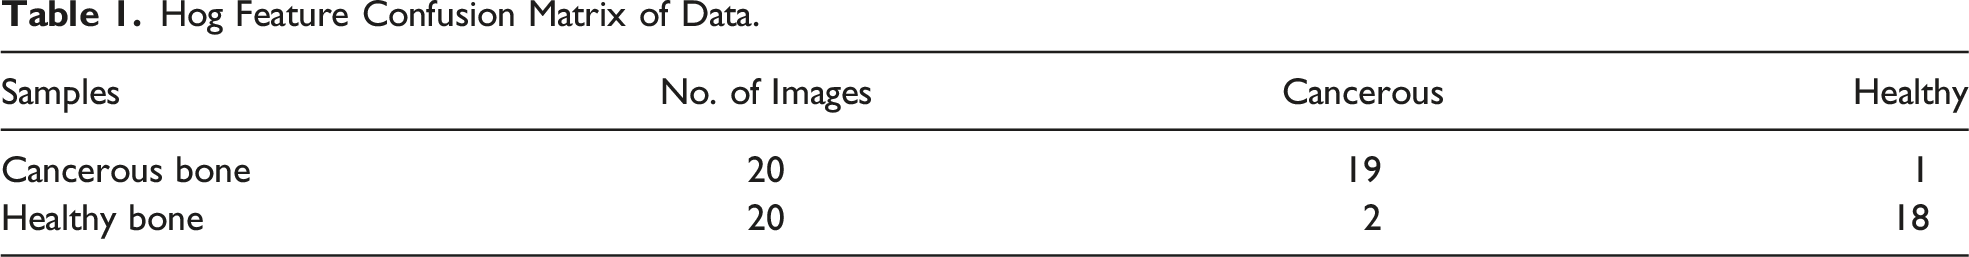
Hog Feature Confusion Matrix of Data.
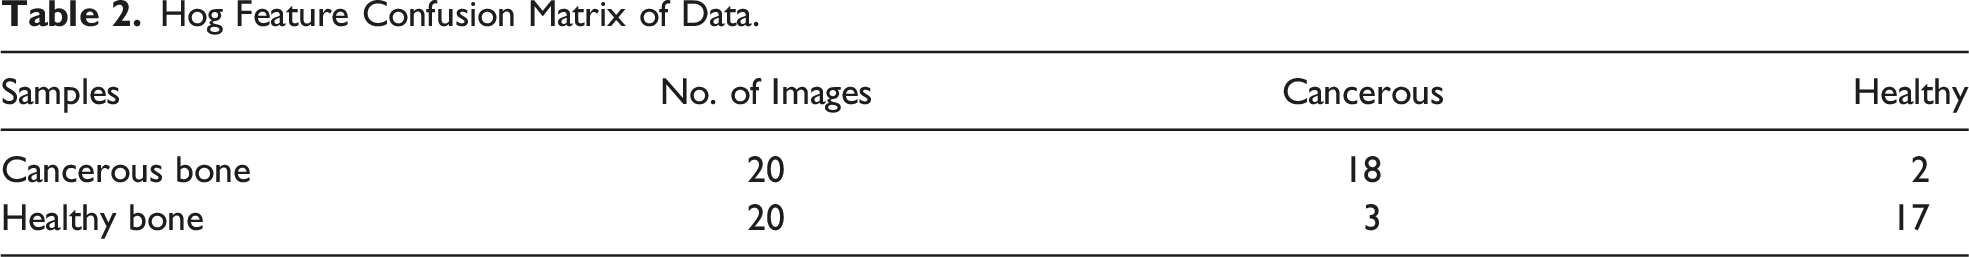
Hog Feature Confusion Matrix of Data.
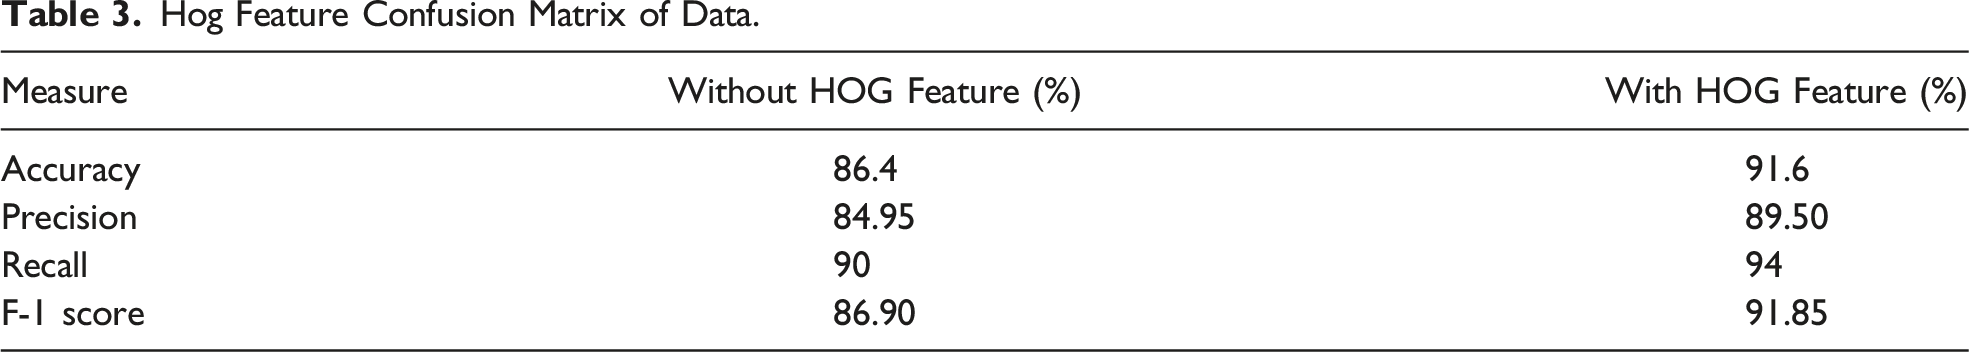
Based on the findings presented in Table 3, it is evident that the HOG feature plays a vital role in determining bone health and detecting cancer. Similar studies have also classified bones as healthy or malignant using GLCM-based tissue or other tissue-based approaches.
Published Data for Dataset
Boxplot analysis was conducted to determine the significance of the features. In Figure 7, box plots are presented for nine features, with each box representing the traits of the HOG. Classification using HOG features proves to be more accurate compared to other features due to the smoothness and stability of the data. The HOG feature extraction process involves eliminating gradients and orientations from an image, which allows for the identification of the shape and orientation of the resulting pixels.
41
The HOG descriptor divides the image into smaller sections and generates a histogram for each region individually. By calculating slopes and directions for each pixel, changes in the reference image can be analyzed. Box plot analysis of different features.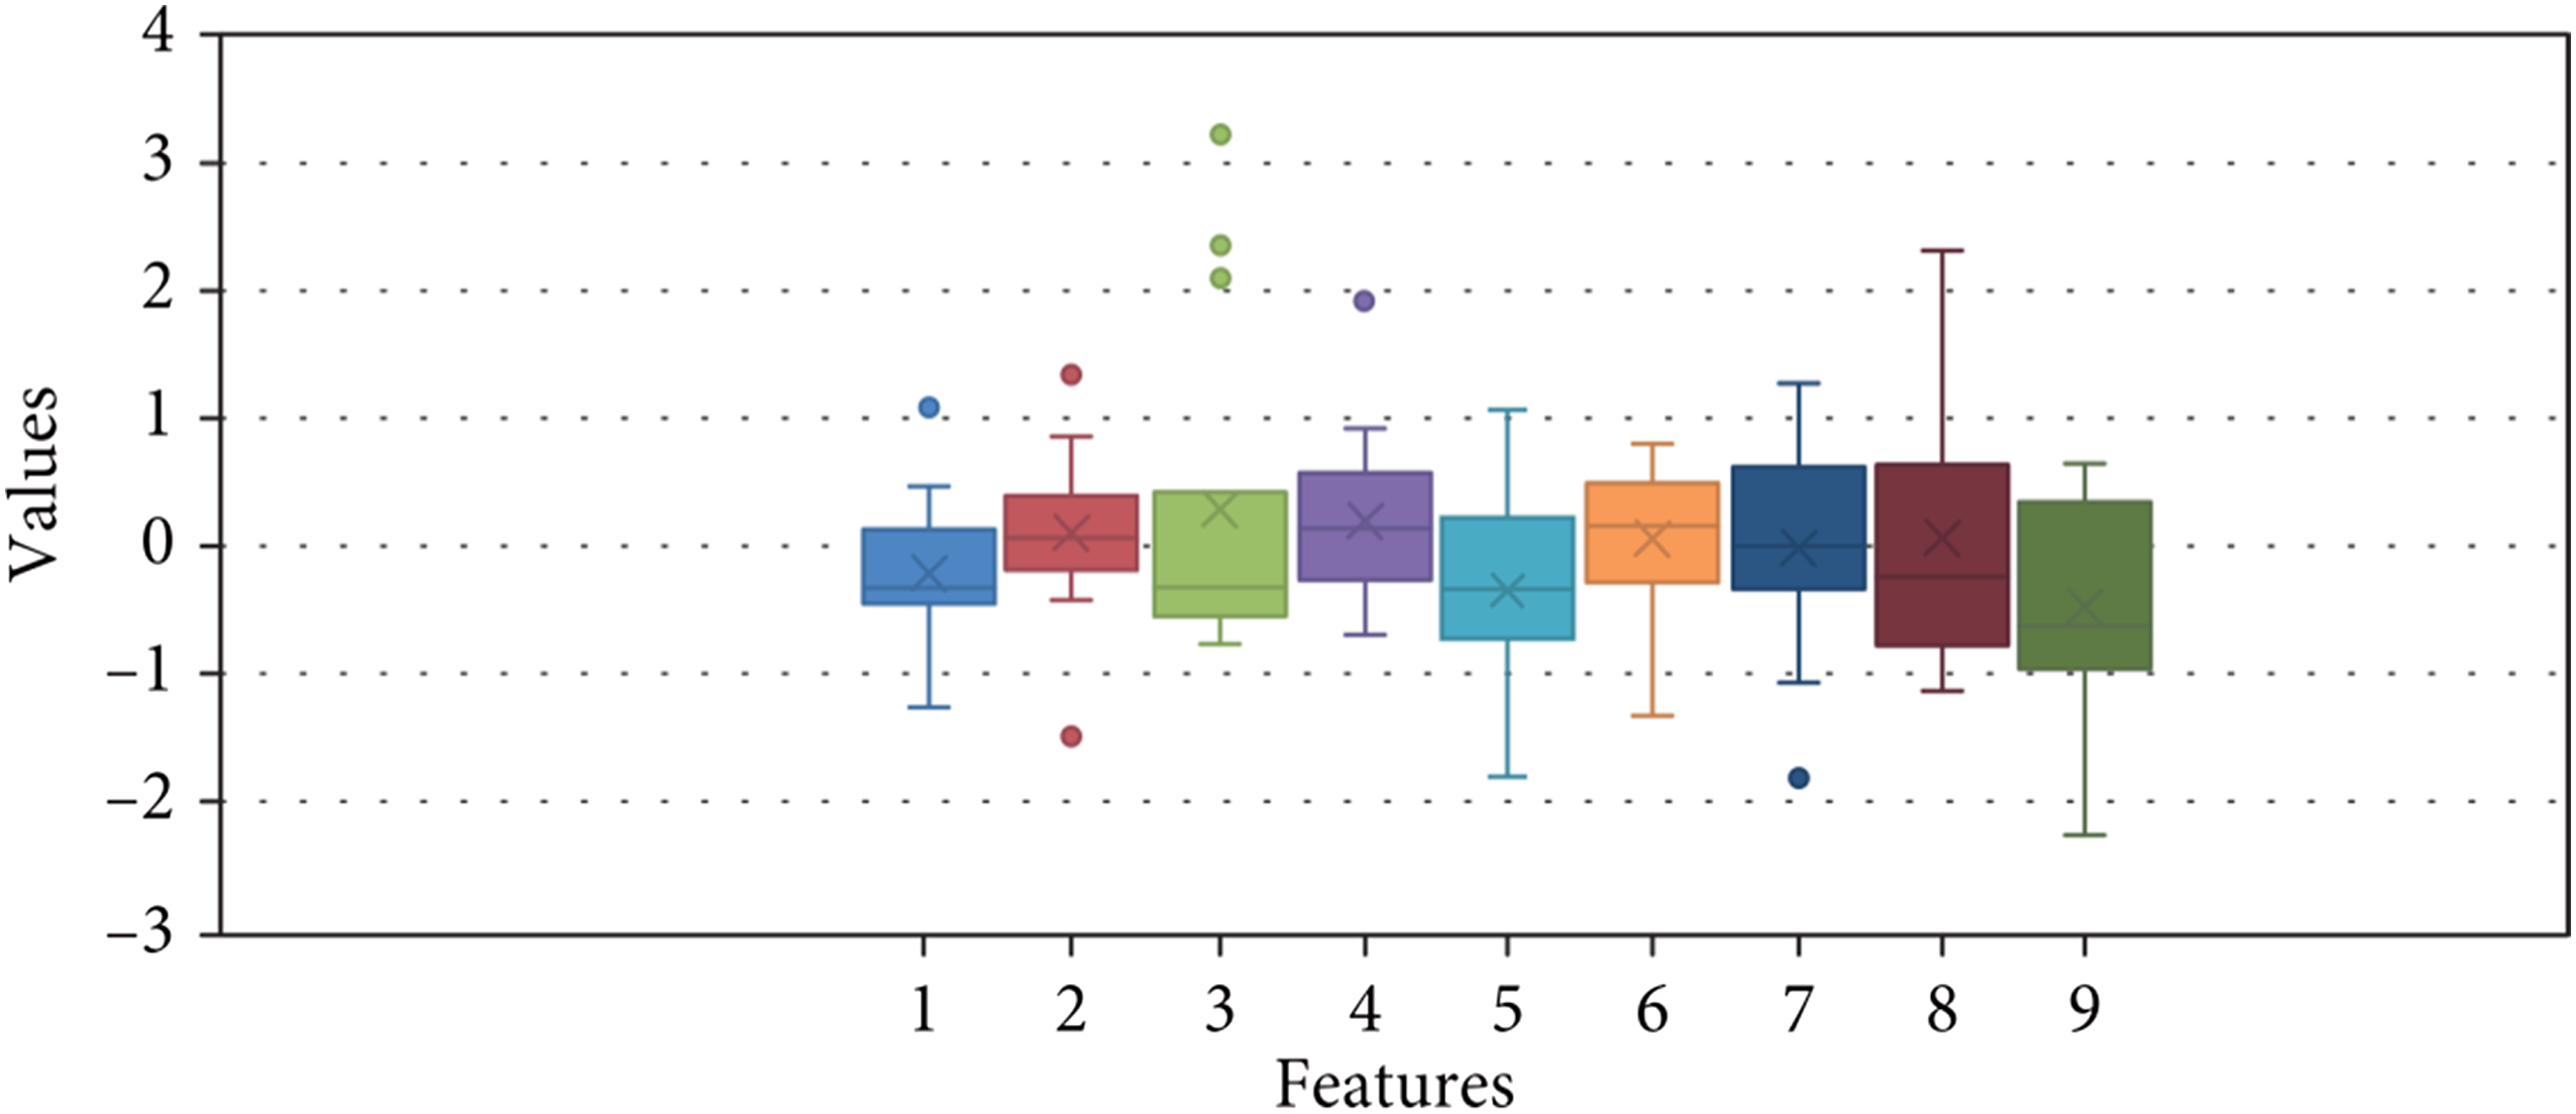
Work Validation
Researchers have found a correlation between the progression of bone cancer and the accumulation of fluid, adipose cells, and hematopoietic cells. Texture analysis can help distinguish these characteristics. The pixel density serves as a visual representation of the texture, which varies between healthy and malignant bone. This analysis focuses on the textural properties of the image. Malignant bone exhibits a distinct texture compared to normal bone, making precise texture interpretation crucial.42-45 Pixels representing healthy bone display less dispersion compared to those depicting malignant bone. In this study, the proposed approach utilizes pixel analysis to differentiate between healthy and malignant bone. However, it does not aim to differentiate between normal and malignant bone images. The approach identifies the region of interest (ROI) in an MRI image of a bone affected by malignancy.
The affected region is analyzed by quantifying the number of pixels within it. The respective pixel intensities are summed to obtain the overall intensity representation. Ultimately, cancer staging is estimated based on the mean intensity value.
In the research, malignant bone was identified using the comprehensive textural capabilities of GLCM (Gray-Level Co-occurrence Matrix). However, the findings revealed that the type of bone cancer could not be accurately determined based solely on the GLCM texture feature. Therefore, additional features, such as HOG (Histogram of Oriented Gradients), were incorporated in the current investigations to improve the detection and categorization of malignant bones. The HOG function provides information about the orientation and shape of pixels in the neighboring cells, enabling precise localization of tumors. This study combines multiple methods and texture capabilities to effectively detect and classify both malignant and healthy bone. SVM (Support Vector Machine) is employed for the classification of long bones, particularly in identifying malignant or unhealthy ones. The overall performance of the models achieved an accuracy of 85%, which can be further improved. It is important to note that this investigation does not solely focus on long bones but encompasses a broader perspective.
Comparing Machine Learning Algorithms
As depicted in Figure 8, the pixels representing the malignant area are distributed more extensively throughout the bone image. The HOG property plays a crucial role in determining the shape and movement of pixels, mainly influenced by the window size and histogram bins.
46
The region of interest (ROI) is obtained by utilizing a bounding box and selecting the contour area with the largest size, as illustrated in the subsequent figure. Image with HOG feature.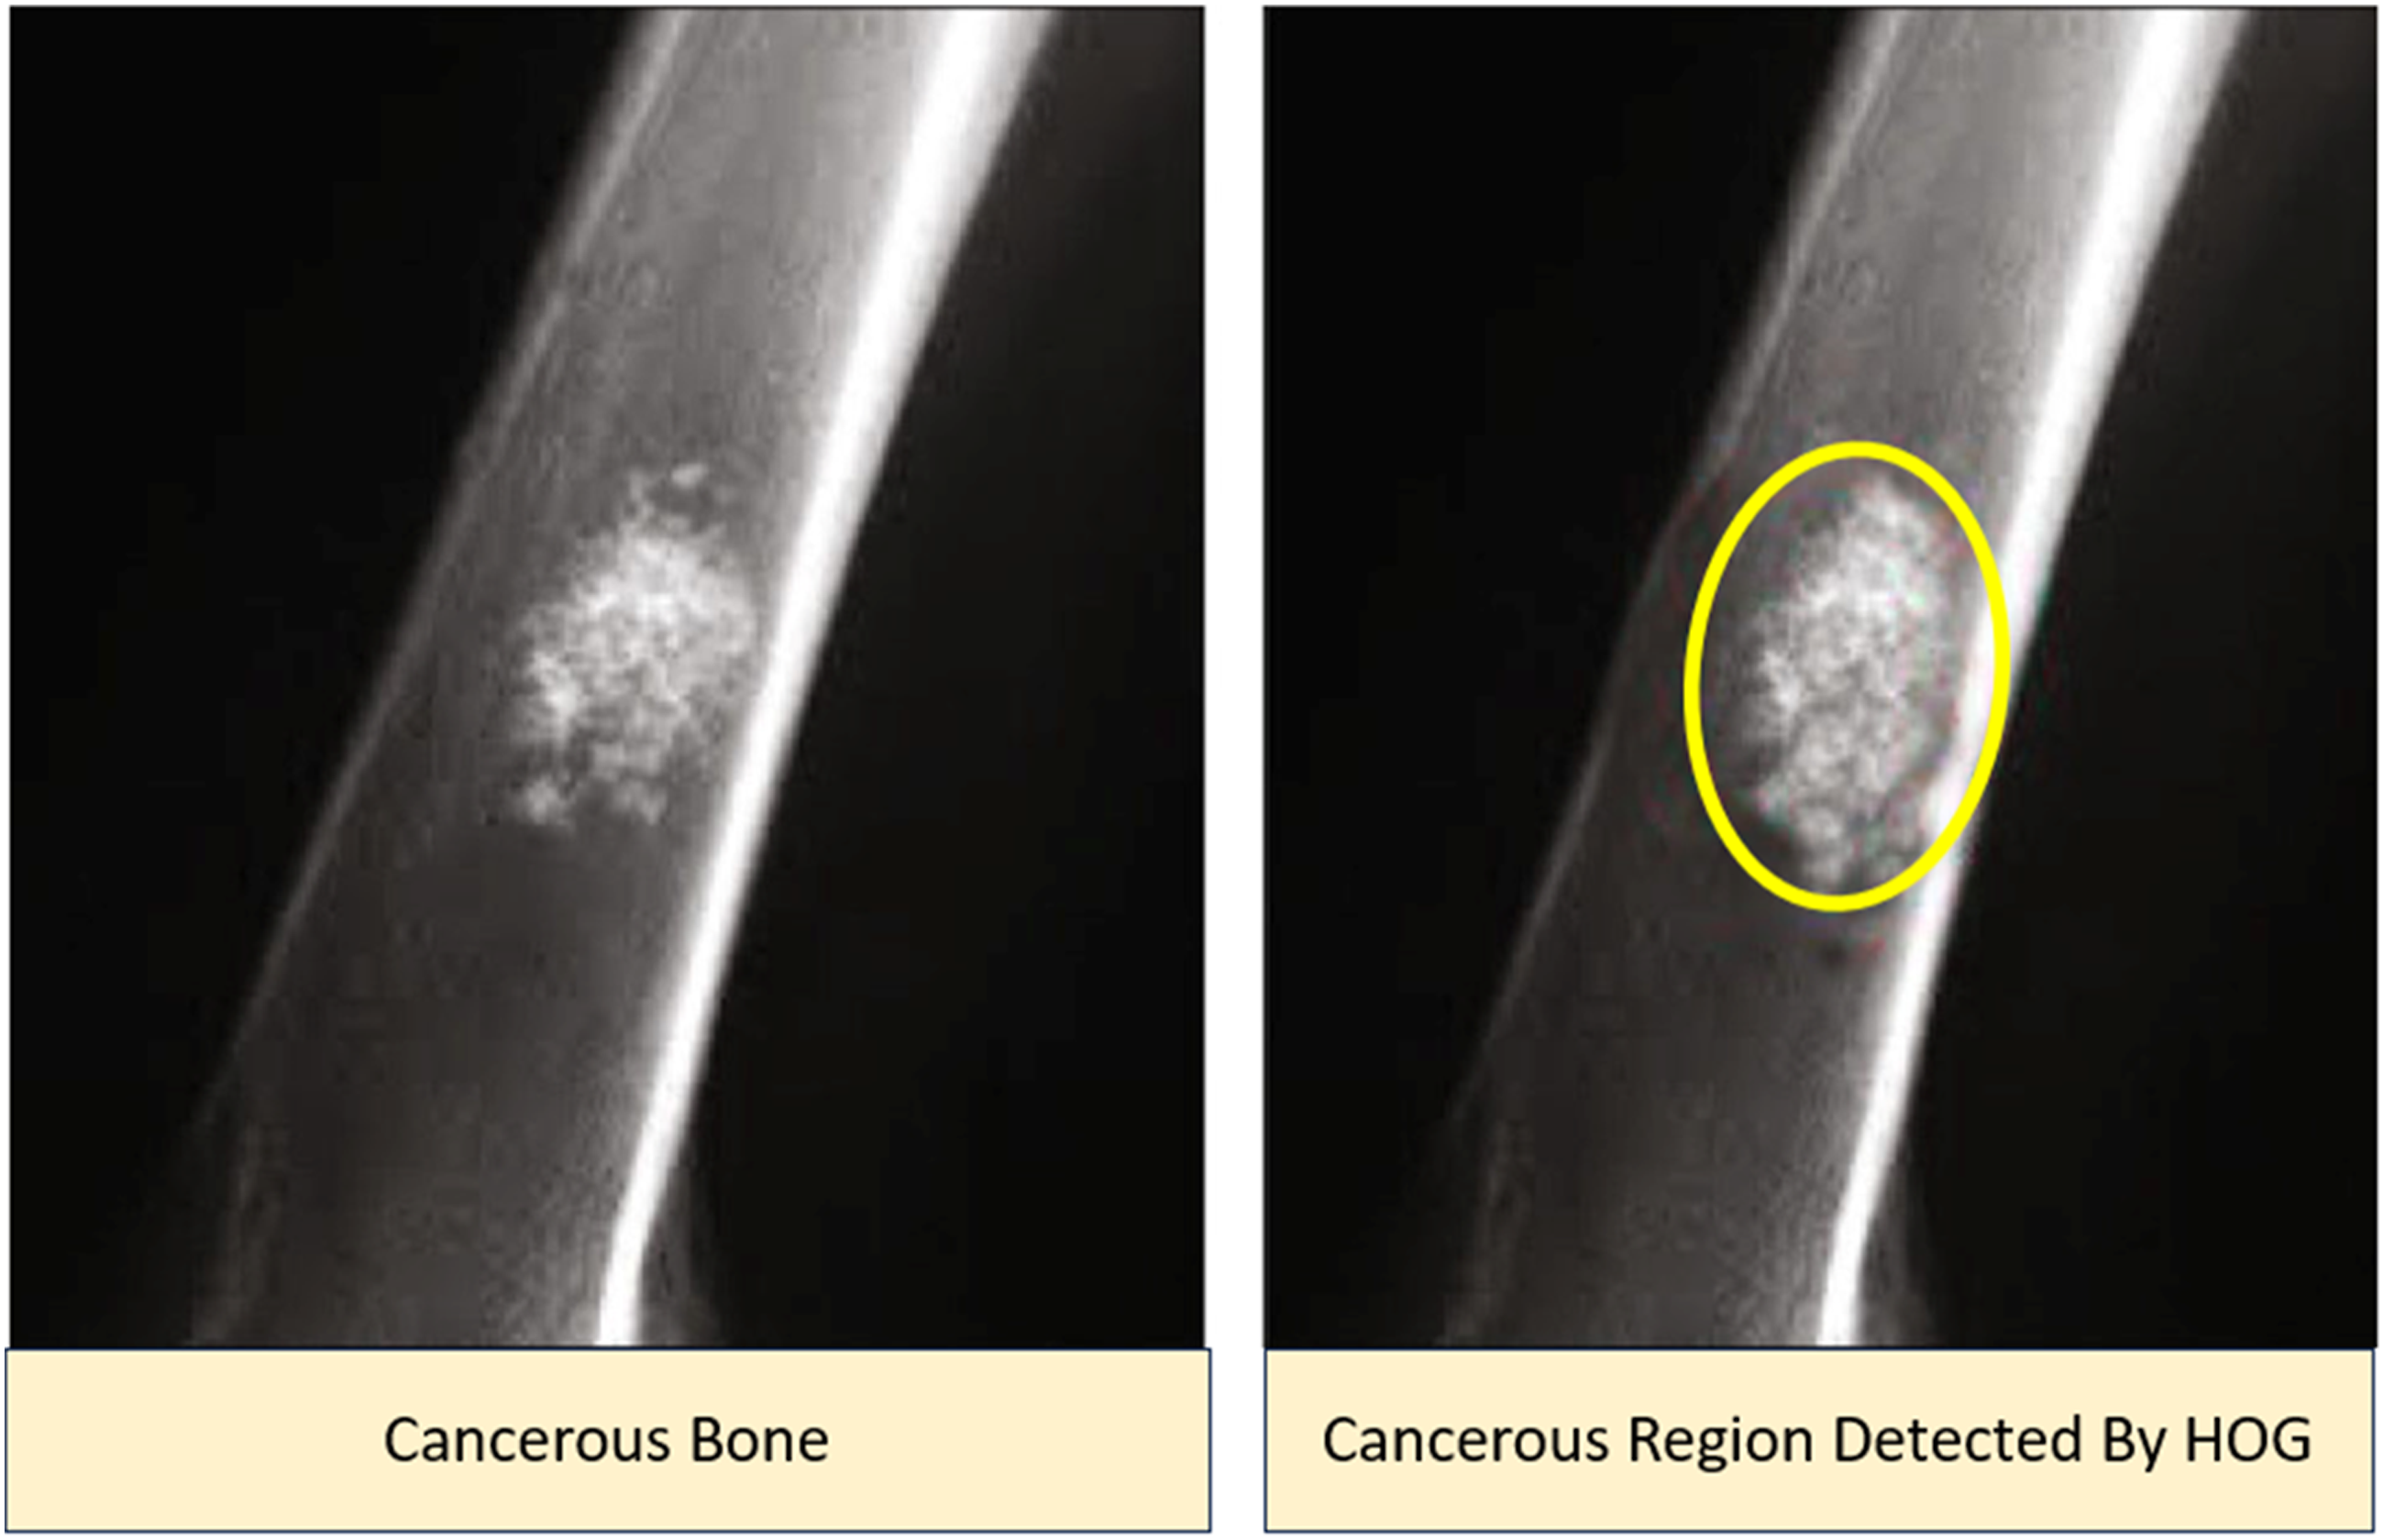
Comparison Between the Proposed Method and Previous Work
The proposed technique is compared to existing tissue-based methods such as entropy and standard deviation. However, due to the wide diversity of human skeletons, the current technologies are unable to cater to all variations. In order to differentiate between malignant and healthy bones across various human bone types, the proposed technique leverages porcine features such as entropy and standard deviation. Remarkably, the strategy outperforms existing methods in every relevant metric, showcasing its superiority in bone classification.
Comparison of the Previous Work and the Proposed Approach for Cancerous Bone Classification.
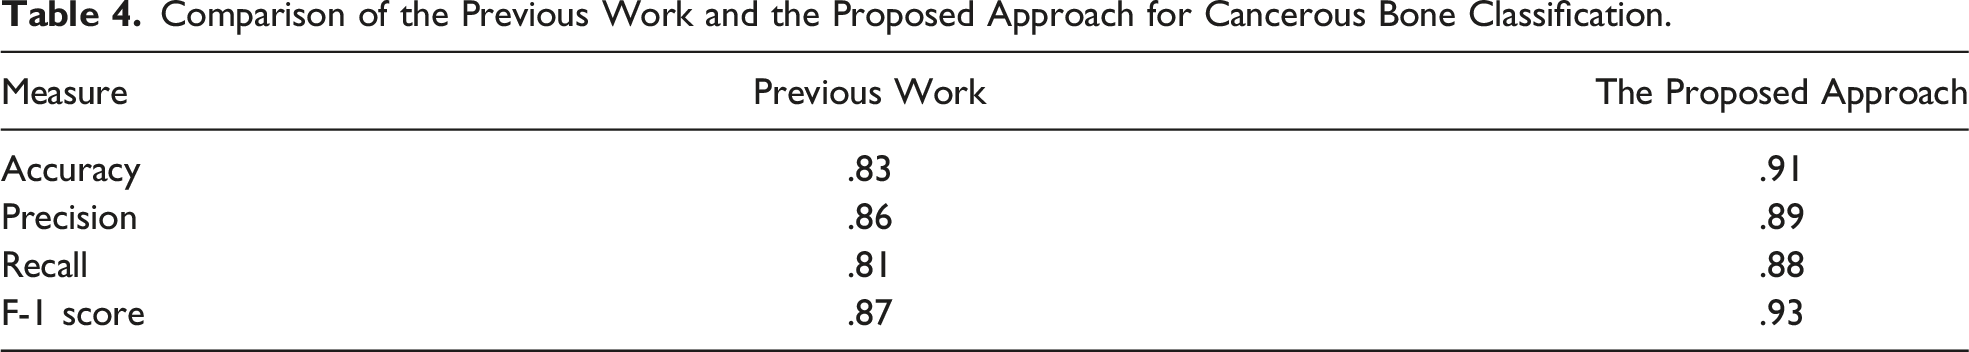
Figure 9 illustrates the superior performance of the proposed work compared to previous studies, particularly when incorporating 5-fold cross-validation. The overall performance, as measured by accuracy and recall, is higher with the 5-fold cross-validation approach. However, it is important to note that the precision and rating metrics are comparatively lower with this approach. Performance Measures comparison with previous work.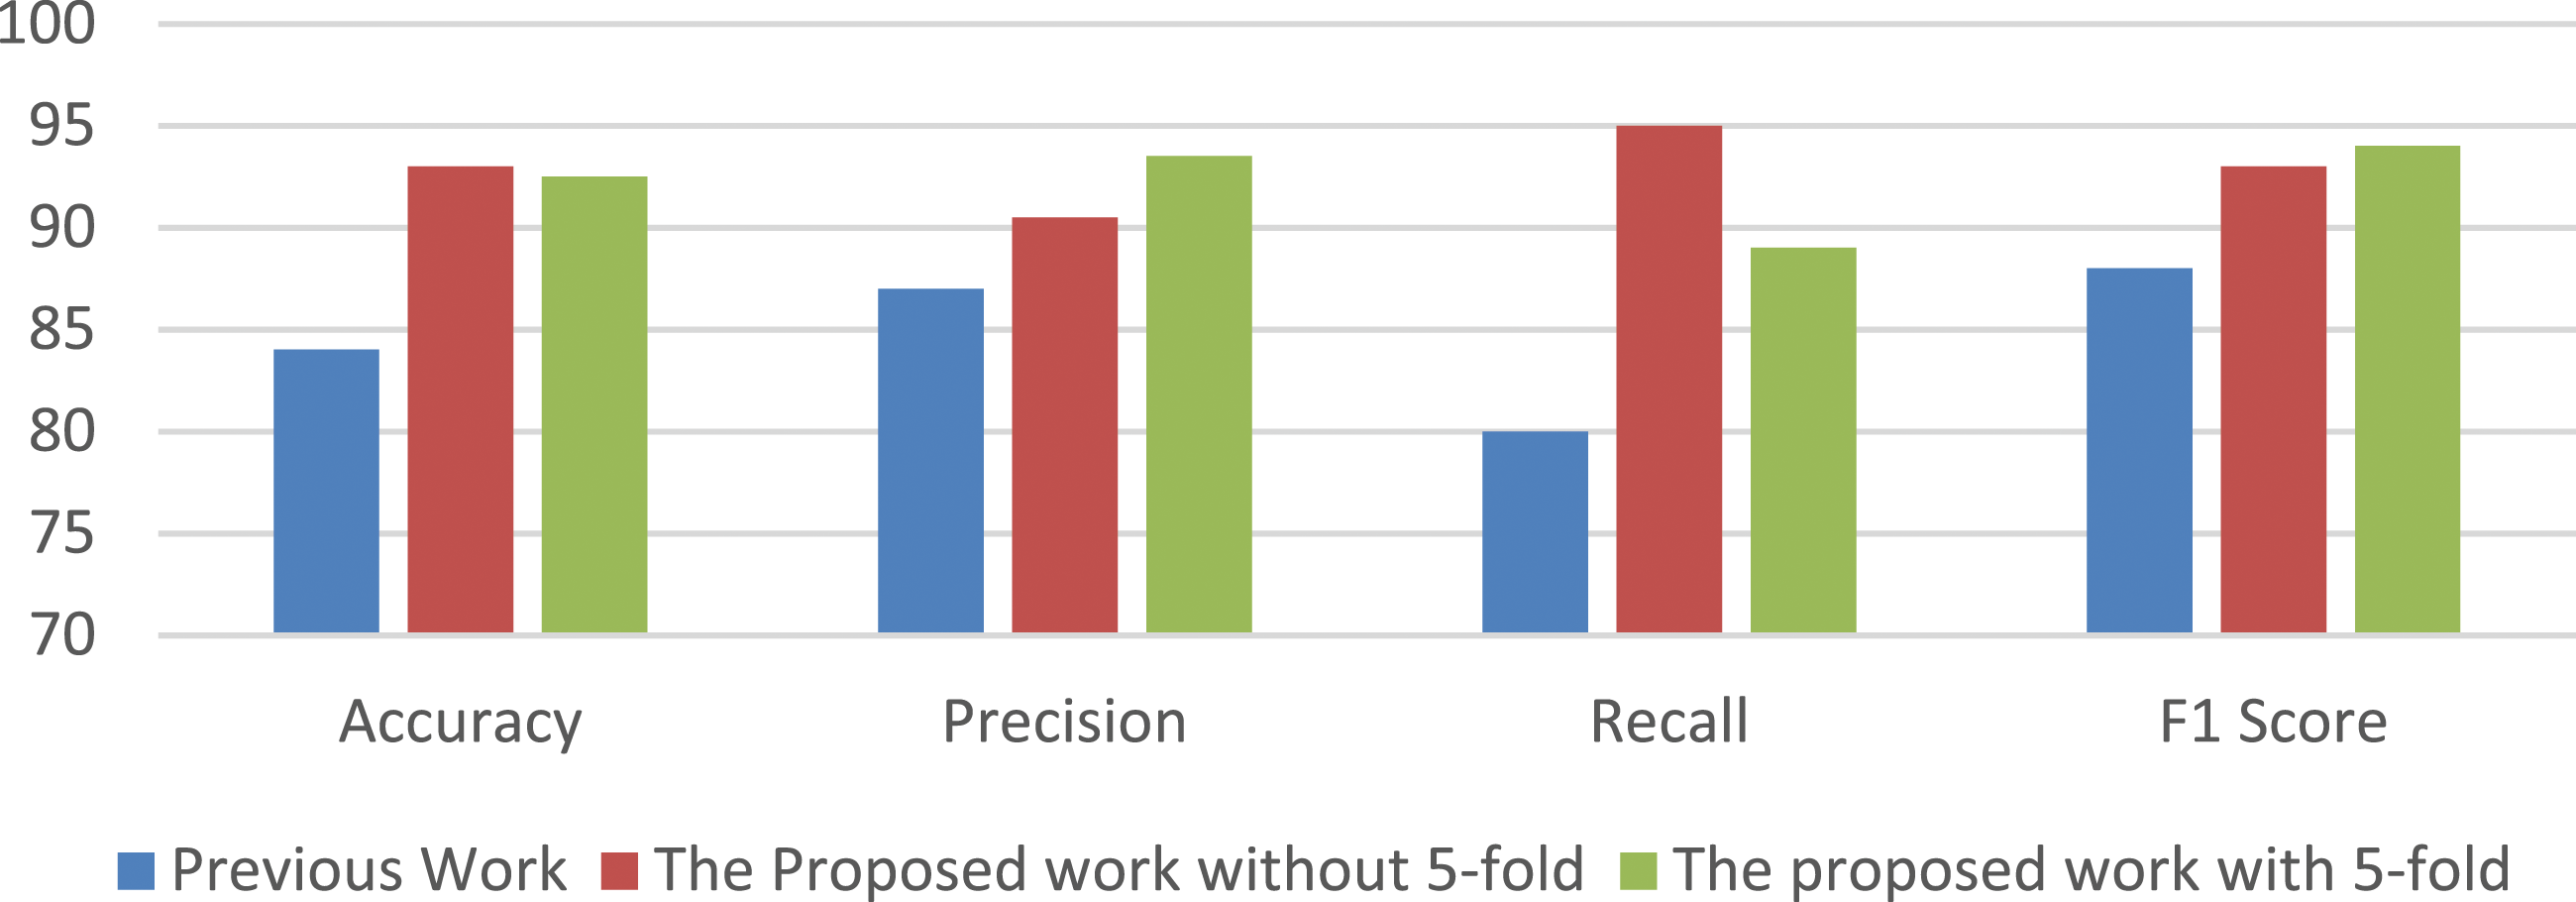
Conclusion
This approach utilizes a combination of feature extraction and classification models to accurately identify and classify the distinction between malignant and healthy bones. To remove noise, a 3 × 3 median filter was applied. The Canny algorithm was used for extracting relevant objects from the data. The texture of diseased bone tissue differs from that of healthy bone tissue, particularly in malignant areas. Malignant bone pixels are more dispersed within the cancerous region compared to healthy bone pixels. Therefore, it is crucial to select effective features that can identify cancerous regions accurately. Previous research has shown that texture characteristics based on the Gray-Level Co-occurrence Matrix (GLCM) are highly effective. However, experimental results indicate that relying solely on GLCM-based features is inadequate. Local cancer prognosis is also influenced by entropy and skewness, with higher entropy levels observed outside the cancerous zone and lower levels within. The Histogram of Oriented Gradients (HOG) function captures the pixel shape and orientation in the image. Through experimentation, it has been observed that incorporating pig features along with GLCM tissue characteristics improves performance, resulting in an F1 score of 91.85%, compared to 86.90% without the use of pig features. Furthermore, the HOG function achieves an accuracy of 91%, outperforming previous studies’ 83% accuracy for cancer detection. To further enhance the system’s speed, different texture selections can be explored.
Therefore, the proposed strategy demonstrates effectiveness in identifying healthy individuals who are at risk of developing cancer and hypertension. In comparison to images of healthy bone tissue, our algorithm performs significantly better when presented with images of bone cancer. This suggests its potential for real-time application to prompt clinicians to reconsider their diagnoses. Furthermore, it is essential to generate a comprehensive dataset in the near future to conduct more thorough performance testing of the model. Optimization techniques such as Moth Search (MS), Elephant Herd Optimization (EHO), Earthworm Optimization (EWA), Slime Mold Algorithm (SMA), and Harris Hawk Optimization (HHO) can be explored as potential methods to enhance the algorithm’s performance.
Footnotes
Author Contributions
This research paper is written by joint contribution of Mukesh Kumar Nag and Dr Abhishek Shrivastava. The complete innovative ideas, and important technical knowledge is equally contributed by the authors. After going through various literature survey and technical support, this paper got compiled by Mukesh Kumar Nag for publication.
Declaration of Conflicting Interests
The author(s) declared no potential conflicts of interest with respect to the research, authorship, and/or publication of this article.
Funding
The author(s) received no financial support for the research, authorship, and/or publication of this article.