
Abstract
Big-data (BD) can contribute to the perceptive layer in the Internet of Things (IoT). BD for environmental factors at the tiny scale has to be obtained by simultaneously monitoring and fusing data collected from multiple sensors. In this study, we designed an intelligent environmental-monitor-control system for the precise culture of grape (Vitis vinifera “Wink”) in greenhouse IoT. Sensors were equipped to obtain multiple types of data, which were then fused at the gateway and stored, analyzed, and modified in the background. Environmental factors included air temperature, air humidity, illumination, soil moisture, and CO2 concentration. Also, videos and images were recorded during the grape growth. The whole system was identified on an online platform with a static IP and a domain name. The fore- and backgrounds were communicated to each other by a real-time connection, and a database was activated whilst the website was open at the foreground. Results indicated that fused data can be successfully stored, transmitted, and treated for dotted graph creation and background management on a self-built online platform. Our study illustrated the availability of data fusion for BD and supplied a feasible instance for the implementation of this technique in IoT for the greenhouse environment.
1. Introduction
Greenhouse farming processes substantially progress in high-efficient uses of water, land, and energy for food and crop production. In this context, the intelligent controlling system based on the architecture of the Internet of Things (IoT) could contribute to a methodology of a better microclimate for crop growth in greenhouses [1, 2]. The microenvironment in a greenhouse consists of several environmental factors, for example, indoor illumination, temperature, relative humidity, and CO2 concentration [3], which together determine plant performance and production. These environmental factors are usually controlled simultaneously to some conscious extents according to the feedback from independent monitors; hence, the precise control of the whole microclimate in a greenhouse is a complicated and comprehensive procedure since the output variables that influence plant physiology run with significant interplay [3]. Unfortunately, current studies on greenhouse environment controlling systems seem to be hindered at the step of one-way data feedback from plant physiology [4], energy cost [5], or wireless sensor networks (WSN) [6].
In general, two layers have been established to enable IoT implementation, that is, the perceptive one and the network one. Therein, the second layer cannot be run as available access until the first layer obtains feasible commencement, which is determined by data collection. Big-data (BD) has been widely accepted as the most available approach to establish the perceptive layer due to its capability for obtaining information [7]. In the area of the environmental monitoring, it has successfully been proven that a BD base can be established according to data collection by large-scale multisensors, that is, RS platforms of satellites, balloons, aircraft, radars, and so forth [8]. However, the application of these kinds of BD could not be referred to by greenhouse condition mostly due to the fact that the regional or even sometimes unit scales forbid data to be accumulated from limited sensors. Therefore, in a given time term, added to the issue of interactive environmental factors, limited data sources aggravate the difficulty of environmental control in a greenhouse according to IoT.
In the network layer of IoT systems, multisensor data fusion issues are often taken as optimization subjects [9]. Thus, in the greenhouse IoT system, data collection is frequently interrupted by exogenous agricultural conditions at the perceptive layer, and data fusion could mostly remedy data lost and detect data interplay. Additionally, only using the fused data could limit the small-scale data from being repeatedly collected at a known greenhouse region so as to enhance database with time instead of that with regional scale. The regional combination of sensors, through WiFi, 3G, radio frequency identification (RFID), near-field communication (NFC), Bluetooth, and so forth, has been proven to allow significantly improved measurement and monitoring methods [10]. Although middleware for facilitating data fusion has been well developed and can be easily equipped in the greenhouse, the application of data fusion with hardware, that is, “hard fusion,” has not been fully known and employed.
In the present study, an IoT system was established in a greenhouse of Nanjing City, Jiangsu Province, China. Therein, regionally collected environmental data were fused in the gateway of the network layer to solve the problems of interactive data but limited database. In order to demonstrate our surmise, online management was designed and applied to present the monitored data and test the availability of data fusion. Additionally, an online platform was established as an instance of implementation based on fused data treatment, transmission, and storage. At the end of this study, we also supplied some comparisons between our implementation and previous ones and meanwhile gave some discussion about the implementation issue.
2. The System Structure Design
2.1. The System Layer Structure
To apply data hard fusion in IoT environments, the full system needs to deal with distributed nodes, decentralized communication, support scalability, and nodes dynamicity, among other restrictions [11]. Therefore, in the present study, the whole system structure is generally divided into three layers, that is, perception, networking, and application (Figure 1). At the perceptive layer, environmental factors within the greenhouse were quantified as parameters and their data results were obtained at sensor nodes. These data include digital numbers, images, and videos. They are the most important informatics for the next work. In our design, the manipulation control module was also involved in the perceptive layer, which functions to execute the treated data results.
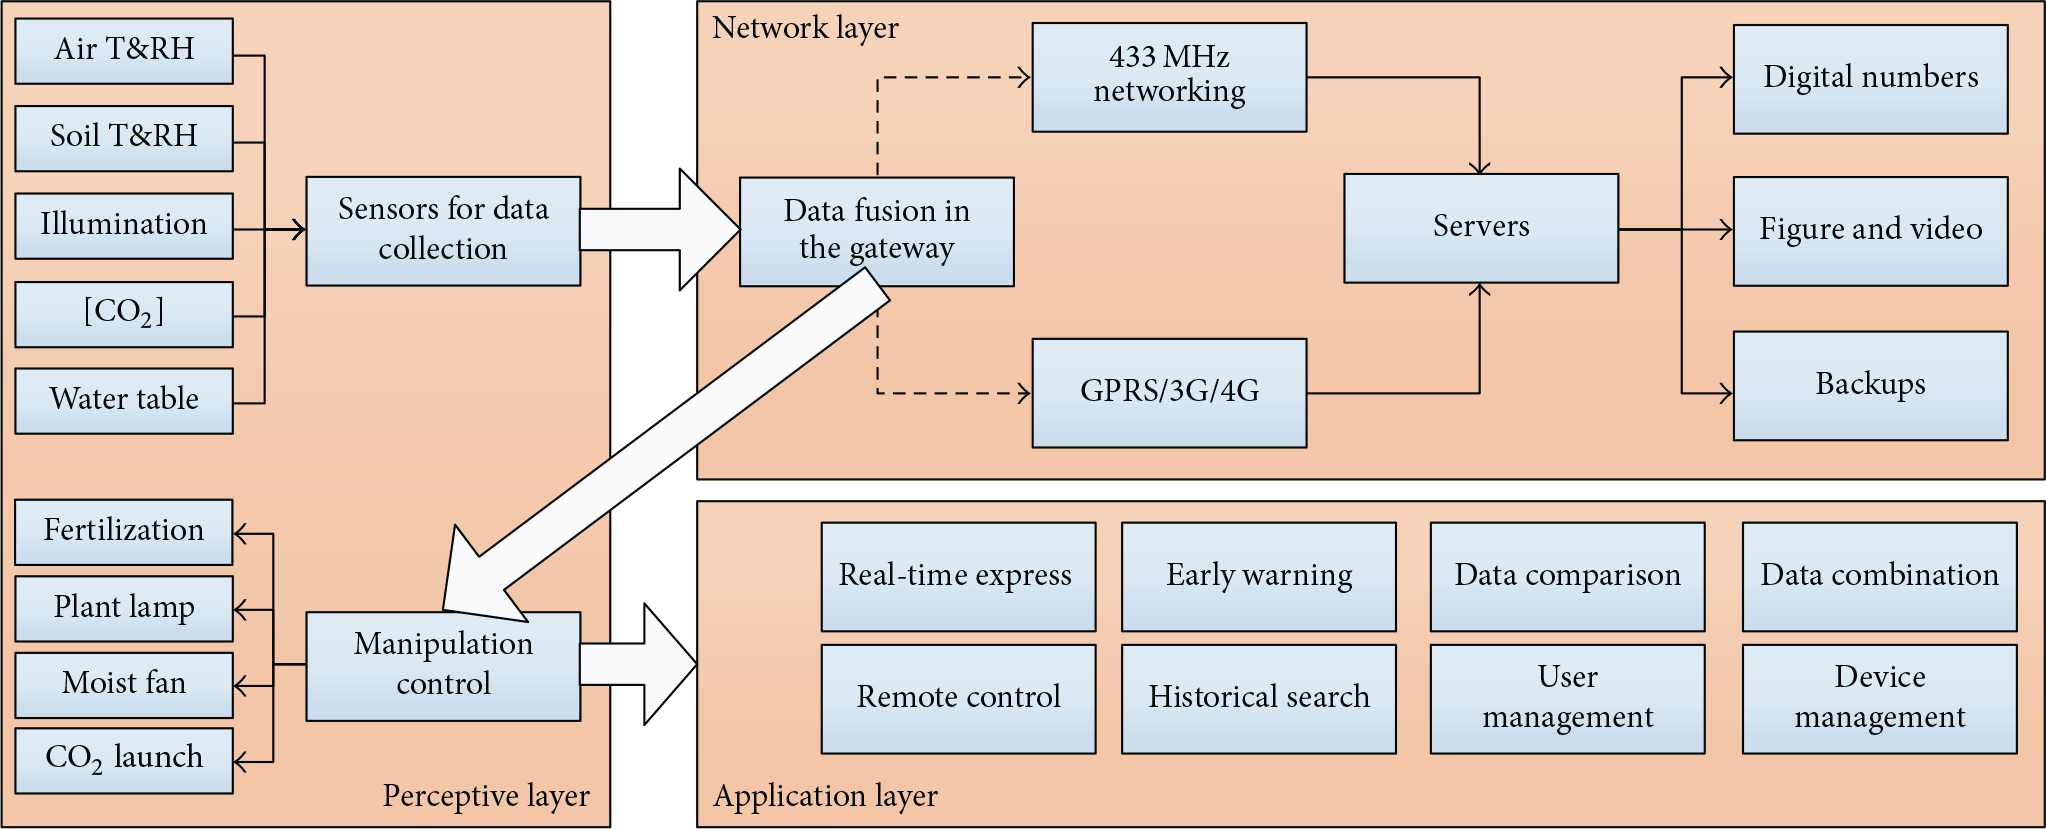
Systematic architecture design diagram.
Due to the complicated demands for and interactive impacts among environmental factors in the greenhouse, the precision of data transmission through GPRS/3G/4G techniques is usually challenged by the miss and loss of data package files. Hence, at the network layer, the gateway transmission is the most critical tunnel through which hard-fused data are transferred to the central server at background, wherein different kinds of data are analyzed and classified into types of figure, video, and backups. These classifications are kept in servers so as to supply stable and efficient data support for the next-step application layer. However, between the processes of the network layer and the application layer, the manipulations to greenhouse operations were involved in the precise control of the environmental factors according to the analysis and classification results.
2.2. The System Function Structure
The system function is taken as interplay between database and web services using collected data. The general system platform includes four parts: background for data collection (BDC), background for web service (BWS), foreground for web service (FWS), and database (Figure 2). BDC directly connects with sensors by sending commands, receiving data, and storing data, and within the BDC process data were able to be hard-fused through remote terminal unit (RTU). At a given term, RTU was set to obtain the collected data from every port and to transmit them to BDC as PID data packages. Because BDC supports not only RTU devices but also other ones, the first step for data treatment in BDC is to screen data to confirm their source from RTU devices (Figure 3). Codes for the algorithm of data screen are written as in Algorithm 1.
function header($buf){ $bytesTmp=$this->string2Bytes($buf); $bytes=$this->originalArray($bytesTmp); $len=count($bytes); if($len<4 ‖ $bytes[0]!=0x7b ‖ $bytes[$len-1]!=0x7d){ return false; } for($i=1;$i<$len-3;$i++){ $tempBytes } $crcLowByte=$bytes[$len-3]; $crcHighByte=$bytes[$len-2]; $str=$this->bytes2String($tempBytes); $crcResult=$this->genCRC($str); $crcResultHightByte=floor($crcResult/256); $crcResultLowByte=fmod($crcResult,256); if($crcResultHightByte!=$crcHighByte ‖ $crcResultLowByte!=$crcLowByte){ return false; } $deviceId=array($bytes[3],$bytes[4],$bytes[5],$bytes[6]); $RTUDeviceId=$deviceId[0]+$deviceId[1]∗256+$deviceId[2]∗256∗256+$deviceId[3]∗256∗256∗256; return $RTUDeviceId; }
Algorithm 1: Data screen and treatment from a RTU device.

System structure of data treatment processes.
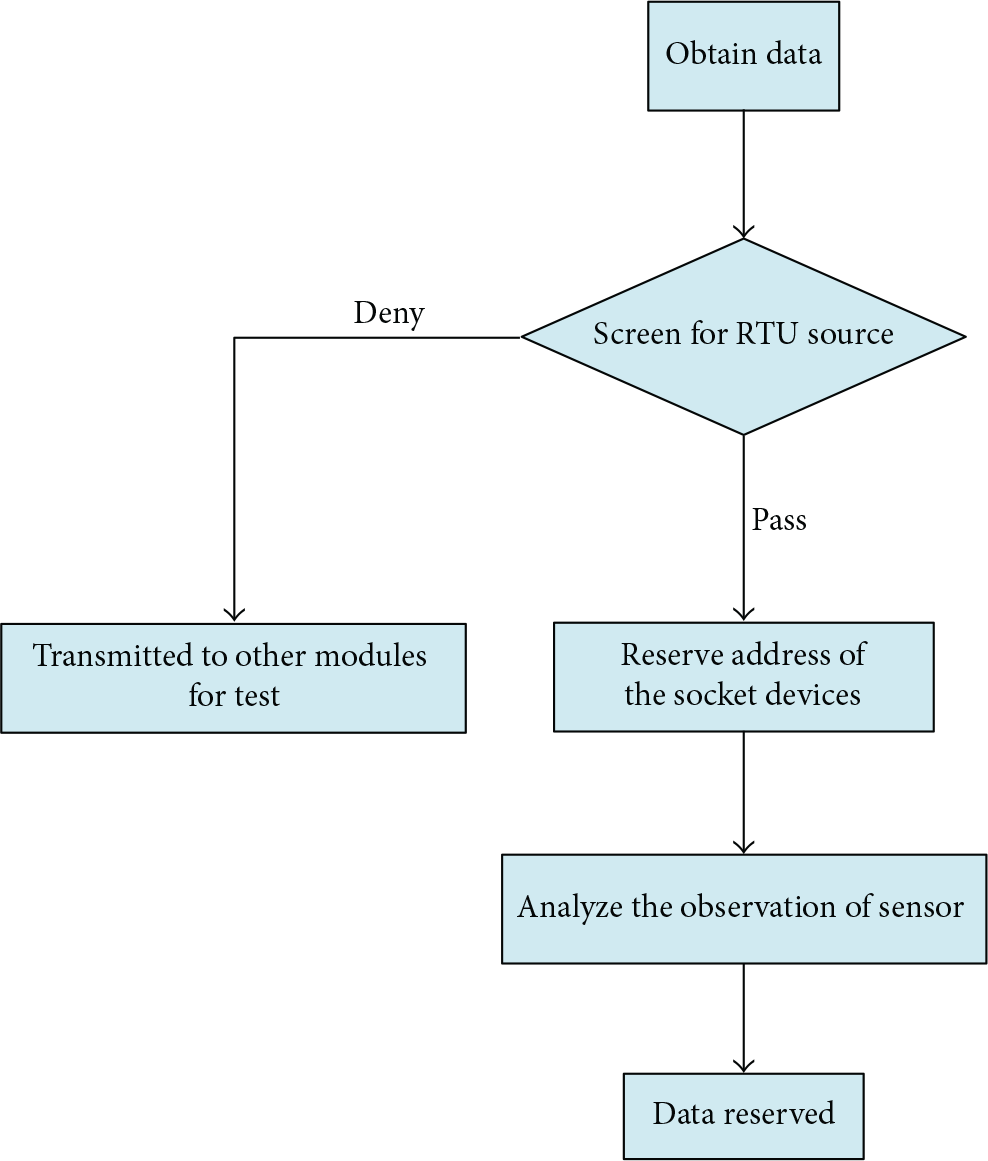
The algorithm of RTU-sourced data screen.
BWS supplies services of data search and treatment for FWS, which supplies operation platform for the user. There are two sources of data for FWS. One source is from web services, which interplays with most requirements. The other source is from data collection background (DCB), which supports the read of real-time data. Otherwise, all commands for controlling are distributed to each of the controlling devices by DCB. Database is shared by both DCB and web services for usage of data storage and data read, separately.
3. Hardware Design
Hardware design is presented in Figure 4. In the present study, the ARM7 CPU was employed as the embedded microprocessor with the core of Cortex-M3 series. Camera was employed as one of the OV7670 imaging sensors. Solar power system was employed because it could supply energy efficiently in the greenhouse environment without artificial power supply, when the output of 5 V voltage could eliminate the potential random error caused by other power supplies.

Hardware diagram.
4. Software Design
The general software was designated to incorporate both data fusion and system security into one system. Thus, the variations of type, function, and design among different sensors made by different manufacturers result in the major difficulty of fusing data towards the mutual base. Although the challenge can be overcome by employing general types of sensors at the same platform, data are still needed to be classified for more than one time before they can be fused at the background stage for the purpose of extension and compatibility of results used for other greenhouse cases. The easiest and most reliable way to conduct data fusion may be available to describe the intermediates among different types of data storage by labeling all data sources at a universal scale.
4.1. Software Running Environment
All software programs were run on Windows 7 System (Microsoft Windows®, Microsoft in China Co., #12 Floor, Microsoft Building, No. 8 Wangjing Street, Chaoyang District, Beijing, China) on a computer (Lenovo®) with Pentium® Dual-Core CPU (E5200@2.5 GHz), 1.70 GHz internal storage, 4G VGA card, and 32-bit operating system. The main programs running for data fusion and treatment were edited using the languages of PHP, CSS, JavaScript, and HTML at the platform of PHP5.2.6 (PHP Group©), MySQL 5.0.36 (MySQL™, Fairview Avenue E., Seattle, WA, USA), and Apache 2.2.16 (Apache Software Foundation, Dept. 9660, LA, CA, USA). Two systems were involved in the software part, and they were divided into web service and background service independently. These two systems contacted each other for communication according to the universal database.
4.2. Establishment of Data Sources
First of all, all probable fields of sensor data transferred through interfaces need to register for background devices at the labeling platform established. Subsequently, after changing all registered isomerous data into a universal data format, all data from different sources, even by different sensor manufacturers, could be fused at the gateway and be ready for data analysis or storage.
There are five stages to describe the properties of sensors before their fusion is available:
Numbering sensor types. Numbering the nodes for collectors in sensors. Numbering the gateways for nodes before collected data are about to be transferred to the background gateway. Numerical values for sensor arrays to describe data collected by different sensors. Available bytes of data collected by sensors to describe numerical values for sensor arrays.
A sensor labeling system was established to register the possible bytes written into the sensors in the adaptor system. Throughout this process, isomerized data collected by different sensors were able to be fused by transforming into one universal type.
5. Case Study of Implementation
5.1. Project Introduction
The whole project was set for the indoor culture of a local grape species (Vitis vinifera “Wink”) under the condition of manually controlled environmental factors with a given direction. The site employed in the project was a 400 m2 rectangle greenhouse with a width of 8 m and length of 50 m, wherein grapes were cultured in four lined beds with a width of 1.2 m and gap of 1.0 m (Figure 5).
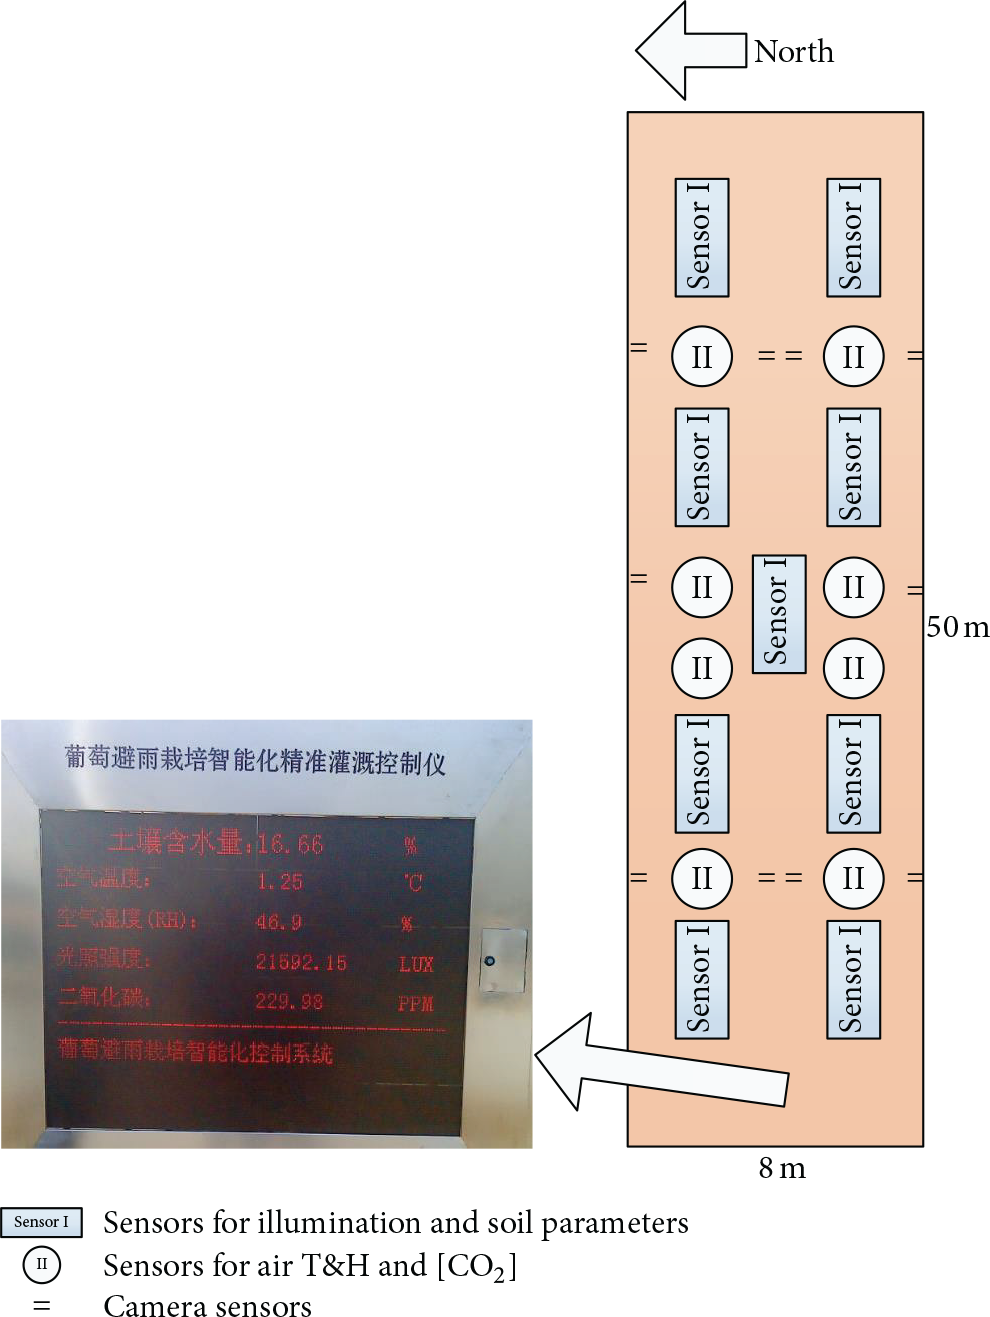
Layout of the greenhouse and sensor placement therein for the test of the design.
5.2. Sensor Implementation
The project was commenced and financially supported by Jiangsu Academy of Agricultural Sciences (JAAS); hence, the directed threshold values were given for four environmental factors: air temperature (AT), air humidity (AH), illumination (Ill.), and soil moisture (SM). In the greenhouse, there were nine sensor groups placed on the ground, including sensors for monitoring Ill., soil temperature (ST), and SM (
According to the protocol of grape culture submitted by JAAS, an indoor condition was suggested to synthesize AT of 15–30°C, AH of 40–70%, maximum Ill. of 2,000 Lx for 2–4 h, and SM of 20–40%. Thus, these parameters change with significant interplay, and the general order of factor regulation was employed as AH, AT, SM, and Ill. In the protocol, ST and [CO2] were not involved in the regulation, but they were indirectly regulated through the changes of SM and Ill., respectively. All absolute values of data supplied by sensors were described and stored with 4 bytes. Sensor implementation was shown in Figure 6.

Sensor implementation design.
Both parameters of AT and AH were monitored by a conjunct senor (SHT11) powered by 5 V voltage, and the responsive time was set to be 8 s with the measuring range of −40~123.8°C and 0–100% RH, respectively. Accuracies for both parameters could be controlled within ranges of ±0.4°C and ±3.0% RH, respectively. Outputs of these two parameter results were totally digital values, which could be seized and stored directly by a device-connected laptop.
The parameter of ST was monitored by a two-wire system PT100 sensor, whose responsive time was set to be 20 ms with the measuring range of −40~60°C. The sensor was powered by 12 V voltage. The accuracy was controlled at ±1°C and data were able to be outputted at voltage of 0–5 V.
The parameter of SH was monitored by the sensor of FDS100 with the responsive time of 2 s. The sensor was powered by 12 V voltage. The measuring range was 1~100% of RH with the accuracy at ±2% and data were outputted at voltage of 0–1.875 V.
The illumination intensity was monitored by the HSTL-GZD sensor, which was powered by 12 V voltage. The responsive time was set to be 30 s with the measuring range of 0–20 W Lx at the accuracy of 7 Lx.
The parameter of [CO2] was monitored by a B-530 sensor with the responsive time of 30 s. The sensor was powered by 12 V voltage. Measures ranged from 0 to 10,000 ppm at the accuracy of 30 ppm.
With regard to results of videos and images, high photosensitivity was requested at a generally mediate light condition. Therefore, the embedded module of OV7670 was employed as one of the CMOS camera sensors which could enable photographing at the low voltage (Figure 7). The module owns standard SCCB and compatible IIC interfaces, which supported VGA, CIF, and all other resolution ratios from 40 × 30 to CIF. The circuit board loaded crystal XTAL and video FIFO with the maximum capacity of 384 KB (3 M bits) which could cache one frame of 640 × 480 (0.3 million pixels) RGB/RAW image so as to facilitate the read of images by the main control trip.

The OV7670 module in the camera sensor.
All data were collected by sensors at the perceptive layer; subsequently, they were transmitted to the gateway located at one corner of the greenhouse through wires at the network layer (Figure 6). In the gateway, different kinds of data were registered and transformed into one universal type for the following fusion and storage and then uploaded to the CPU by SIM communication.
5.3. The Design of Online Platform
An online platform was designed and made to test the fusion and analysis of collected data. The network environment was established by renting informatics space of Baidu Cloud© (Baidu Campus, Shangdi, Haidian, Beijing, China) for a static IP and a domain name. Both background and web services were validated and communicated with each other according to a shared database, wherein data collected by sensors were monitored and invoked at the COM Port of 2046. Remote terminal units (RTU) functioned to upload data through invoking IP addresses and 2046 COM Port to background, which analyzed these uploaded data according to agreed type by data package, so as to facilitate configuration depending on corrective coefficients of each of the sensor addresses. Configured data were able to be reserved into sensor addresses as an equipment list. Original data cannot be stored into the database directly unless they were treated by some appointed strategies by the module of strategy management (MSM). For example, MSM confirmed that a critical value should be the node which determines the switch of appointed greenhouse equipment among a range of sensed data, which would be classified into one strategy and triggered the treatment and storage of data at fore- and backgrounds, respectively. The real-time communication between fore- and backgrounds of the web was implemented with WebSocket (Kaazing©, Suite, San Jose, CA, USA) by real-time connection to background database which was activated whilst a website was open at the foreground.
5.4. The Implementation of Online Management Platform
The platform could be logged in through both PC and mobile devices. In the present study, however, we took the PC platform as our instance (Figure 8(a)). Within the platform system, working statuses of all sensors could be checked for their monitoring dynamic and data transmission. As it is shown in Figure 8(b), the “online” status suggested a well running sensor with data transmitting to the gateway. Specific monitor check could be run by the module of configuration. As it is shown in Figure 8(c), parameters of AT and AH were chosen as examples in one case by clicking their statuses to be “Selected,” leaving others' switch off to be “Un-Selected.” The specific data dynamic could be shown through photographs by an automatic program. In the present study, we chose the “dotted line curve” as the instance and the comparison results in the production region for grapes were presented in Figure 8(d). In our case, AT declined with time throughout the monitoring period from 1:00 to 10:00, but AH increased from 4:00 until 7:00, when a sharp decline was found for both parameters. If we hypothesized these changes to be the inferior environmental factor combination, they can be modified in the configuration module (Figure 8(e)). The final determination of modification ended by a manually inputted equation with monitored data as independent variable and the modified data as dependent variable (Figure 8(f)). The dependent variable could be enabled by controlling equipment in the greenhouse, where, in our case, the modified AT can be enabled by controlling fan moving (Figure 8(g)). As a result, the modified AT declined with time without the sharp decline at 7:00 (Figure 8(h)). The whole dataset can be statistically analyzed for frequency (Figure 9(a)) and distribution (Figure 9(b)).

The interface of implementation of an online platform for the tests of the functions of monitoring, configuration, and control.

The interface of statistical analysis on modified results run on the online platform.
In the background, managers could manipulate the registration as company, area, and user manager (Figure 10). When registering as a company manager, it is only necessary to supply a company name, which was “HUAWEI” as an example in our case (Figure 10(a)). Area manager was in charge for the region of grape regions in the greenhouse, which can be registered following the registration of company manager (Figure 10(b)). The user name was supplied to mark a group of sensors, which had also to be registered after the registration of company manager (Figure 10(c)). Actually, in the system, users can register for device names as the role of “Device Manager,” which have been described in preceding paragraphs and hence were not shown as an instance.
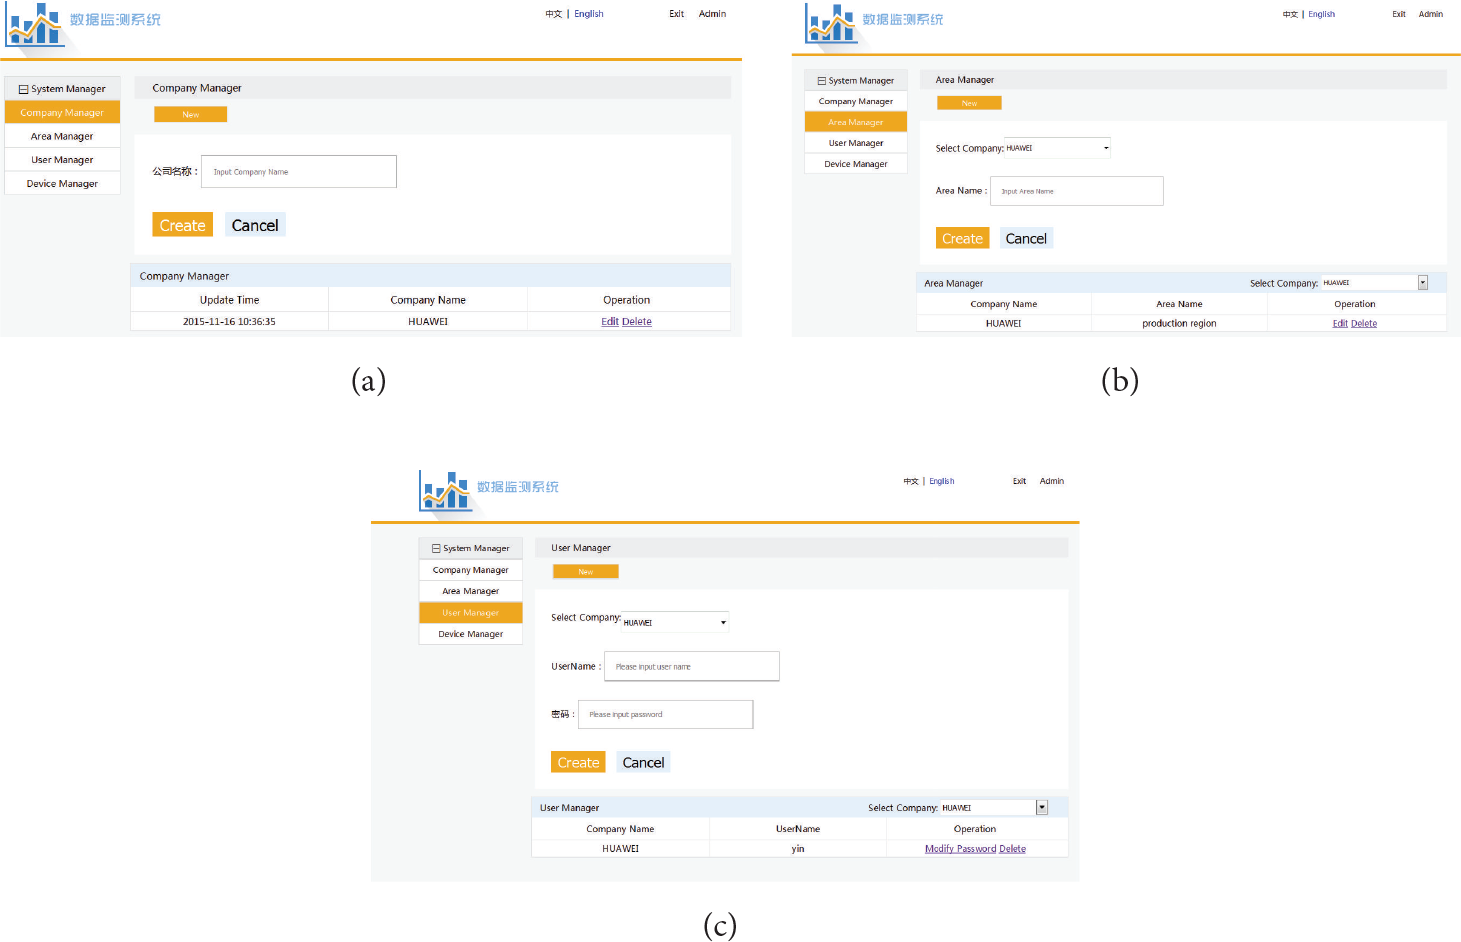
The interface for the manager system at the online platform.
5.5. Discussion and Comparison between Our Implementation and Previous Ones
Typical management of wireless sensors was developed in the 2000s, when the main framework originated with BOSS [12] and MANNA [13]. The BOSS system consists of UPnP controlling nodes, BOSS, and WSN, which are all supported under UPnP protocols. Although WSN in BOSS architecture can be easily connected to other networks (WLAN, IEEE 1394, PLC, etc.) through UPnP, some sensor nodes were not able to support UPnP. This handled non-UPnP sensor nodes like a UPnP device by using BOSS. MANNA divides web management and web implementation into two separated services. According to web models and management functions relevant to current establishment of strategy language, MANNA separated roles of WSN web management into Manager, Agent, and MIB, which are all defined for their functions and locations by functional architecture. In MANNA, information includes two kinds (steady and dynamic) so as to describe web structure through WSN. MANNA was the first management system fusing both traditional web management strategies and the characteristic of WSN, hence promoting the development of WSN management to a great extent. However, due to the absence of accomplishment of several details, MANNA fails to be more employed in current MSN management than it did.
More recent work enhances the system architecture based on originated systems through complementing and improving essential details. For example, based on MANNA, an efficient management system was developed for wireless sensor networks with the enhancement of configuration management in MANNA architecture [14]. The main function of the performance analysis facilitated convenient management of sensors, wherein the experimental results showed that the proposed method enhanced the alive rate of an overall sensor node system and reduced the packet loss rate by roughly 5% and reduced delay time by roughly 0.2 seconds. In that study, although configured data were also able to be employed for the generation of plot curves on the interface, communication between BWS and FWS and the user experience (UE) seemed to be insufficient. Additionally, the data fusion process therein seemed not to be efficient. In another study, an integral intelligent system for the diagnosis and control of tomatoes diseases and pests (JAPIEST) enhanced the communication between BWS and FWS and involved the database module [15]. Also, the JAPIEST system enhanced UE by adding selection and strategies in the system based on videos and images, and it could be possible to provide automated hydroponics greenhouses with cooperation and autonomy capabilities in order to share information and knowledge for the maintenance of healthy crop production cycles. However, authors therein indicated that some extensions can be targeted to the online supervision and management of greenhouse controlling, nutrient feeding, main production, recollection, packaging, and delivering. Additionally, the unique variable of disease evaluation limits the necessity of data fusion, although this process is necessary for the system function extensions. In contrast, a system of context-aware middleware for ubiquitous greenhouses made multiple sensor-collected data visualized and fused in a U-Greenhouse Integrated Management System (UGIMS) [6]. However, the UGIMS failed to contribute enough effort to web services.
Recent instances of implementation pay more attention to hardware system due to the development of robot techniques and the goal of designs is targeted more towards current global issues, such as energy and artificial intelligence [4, 16]. For example, a speaking plant approach technical system (SPATS) was implemented to predict poststorage production of tomatoes through supervising preharvest fruit chromaticity based on the mechanism of chlorophyll fluorescence prediction of dormancy depletion of carbohydrates [4]. Thus, the implementation of these kinds of systems appeared to be not necessary to cooperate with online system; the supervision and decision strategies, however, can be enhanced if they were applied with data configuration and analysis.
Hence, comparing to former studies with instances of WSN implementation, our system presented in this study shows three apparent advantages:
Depending on the hard-fusion technique for sensor-collected data, it is easy and simple to record and treat data without any protocol limits. The communication between BWS and FWS at an online platform facilitates the next-step data analysis and fit-curve production, especially under the circumstance when a great set of data were collected in a short term. Although we can handle issues of both data analysis and strategy decision on interfaces of the implementation system at the same time, most results from data treatment and analysis are managed and visualized automatically, which can be taken as some kinds of robots as well.
6. Conclusion
According to our design, data from different sources supplied by different sensors were able to be transmitted, stored, and analyzed as a universal type after fusion at the gateway. This can be valid through series of registrations. According to our design, the whole process was tested at an online platform, which was established by ourselves, and results fully proved our design to be available through the manipulation modules of monitoring, configuration, and modification. Also, fused data could be directly statistically analyzed and shown as photographs. Our study supplied valid implementation of data fusion manipulation for good resolution of data treatment from different sensor sources. Based on our study, future work can incorporate more environmental factors by more developed sensors for better precision of environment control in the greenhouse.
Footnotes
Competing Interests
The author declares that there are no competing interests regarding the publication of this paper.
Acknowledgments
This work was financially supported by the Foundation Program for Independent Innovation in Agricultural Sciences and Techniques (Grants nos. CX (13) 5066 and CX (14) 2108). The author hereby expresses many thanks.