
Abstract
Partial discharges are the major cause of deterioration in the insulation characteristics of switchgears. Therefore, timely detection of partial discharge in switchgear and potential insulation faults is an urgent problem that needs to be addressed in the power supervision industry. In this study, a device was proposed for online monitoring of high-voltage switchgears based on pulse current method and ozone (O3) detection. The pulse current method obtains the PD signal by monitoring the phase holes on the switch indicator. Occurrence of a partial discharge in a certain phase leads to the production of a discharge pulse, which can be coupled out by a capacitive sensor. The current spectrum and the O3 produced by partial discharge were processed via fast Fourier transform for accurate diagnosis of the occurrence of partial discharge and its severity in switchgears. The proposed method allows for convenient acquisition of the partial discharge signal, simple installation of the device, and realization with inexpensive sensors.
Introduction
The rapid growth of infrastructure and energy consumption has led to a significant increase in electricity consumption and expansion of power systems. In order to ensure safe and reliable operation of power systems, higher standards are required for their supporting monitoring equipment. Grids need a large number of high-voltage switchgears to operate, and ensuring their safety forms the basis of reliable grid-operation. 1 The main cause of accidents related to high-voltage switchgear is insulation fault and it remains an urgent problem that needs to be addressed. 2
Switchgear is a critical component of power plants that helps in closing and breaking the current, transmitting and replacing the power loads, isolating the faulty equipment or line, and finally ensuring the safe operation of the power system. In practice, many other components such as the circuit breaker, knife gate, bus bar, and insulators are integrated into the switchgear cabinet, which leads to a complex internal structure with narrow gaps between devices. This poses a major challenge in terms of providing robust insulation to prevent failures. Open designs are more vulnerable to gas pollution in gas-insulated switchgear (GIS) and other equipment, and involve a higher risk in terms of safe and stable operation of switchgear. For instance, it was found that insulation faults were responsible for 40.2% of all faults in 6–10 kV switchgear accidents in Chinese power systems from 1989 to 1997. Among insulation faults, 79% were caused by flashover.3–5
There are strict requirements for the insulation characteristics of high-voltage electrical equipment; however, insulator defects such as impurities, spikes, and bubble gaps can be introduced due to the production process or material limitations. The strong electric field generated due to high voltage cannot get uniformly distributed in this insulator. As a result, the electric field intensity in the defective part becomes relatively strong leading to a partial discharge (PD). Typically, a single PD cannot break down the insulator. However, with the increase in the number of PDs, the insulation characteristics are degraded and can lead to more frequent PDs, which eventually causes breakdown of the insulator. On this premise, online monitoring of PD in high-voltage switchgear can effectively predict the insulation characteristics of the device, prevent power accidents, and warn about the faults in high-voltage switchgear. The stable operation of a power grid cannot be considered separate from that of the reliable high-voltage switchgear. Moreover, the online monitoring of PD can effectively prevent power accidents caused by insulation problems of high-voltage switchgear, which helps in more efficient maintenance and repair of high-voltage switchgear by trained personnel, eventually improving power quality. Therefore, this study offers good social and economic value and has important scientific significance for online monitoring of insulation characteristics of high-voltage switchgear. 6
In order to improve insulation fault detection efficiency, the PD phenomenon should be observed overtime, which reduces a lot of manpower and material resources invested in manual inspection. 7 This study proposed a PD online monitoring method for gas and electricity combined high-voltage switchgear. In this method, three-phase PD voltage signals are collected from the three core phase holes of the live display based on the capacitive partial voltage principle. The low-frequency signal is filtered out through high-pass filter circuit. The discharge pulse signal is collected using a high-speed analog-to-digital conversion (ADC) integrated circuit, and the PD voltage time-domain waveform and its spectrum diagram are drawn to judge the high-voltage switch on. In order to improve the accuracy of judgment, a gas sensor was installed in the high-voltage switch cabinet to collect the acoustic signal generated by PD, which was further processed to obtain an acoustic spectrum diagram. In order to meet the power supply company’s requirement of double verification to prevent misjudgment, the waveform and spectrum of signal were comprehensively used to judge the PD of high-voltage switchgear. 8
Measuring principle of PD pulse current method
The pulse current method is an effective method for PD detection. This method involves a measuring capacitor, a coupling capacitor, and an impedance detector to measure the PD. When PD occurs in the measured capacitor, the voltage at both ends of the capacitor drops instantaneously. At this time, the voltage at the two ends of the coupling capacitor is still maintained at the level prior to the PD. Thus, the coupling capacitor discharges to the test capacitor through the impedance detector, and the discharging current in the circuit forms a pulse voltage on the detection impedance. The charge can be obtained by detecting the pulse voltage by the ADC circuit. The pulse current method uses a higher frequency band of PD spectrum, typically in the range of hundreds of kHz to several MHz, to avoid radio interference, thus, this method offers high sensitivity. The known pulse can be introduced into the test circuit for calibration, and the actual discharge pulse is compared with the calibration pulse to obtain the discharge quantity Q.
The basic measuring circuit for the pulse current method is shown in Figure 1.

Basic circuit for PD measurement: (a) a parallel measurement loop, (b) a series measuring loop and (c) a bridge -type measuring loop.
In the circuit, Cx is the test capacitance, Zm(Zm′) denotes the measuring impedance, and Ck is the coupling capacitance, which provides a lower impedance channel between Cx and Zm. The impedance Z represents a low-pass filter between the power supply and the measurement loop, and allows the power-frequency voltage to act on the test, while blocking the high frequency of the power supply.
Figure 1(a) shows a parallel measurement loop, where a test voltage U is applied to test sample Cx by Z. The measuring loop is connected in series with Ck and Zm, and is parallel to Cx. The PD pulse on the sample is coupled to Zm through Ck and is sent to the measuring instrument M through amplifier A. This measuring circuit is suitable for testing when one end is grounded, and is a practical approach in realistic applications.
Figure 1(b) exhibits a series measuring loop. The measuring impedance Zm is connected in series between the Cx low-voltage end and the ground, and the discharge circuit is formed through Ck. Therefore, the low-voltage ends of the test products must be insulated from the ground.
Figure 1(c) shows a bridge-type measuring loop, also known as a balance measuring loop. The test Cx and the coupling capacitance Ck are all insulated from the ground. The measured impedance Zm and Zm′ are connected between the low-voltage terminal and the ground of Cx and Ck, respectively. The voltage difference between Zm and Zm′ is measured by M.
The advantage of the pulse current method is that it can quantitatively measure the PD through the unified calibration and detection process specified by IEC 60270 9 and accurately obtain the apparent discharge amount of PD. However, the operating equipment cannot automatically carry out the calibration operation specified in IEC 60270, and it is difficult to resist interference, thus, the pulse current method can only be used in the off-line test, such as preventive test and factory test. Furthermore, this method cannot be used for PD detection of GIS equipment. Therefore, in this study, an online monitoring device for PD was designed and evaluated. This device can obtain the PD voltage signal directly from the point display and phase test hole or port of the high-voltage switchgear. The high-frequency voltage signal was collected directly from three-phase core phase hole or port to judge whether PD occurs in the high-voltage switch cabinet. The connection method and equivalent circuit of capacitance coupling method in the monitoring device are shown in Figure 2.

Schematic illustration of pulse current method based on checking phase holes.
Through this technology, the PD information of high-voltage switchgear can be obtained without the use of a monitoring sensor. The entire monitoring device is cost-effective and easy to install; therefore, it is practical to implement it as an online PD monitoring device.
Principle of ozone detection method
Principle of PD producing ozone
PD in switchgear is mainly caused by internal discharge (air gap discharge). This is attributed to the fact that the insulator can develop air gaps, cracks, bubbles, and other defects due to the manufacturing process or long-term operation. Moreover, the dielectric constant of gas is often smaller than the dielectric constant of solid materials. Under an alternating electric field, the distribution of electric field intensity is inversely proportional to the dielectric constant. Therefore, when an air gap or bubble exists in the medium, the electric field intensity inside the defect is higher than that in the surrounding medium. Furthermore, the breakdown field strength is much lower in the gas compared to that in the solid. Thus, the air gap gets first broken down to discharge, while other regions in the dielectric are still in an insulating state, thus forming a typical PD. Moreover, impurities can alter the distribution of electric field, causing an accumulation of electricity to produce discharge. This discharge process can ionize the air to produce O3. At present, four types of general-purpose gas sensors are used, including semiconductor type and electrochemical type. This study employed a gas sensor with good sensitivity to O3 in a wide range of concentration, and offering the advantages including long life, low cost, and simple driving circuit.
Existence of air gaps or bubbles in insulating parts can be modeled as illustrated in Figure 3. The AC high voltage introduced in the insulator is equivalent to that of the high-voltage electrode, which is adjacent to the insulating material, and the discharge air gap can be equivalent to the bubble or air gap in the insulator.

Schematic illustration of O3 produced by air gap discharge of insulating material.
When the applied alternating voltage is sufficiently high, the electric field intensity established in the air gap imparts high energy to the electrons in the air gap. Furthermore, these energetic electrons collide with oxygen molecules causing ionization, which breaks down the air gap and forms a large number of micro-discharges. After three body collisions, oxygen atoms combine with oxygen molecules to form O3. 9
During PD of insulators, the generation of O3 by ionized air is a very complicated process, which mainly includes discharge ionization process and a series of chemical processes in discharge gap. The formation of O3 can be divided into the following three steps:
1. The electric field in the air gap increases with the applied alternating voltage, and the strong electric field in the air gap produces high-energy electrons.
2. High-energy electrons collide with oxygen molecules to decompose them into oxygen atoms

3. Oxygen molecules and oxygen atoms undergo the three body collisions to produce O3

In equation (2), M is the third body.
Relationship between PD and ozone
Charge exchange caused by PD in air gap of insulators is inevitably reflected on the surface of insulators. The classical three-capacitor equivalent circuit can be used to analyze the discharge process. Figure 4(a) shows a simulated flat capacitor with an air gap in the medium. Figure 4(b) presents that Cc and Rc represent the capacitance and resistance inside the small air gap of the insulation material, respectively; Rb and Cb represent resistances and capacitors in series with air gaps, respectively. Ra and Ca represent other media besides b.

Equivalent diagram of PD in single air gap: (a) schematic illustration of analog flat capacitor and (b) three capacitance equivalent circuit.
The duration of PD is short; thus, the discharge process is manifested as a high-frequency pulse signal. When the signal is responding to the equivalent circuit, it can omit the resistance and only consider the capacitance. When the AC voltage is applied to the electrode of the plate capacitor, the voltage is divided by Cb and Cc which varies with the applied voltage. During the discharge process, positive and negative ions are separated from the gas, and migrate to the air gap wall under the action of an external electric field. This results in the generation of an internal voltage Uc, which is opposite to the direction of the applied electric field. 10
The apparent discharge charge

The duration of a discharge is very short (∼10 ns), far less than the charge and discharge constant of the power supply circuit. Therefore, it is considered that the power supply does not play a role in charge transients during discharge. Assuming the discharge causes the voltage change on

From equations (3) and (4), we obtain the charge quantity of

Discharge energy W is the energy released by a PD in an air gap, as shown in equation (8)

O3 is a chemical by-product of PD and is positively correlated with discharge energy. The higher the discharge energy, the higher the concentration of O3 generated.
The following conclusions can be drawn:
The greater the PD in the air gap, the higher the O3 concentration.
The more serious the PD, the higher the voltage in the air gap and the more the production of the O3 gas.
By measuring the concentration of O3, the presence of cracks in insulating parts can be judged; and the higher the concentration of O3, the more serious the PD defects.
When the concentration of O3 in air is below 20 ppb, it is considered to be almost negligible. Owing to the small volume and relative airtightness in the switchgear, O3 can be stored for a period of time which is helpful for the sensor to measure. Considering the accuracy of the existing O3 sensor, the warning concentration of O3 gas in the switchgear is set at 20 ppb.
Principle of fast Fourier transform
The analog signals detected with O3 sensors are usually converted into digital signals; therefore, they are discrete, which are ideal for applying discrete Fourier transform (DFT). The fast Fourier transform (FFT) can significantly reduce the computation burden, thus the memory occupied by the data are greatly reduced. The DFT of the sequence x(n) with the length of N point is

where
If the continuous signal
Frequency resolution:

In equation (8),
Hardware circuit design
The PD monitoring device for high-voltage switchgear collects signals through field programmable gate array (FPGA). After processing, the data are displayed on a liquid crystal display (LCD) screen. At the same time, the data can be uploaded to the background monitoring center for real-time monitoring and data query. The main circuit includes three high-speed signal acquisition circuits, FPGA, STM32 microprocessor, display module, micro SanDisk (TF) card memory module, RS485 communication module, key module, and power module. The overall system diagram is shown in Figure 5.
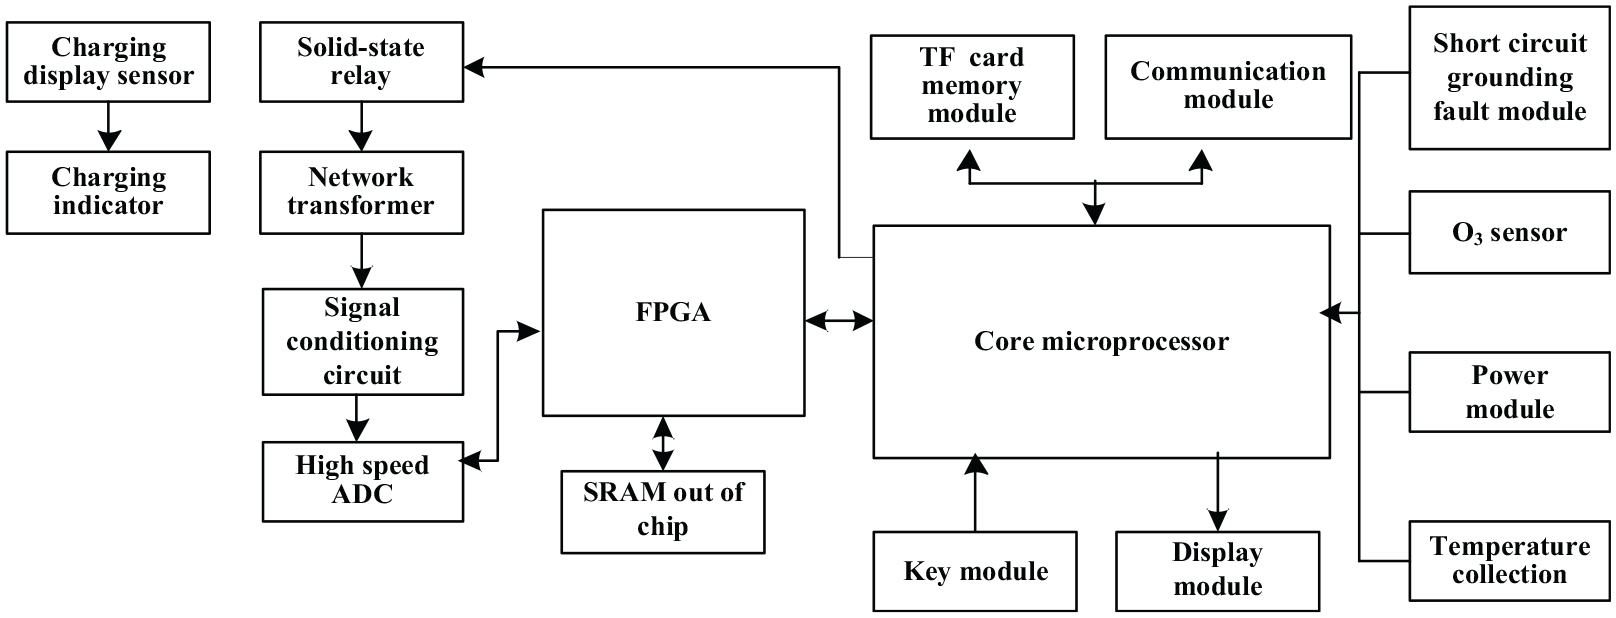
Overall system diagram of PD monitoring device for high-voltage switchgear.
After the voltage signal is coupled from the live display sensor of the high-voltage switchgear, the high-frequency PD pulse voltage is small and the power-frequency AC voltage is between 50 and 200 V. Owing to the limitation of input voltage range of high-speed ADC, a network transformer with band pass from 100 kHz to 100 MHz is used to filter out low-frequency power-frequency voltage, thereby retaining the high-frequency PD pulse voltage. The PD pulse frequency is between several hundred kHz and several MHz. According to the Nyquist sampling theorem, a high-speed ADC with a 50-MHz acquisition rate is selected to meet the requirements.
Design of PD high-speed acquisition circuit
The PD time of high-voltage switchgear is at the μs level; therefore, the complete PD signal can be sampled without distortion by sampling at 50 MHz. The PD voltage is generally greater than the mV level, thus a 12-bit ADC is sufficient for sampling the signal. First, the voltage measured by pulse current method needs to be preprocessed to meet the input requirements of ADC. A high-speed operational amplifier UD2 follows and offsets the input voltage. The following part guarantees that the input low-impedance signal can be collected using the UD1 without attenuation. AD9226, being a single power supply, needs to use the reference voltage to shift the input signal upward to meet the standard of ADC acquisition. Operational amplifiers U2A and U2B follow the reference voltage VREF1 provided in AD9226 to improve the load-carrying capacity of the reference voltage and offset the input PD voltage by a voltage reference of 2 V. Figure 6 shows the schematic representation of the high-speed acquisition circuit for PD.

High-speed acquisition circuit for PD.
Design of ozone sensor
The O3 sensor utilizes an MQ131 gas sensor (Figure 7), and it can measure concentrations in the range of 10–1000 ppb. The schematic illustration of MQ131 O3 detection sensor is shown in Figure 8. The packaged gas sensor consists of six needle pins, four of which are used for signal extraction and the remaining two for providing heating current. The base of the element is provided with a round hole. If the gas and air in the element exchange well, the element exhibits higher sensitivity and faster response and recovery speed.

Schematic illustration of MQ131 O3 detection sensor.

PWM of DC-level circuit diagram.
The MQ131 sensor consisting of a miniature Al2O3 ceramic tube, a composite metal oxide sensitive layer, a measuring electrode, and a heater is fixed in a cavity made of plastic or stainless steel. The heater provides the necessary working conditions for the gas sensors.
The output of O3 sensor is a pulse-width modulation (PWM) wave of 1-kHz frequency with dissimilar duty cycle, and the duty cycle is related to the O3 concentration . After the PWM of DC-level circuit, as shown in Figure 8, the final voltage is collected by the ADC of the microprocessor. The O3 concentration can be obtained from the calibration curve shown in Figure 9.

Relationship between voltage and O3 concentration.
Software design of online monitoring device for high-voltage switchgear
The microprocessor (STM32F407ZGT6) first initializes the settings of the monitoring system, including LCD screen, three-phase temperature measurement module, one-channel ambient temperature measurement module, two-channel O3 monitoring module, key module, and grounding fault module. After a series of initialization settings, the microprocessor begins to collect real-time data of the two O3 sensors in order to diagnose the severity of PD. Its core part involves the PD pulse waveform acquisition and the microprocessor sends instructions to the FPGA to open the acquisition mode. The FPGA stores the three-phase PD signal data into an SRAM and then sends the acquisition signal to the microprocessor. After receiving the signal collected by the FPGA, the microprocessor transmits the collected data from the SDRAM to the processing array of the microprocessor by switching on the Flexible Static Memory Controller (FSMC) communication mode. At this point, the array is preprocessed to determine whether the PD has occurred. If the program detects a PD pulse waveform, the FFT program is utilized to process it and then the waveform or spectrum is displayed on the LCD screen according to the button selection. This completes the PD acquisition and the process is repeated. The flowchart of the system for the online monitoring device of the high-voltage switchgear is shown in Figure 10.

Software flowchart of combined online monitoring device for high-voltage switchgear.
The software system of the device consists of the following components:
LCD display: displays the main interface, three-phase pulse waveform acquisition curve, three-phase pulse waveform spectrum, and two channels of O3 concentration value;
Return of the key value of the touch screen: through the operation of the touch screen, the minimum peak value of PD pulse, the alarm value of O3 concentration exceeding the limit, and the local address number can be set; and the corresponding key value of the touch screen can be returned;
Data acquisition: microprocessor and FPGA collect PD signal through high-speed ADC;
Central control: the alternation order between modules is defined and a crash is prevented;
Time acquisition: the internal clock module of the microprocessor is controlled and the time value is read according to the need;
Serial communication function: this function is used for designing the serial driver, evaluating the received control commands, and uploading the corresponding data. The transmitted data should be convenient for the upper computer programming and the cyclic redundancy check is used to ensure the accuracy of the data.
Performance test
Under the experimental environment and using the equipment of Jiangsu Provincial Key Laboratory of Power Transmission and Distribution Equipment Technology, the test experiment of high-voltage switchgear gas-electricity online monitoring device was completed, and the system model was setup as shown in Figure 11.

Physical model of the PD test system based on pulse current method.
The specific test facilities include a 10-kVA/100-kV power-frequency PD test stand, an isolation filter, a 12-kVA/125-kV power-frequency test transformer, a 125 kV-12 kΩ resistor, a 125-kV/550-pF non-PD capacitor divider, and a CG3-12/140 tower type electrical indicator sensor. The physical model of the laboratory is shown in Figure 12.

Schematic illustration of PD test system.
This experiment simulates a 10-kV high-voltage switchgear discharge and a non-discharge situation. The 10 kV is the line voltage of three-phase electric power; therefore, one end of the PD online monitoring device was grounded, so the actual detection was the phase voltage of three-phase power, and the voltage should be set as
When the voltage reaches 5.77 kV, the coupling capacitor is set to discharge to the ground. An example of the PD waveform and spectrum of the device are shown in Figures 13 and 14.
When the boost voltage reaches 5.77 kV, the coupling capacitor is setup without discharging. However, the coupling capacitor itself discharges slightly to the air at the connection, which leads to the detection of a weak PD waveform. In this case, the PD waveforms and spectra are collected from the device as shown in the example of Figure 14.

Waveform and a spectrum map after the FFT when PD occurs: (a) waveform of a phase and (b) spectrum of a phase.

Waveform and a spectrum map after the FFT without PD: (a) phase waveform and (b) phase spectrum.
From the analysis of the two sets of data presented in Figures 13 and 14, the following conclusions can be drawn:
The discharge of waveforms to the ground prove the validity and discharge waveform reproducibility of the device.
The non-PD waveforms show that the device can sensitively collect slight air discharge waveforms without PD.
The two sets of data shown in Figures 13 and 14 prove that the device can effectively collect the PD waveform and spectrum of high-voltage switchgear.
The LCD monitor TJC4827K043 used in monitoring integrates a variety of controls and page windows, as shown in Figure 15. The user interface (UI) design process is completed on the PC and then downloaded to the touch screen. The main interface includes six options: O3 concentration, three-phase waveform, spectrum, alarm concentration, and other options.
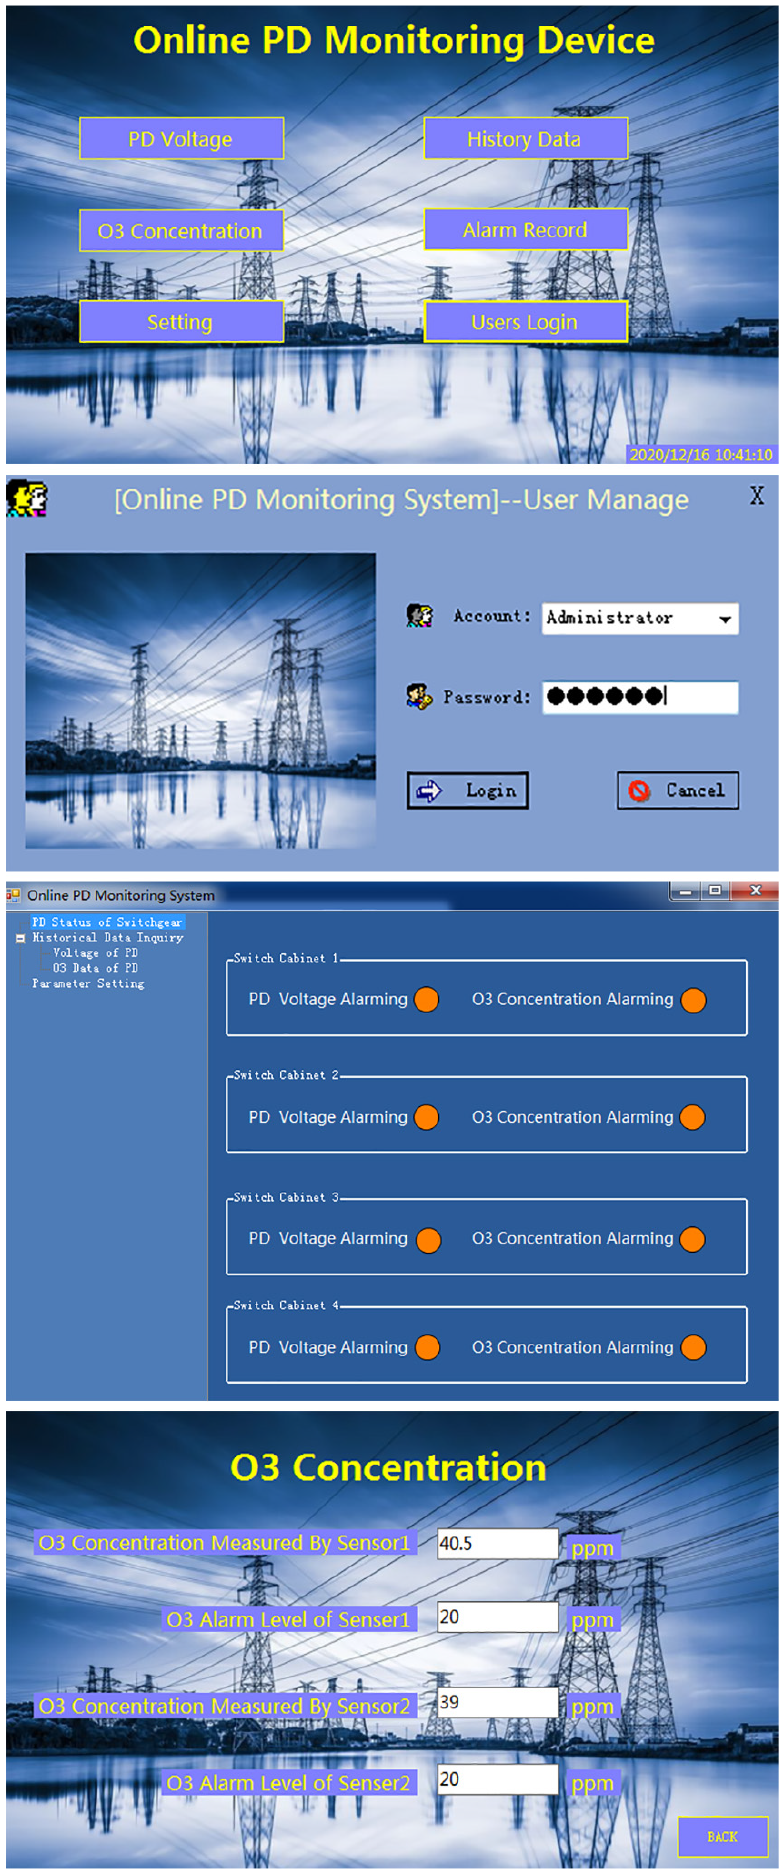
UI display effect of touch screen main interface.
Owing to the type and operating conditions of the air insulated switchgear, the O3 generated by the discharge in the compartment remains in a relatively closed space for a certain period of time, and its molecular weight is greater than that of the main content of air. Oxygen and nitrogen accumulate at the bottom of the compartment. Therefore, the O3 sensor should be installed at the bottom of the switch cabinet, as shown in Figure 16.

On site installation drawing of PD online monitoring device.
Conclusion
In order to overcome the disadvantages of traditional PD monitoring methods for high-voltage switchgear, such as the high cost of manual inspection, high requirements for the quality of operators, and unable to carry out large-scale monitoring, this study proposed combining gas and electricity online monitoring devices for high-voltage switchgear. Furthermore, an online monitoring device was designed based on pulse current method and O3 transmission. The PD online monitoring technology of high-voltage switchgear was realized using the inductor:
The traditional pulse current method is based on the current pulse from the capacitors at both ends of the switch cabinet, which has high cost and cannot realize online monitoring. The method proposed in this study collects three-phase PD voltage signals from the three core phase holes or ports of the live display using the capacitance sensor equipped with the live display of the high-voltage switch cabinet, and provides the internal discharge information of the high-voltage switch cabinet using the principle of capacitive voltage division.
The gas sensor is used to measure the PD of switch cabinet. O3 detection method is not affected by external electromagnetic environment and ultrasonic signal, and offers obvious advantages for abnormal PD in switch cabinet.
The combined method of gas and electricity does not need expensive sensors, which can effectively reduce the cost of online monitoring device and make it easy to promote its use. Thus, it is of great significance to timely detect the PD phenomenon of high-voltage switchgear and ensure the safety of power supply system. In this study, the online monitoring device for PD of high-voltage switchgear was put into operation. The spectrum map and UI display show that the device has promising performance, and meets the needs of online monitoring of PD in high-voltage switchgear. It plays an extremely important role in reducing manpower and material resources, and can timely detect insulation deterioration of high-voltage switchgear.
Footnotes
Handling Editor: Miguel Acevedo
Declaration of conflicting interests
The author(s) declared no potential conflicts of interest with respect to the research, authorship, and/or publication of this article.
Funding
The author(s) received no financial support for the research, authorship, and/or publication of this article.