
Abstract
Aiming at the shortcomings of the research on individual identification technology of emitters, which is primarily based on theoretical simulation and lack of verification equipment to conduct external field measurements, an emitter individual identification system based on Automatic Dependent Surveillance–Broadcast is designed. On one hand, the system completes the individual feature extraction of the signal preamble. On the other hand, it realizes decoding of the transmitter’s individual identity information and generates an individual recognition training data set, on which we can train the recognition network to achieve individual signal recognition. For the collected signals, six parameters were extracted as individual features. To reduce the feature dimensions, a Bessel curve fitting method is used for four of the features. The spatial distribution of the Bezier curve control points after fitting is taken as an individual feature. The processed features are classified with multiple classifiers, and the classification results are fused using the improved Dempster–Shafer evidence theory. Field measurements show that the average individual recognition accuracy of the system reaches 88.3%, which essentially meets the requirements.
Keywords
Introduction
Radar emitter individual identification can achieve the identification of “signal-emitter individual,” furthermore precisely lock the threat sources and high-value targets, which not only has strong significance in military applications, but also has important value in civil network security access, cognitive radio, public security, and other fields.
A significant number of research institutions worldwide have studied the radar emitter individual recognition technology. We and others aim at research on radar individual identification technology, and conclude that the distinction of features of unintended phase modulation on pulse (UPMOP) is better than that of unintended frequency modulation on pulse (UFMOP). The signals of 104 secondary surveillance radars (SSRs) were collected and analyzed, the UFMOP and UPMOP were extracted, and the recognition rate reached 92.2% and 96.7%, respectively. 1 Florian et al. believe that the main challenge of radar emitter data clustering is the high dimension of received radar pulse samples, the small sample group size, and the short distance between the radar pulse groups. Therefore, we propose to model the instantaneous pulse frequency via the Bezier curve, and the spatial distribution of the Bezier curve control points is taken as a new feature in the classification process. The authors collected real data near Brest, France, and used the proposed method to mark the target of interest, which achieved good results. 2 In 2017, Qi proposed a method based on the combination of frequency shift and high-frequency harmonics to prevent empirical mode decomposition (EMD) mode confusion in some cases. Simulation results show that the improved EMD algorithm can be applied to radar signal classification, and the decomposition accuracy is good. 3 Talbot et al. 4 designed a typical specific emitter identification/verification (SEI/SEV) processing prototype system, and a complete set of schemes for signal processing, parameter extraction, and identification library establishment is given, which provides a reference for signal processing flow of subsequent researchers. Chen et al. 5 studied the interference of intentional modulation information (IMI) to unintentional modulation information (UMI) during the extraction of individual emitter features, and proposed discriminative adversarial networks (DANs), which determine the boundary between IMI and UMI; thus, in the process of individual feature extraction, the IMI interference is reduced. Prior research 6 established a signal model for the rising, stabilizing, and falling parts of the pulse waveform, converted the time-domain waveform of the signal into a two-dimensional binary image, and designed a new neural network to extract the subtle signal features. Ru et al. 7 analyze the unintentional modulation (UIM) structure, extract features from different parts of the signal, and combine them. This avoids the disadvantage of either conducting UMI feature extraction of only a portion of the signal and omitting the UMI features of other parts of the signal, or directly conducting UMI feature extraction of the entire signal, resulting in significant calculations.
The above-mentioned documents primarily use only a single signal feature when identifying the radiation source, which does not fully mine the information contained in the signal data. Therefore, various signal characteristics should be considered to separately identify the radiation source, and to fuse the identification results.
Because the 1090-MHz Automatic Dependent Surveillance–Broadcast (ADS-B) signal is a type of secondary radar, it has the characteristics of a pulse signal.8,9 It is rich in signal resources, and the individual transmitter identity is easy to extract, which can effectively compensate for the above deficiencies. Therefore, this study designs an individual identification system for an emitter based on an ADS-B signal. The system first completes the down conversion and acquisition function of the 1090-MHz signal, then preprocesses the leading signal pulse, extracts its individual characteristics, decodes the signal, extracts the individual identity information, makes the individual identification data set, transforms the individual identification problem into a standard pattern recognition problem, and finally uses the data set to achieve supervised pattern recognition to test the performance of the individual feature extraction algorithm of the conventional pulse signal.
This study primarily makes the following contributions:
We extracted six features including envelope, instantaneous frequency, unintentional frequency modulation, unintentional phase modulation, autoregressive (AR) model parameters, and the diagonal bispectrum slice for individual identification.
We use the improved Li-Rule Dempster–Shafer (D-S) evidence theory to fuse the recognition results of the above six features, and propose a recursive method to fuse the results.
We designed a set of ADS-B signal acquisition systems and collected a significant amount of data to form a training data set.
The remaining part of the article is organized according to the following structure: section “Related work” introduces the papers related to the research content of this paper; section “Analysis and processing of ADS-B signal” introduces the format of the ADS-B signal and the processing flow of the ADS-B signal in this study; section “Individual emitter features” details the signal feature extraction algorithm used in this study; section “System design and implementation” introduces the structure and performance parameter of our signal acquisition system; in section “Testing and verification,” we designed three experiments to test the performance of our proposed algorithm; and finally in section “Conclusion,” we summarize this article.
Related work
Al-Shawabka et al. 10 study the influence of wireless channels on the classification accuracy of convolutional neural network (CNN)-based radio fingerprint recognition algorithms, and have obtained convincing experimental results. The results of literature 10 show that only in the two experimental settings of “setup C” and “setup D” is the hardware damage of the transmitter learned by CNN. Under the two experimental settings of “setup A” and “setup B,” what is learned is the channel characteristics. The ADS-B signal used in literature 10 was provided by DARPA and was used to test the impact of changes in the number of equipment and signal-to-noise ratio on the recognition accuracy of the CNN recognition algorithm. This article does not clearly explain how the ADS-B signal is collected. If the acquisition method of the ADS-B signal is similar to the two experimental settings “setup A” and “setup B,” then the CNN in this article should also learn the signal channel characteristics. However, our research is to directly extract the signal envelope, instantaneous frequency, unintentional frequency modulation, unintentional phase modulation, AR model parameters, and the diagonal slice of bispectrum to identify the individual transmitter. The hardware damage of the transmitter is reflected on the signal in a UIM manner. The features we extracted ensure that what our machine learning method has learned is the result of the combination of the transmitter’s hardware damage and channel characteristics. This is the biggest difference between our research and the research by Al-Shawabka et al. 10
Ying et al. 11 study a two-stage spoofing detector based on deep neural network (DNN), and perform individual identification of ADS-B signals in the second stage of detection. Ying et al. 11 use phase information independent of International Civil Aviation Organization (ICAO) address as detection feature in the second stage. Figure 6 in literature 11 shows that there are great differences in the phase patterns of different aircraft ADS-B signals (the difference between Aircraft 7 and Aircraft 8 is small). These differences are well distinguished in the second stage of the spoofing detector for ADS-B (SODA). However, the features used in literature 11 are not applicable to our study. The reason why we use ADS-B signals as the object of study is that the actual battlefield electronic signals are difficult to obtain and most of these data are confidential. As a publicly available radiation signal, ADS-B signal not only has the characteristics of radar pulse but also has its own label, which meets the requirements of data set. The phase features of the signals extracted in literature 11 can well reflect the phase patterns of the ADS-B signals of different aircrafts, but the actual battlefield electronic signals do not necessarily have distinguishable phase patterns. Our study directly extracts six features, such as envelope, instantaneous frequency, unintentional frequency modulation, unintentional phase modulation, AR model parameters, and the diagonal slice of bispectrum. After each feature is identified and six recognition results are obtained, we use the improved D-S evidence theory and our recursive method to fuse the recognition results. Compared with the recognition algorithm in the second stage of SODA in literature, 11 our algorithm is more suitable for real battlefield signal recognition.
Yang et al. 12 propose a new three-layered identity-based signature-based ADS-B authentication framework and perform batch verification. This improves the security and verification efficiency of ADS-B signals. Berthier et al. 13 proposed an alternative protocol security in the air using Tesla (SAT) for ADS-B signals. SAT uses. The Timed Efficient Stream Loss-tolerant Authentication protocol (TESLA) broadcast authentication protocol to obtain stronger data security than ADS-B signal. Sciancalepore and Di Pietro 14 propose a security framework called Secure Open Sky (SOS), which aims to improve the security of ADS-B communications. SOS utilizes the shared ADS-B sensor network and provides message authentication and integrity security services on a time slot basis. The purpose of our research is to design an algorithm suitable for individual identification of battlefield signals. The literature12–14 studies the processing of identity verification in ADS-B packets through a cryptographic mechanism. This is different from our research purpose and analysis angle. Our research focuses on signal feature extraction algorithms and fusion algorithms for individual recognition. We use the ADS-B signal because the ADS-B signal is easy to obtain and just meets our needs for the data set. If there are other suitable data sets, we can completely avoid the ADS-B signal. Therefore, the comparability between our research and the literature12–14 is not strong.
The summary of the differences between the literature10–14 and the study of this article is shown in Table 1.

CNN: convolutional neural network; ADS-B: Automatic Dependent Surveillance–Broadcast.
Analysis and processing of ADS-B signal
The individual emitter identification system based on ADS-B takes the ADS-B DF17 format signal as the processing object. When the transponder works, it periodically broadcasts the extended oscillation signal in DF17 format to provide the identity, longitude, latitude, height, speed, and other status information for the surrounding aircraft and ground traffic control station. The signal waveform is shown in Figure 1.
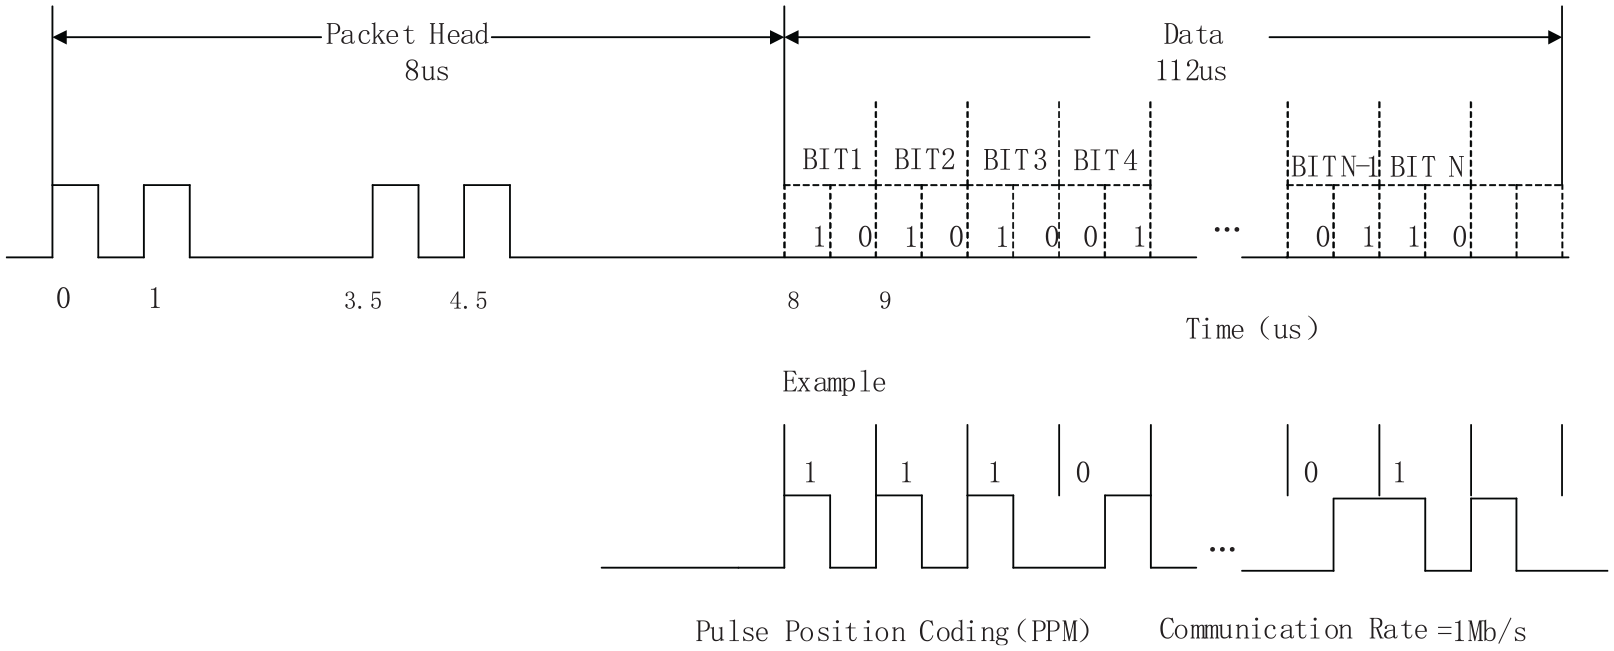
Signal waveform of 1090ES ADS-B.
In Figure 1, the ADS-B response signal is composed of a frame head (four leading pulses, 8 µs) and data part (112 µs), with a total length of 120 µs. The data part carries the unique code (also known as ICAO address code), 15 which is specified by the ICAO for each aircraft, longitude and latitude, altitude, speed, heading, and other status information.
The ADS-B reply signal message in DF17 format has a cyclic redundancy check (CRC) verification function, which verifies whether or not the interpreted address code is correct. In addition, the response signal is not suitable for individual feature extraction and model training for the data part changing with the carried messages. Therefore, the system processing object is the frame head of the response signal, that is, the four leading pulses, as shown in Figure 2.
The signal and preamble pulse of DF17.
For the four leading pulses, six groups of individual features are extracted: envelope, instantaneous frequency, unintentional frequency modulation, unintentional phase modulation, AR model parameters, and bispectrum slice. At the same time, the data part is decoded to obtain the individual identity information, and then the individual features and individual identity information are structured into a training data set. The data processing flow is shown in Figure 3.

Data processing flowchart.
The upper computer software reads the data file sent by the hardware system, then extracts features and decodes data after digital filtering, digital down conversion, and other processing.
Individual emitter features
The individual emitter signal features based on the ADS-B are the envelope, instantaneous frequency, unintentional frequency modulation, unintentional phase modulation, AR model parameters, and bispectrum diagonal slice.
Assuming the receiver is ideal, the ADS-B receiving signal model corresponding to a single-channel receiver is

where
Envelope feature extraction
The envelope feature is one of the common individual features of radar emitters, which has the advantages of clear physical meaning and simple calculation. 16 Based on the envelope feature, rise angle, fall angle, pulse angle, rise time, fall time, pulse peak position, and other features can achieve better individual emitter recognition. In this study, the Hilbert transform is used to extract the envelope of a single-channel pulse signal. First, the Hilbert transform is used for the receiving single-channel pulse signal

then the complex analytic signal can be expressed as

The envelope expression of a single-channel pulse signal is

Instantaneous frequency feature extraction
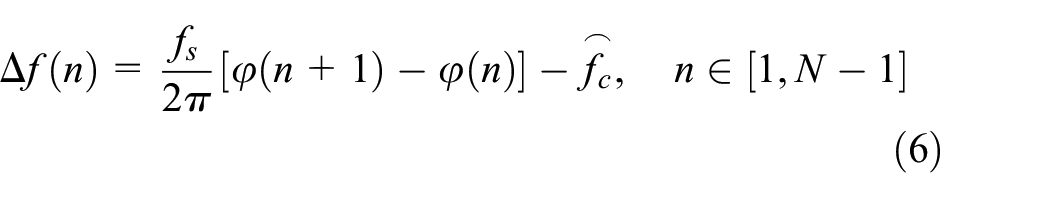
There are two methods to extract the instantaneous signal frequency: the Hilbert transform and instantaneous autocorrelation. In this study, the Hilbert transform is directly used to extract the instantaneous signal frequency features. According to equation (3), the instantaneous signal frequency feature can be extracted by the discrete phase difference

UIM feature extraction
The sources of the intra-pulse UIM features are primarily frequency source and radio frequency amplifier. When the radar emitter transmits the pulse, owing to the frequency source distortion or the amplifier nonlinearity and other factors, it inevitably produces unwanted stray components, such as UFMOP, UPMOP, and harmonics. The stray components produced by different emitters cannot be the same, that is, the intra-pulse UIM features are different; therefore, it is feasible to identify individuals based on the intra-pulse UIM features. 17
First, the Hilbert transform is used to estimate the instantaneous frequency and phase curve in the intra-pulse. Then, the instantaneous frequency curve is processed by means of de-averaging (de-straightening), the instantaneous phase curve is processed by de-skewing, and finally the features of unintentional frequency and phase modulation are extracted.
Equation (5) is processed by de-averaging (de-straightening), and the intra-pulse unintentional frequency modulation UFMOP is extracted as
where

where

AR model parameters
According to the radar emitter pulse signal characteristics, on one hand, the pulse width is often small, which leads to a lack of data length and a significant spectrum estimation error. Conversely, within the power spectrum bandwidth of the pulse signal, the power dispersion generated by different radar transmitters cannot be completely consistent. Therefore, the modern spectral estimation method with improved resolution should be used to estimate the power spectral density to extract the individual frequency domain features.
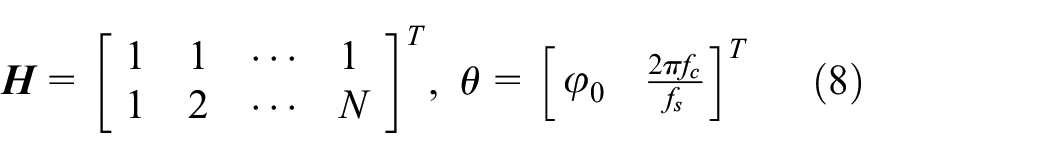
The autoregressive moving average model (ARMA) process can be obtained from the linear system of white noise sequence
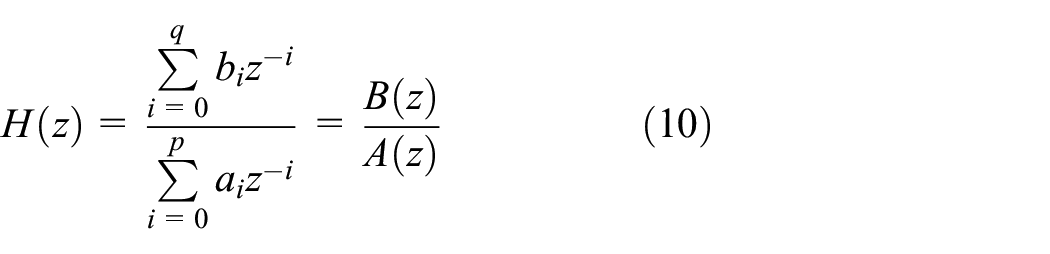
When

where the AR model of order p is called AR(p), which means

Bispectrum diagonal slice feature extraction
The high-order spectrum (also known as high-order cumulant spectrum) is an important part of high-order statistics, whose advantages are that it retains the signal amplitude as well as the signal phase information. The third-order spectrum in the high-order spectrum, also known as bispectrum, not only contains all the high-order spectrum features, but is also easy to calculate. Therefore, the bispectrum is suitable for individual feature extraction.
Bispectrum is defined as

Generally, for the bispectrum pulse signal estimation, there are two methods: the non-parametric model method and the parametric model method. Owing to the limited pulse data length in the actual radar emitter signal processing, if we use the non-parametric bispectrum estimation, we cannot obtain a high-resolution bispectrum. If the data length is increased by increasing the sampling rate, not only will the bispectrum resolution be unchanged, but also the back-end processing will incur a massive calculation pressure. Therefore, the parametric bispectrum estimation based on the AR model is adopted in this study. 19
The symmetrical spectrum region is obvious. If the bispectrum is directly used for individual identification, there will be very redundant information and the calculation cannot be simple enough, so it needs to be simplified before application. The bispectrum slice is an important method to simplify the bispectrum, and the diagonal and offset diagonal slices are commonly used slice types. Considering the actual situation of the pulse signal bispectrum, the first and third quadrant diagonal slices are selected as the features for the next processing in this study. The diagonal slice is defined as

System design and implementation
According to the data processing method and design requirements, the Kintex-7 series XC7K325T 20 chip of the Xilinx company was selected as the main controller, and the AD9361 21 chip of the ADI company was selected for analog-to-digital conversion. The XC7K325T integrated multi-channel high-speed interface, which has a 478K logic unit and supports a 32-way 12.5 G transceiver, is a field-programmable gate array (FPGA) chip with high integration, low power consumption, and excellent performance. The AD9361 chip has good programmability, with frequency coverage of 70 MHz–6 GHz, maximum bandwidth of 56 MHz, and dynamic range of more than 66 dB.
The individual emitter recognition system is composed of hardware and software systems, and the system composition is shown in Figure 4.

Design scheme of individual recognition of emitter based on ADS-B.
The core of the hardware system is the low-frequency receiving, acquisition, and processing board, which can collect and package the signals within the frequency range of 70 MHz–6 GHz and the bandwidth within 20 MHz into User Datagram Protocol (UDP) packets and upload them to the upper computer.
The software system is composed of an FPGA chip program and an upper computer software system. The upper computer software system includes an acquisition control unit and a data processing unit. The acquisition control unit realizes the functions of development board binding, UDP packet load length control, buffer application, acquisition command distribution, and data storage control. The data processing unit performs functions of signal preprocessing, individual parameter estimation, feature extraction, and fusion recognition.
Testing and verification
To test the system performance, the ADS-B signal acquisition and processing task was performed for 3 months in the vicinity of an airport route, with a total data acquisition of approximately 1.4TB.
Experiment 1: six different individual features of the same transmitter
The purpose of this experiment is to test whether the functions of hardware storage, individual parameter estimation, and individual feature extraction are normal.
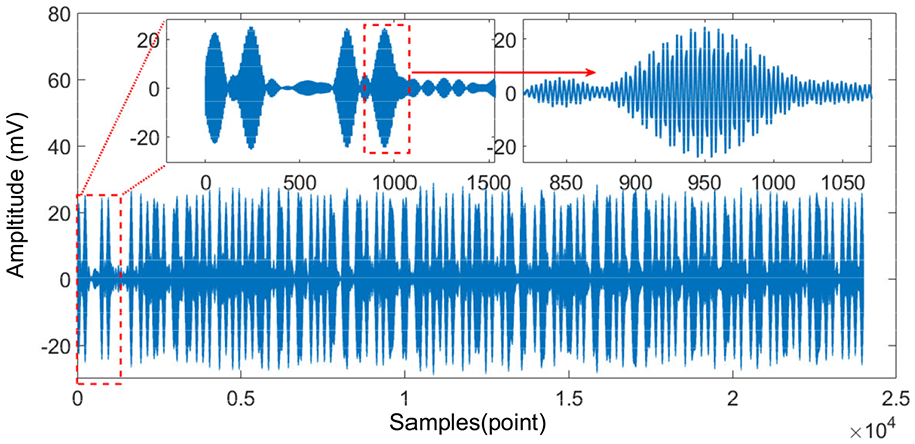
In Figure 5, (a) is the pulse information of an ADS-B transponder stored by the acquisition device. For the fourth lead pulse, the individual parameters are estimated using the upper computer software, and then the envelope (b), instantaneous frequency (c), unintentional frequency modulation (d), unintentional phase modulation (e), AR model parameters (f), and bispectrum diagonal slice (g) are extracted.

The fourth preamble pulse and individual feature of Target 1: (a) pulse information of an ADS-B transponder, (b) envelope feature, (c) instantaneous frequency feature, (d) unintentional frequency modulation feature, (e) unintentional phase modulation feature, (f) AR model parameters feature, and (g) bispectrum diagonal slice feature.
Among them, envelope (b) and instantaneous frequency (c) are the common pulse signal features, which can be directly calculated using the Hilbert transform. The least squares polynomial fitting algorithm is used to fit the instantaneous frequency and phase, and the residuals are taken to obtain the unintentional frequency modulation (d) and the unintentional phase modulation (e), respectively. The AR model parameter (f) is a parametric spectral estimation algorithm for the pulse signal to estimate the model parameters. The bispectrum diagonal slice (g) is based on the bispectrum estimation, taking bispectrum one three-quadrant diagonal slice.
The above six features, except for the low-dimensional feature of the AR model parameter (f), need to be further reduced and optimized. Envelope (b), instantaneous frequency (c), unintentional frequency modulation (d), and unintentional phase modulation (e) adopt the Bessel fitting method, and take the spatial distribution of the control points of the fitted Bessel curve as the individual features. The bispectrum diagonal slice (g) adopts principal component analysis to reduce the dimension, and takes the principal component whose contribution rate is 85% as the individual feature vector. In Figure 5, the individual feature extraction function of the system is normal.
Experiment 2: comparison of individual features of three different transmitters
The purpose of this experiment is to show the differences in the individual features of different transmitters. The ADS-B response signals from three civil aircraft continuously collected within half an hour of 1 day were extracted. The ICAO address codes are A4XXC9, 78XX21, and 78XXC5, respectively, and the signal-to-noise ratio is approximately 16 dB. Figure 6 shows the comparison and display of the six individual features extracted from the corresponding pilot pulse.
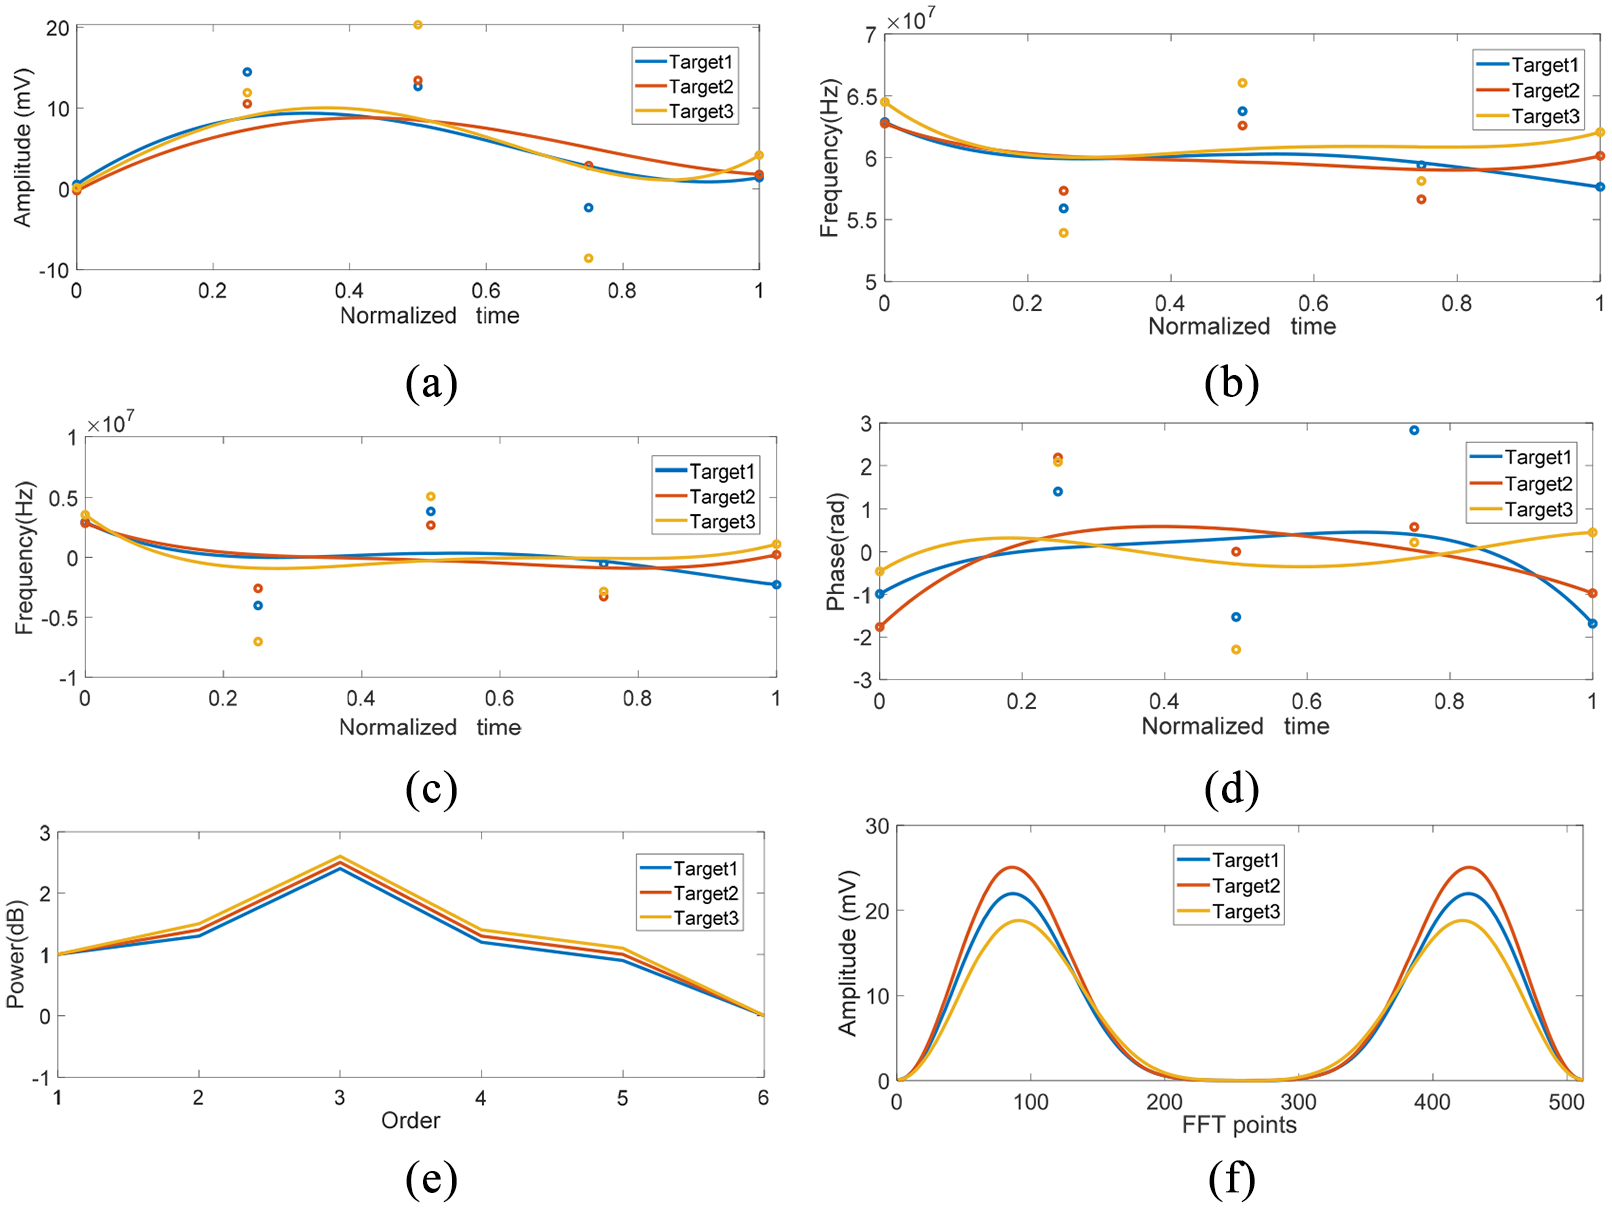
Comparison of six individual features between three emitters: (a) envelope feature, (b) instantaneous frequency feature, (c) unintentional frequency modulation feature, (d) unintentional phase modulation feature, (e) AR model parameter feature, and (f) bispectrum diagonal slice feature.
Figure 6 shows that in the current signal environment, except for the AR model parameter (e), the other individual features of the three targets have good separability. The difference between the features of unintentional frequency modulation (c) and unintentional phase modulation (d) is more obvious at both ends. The overall difference in the bispectrum diagonal slice (f) is significant. Although the AR model parameter (e) has a slight difference, its difference cannot reach the classification threshold, which causes it to be easily classified as one. In fact, in the experiment, it was also found that not only the AR model parameters (e) but also the output of other classifiers may have classification errors, which will bring about a risk of misjudgment or lack of judgment, and cannot satisfy the individual recognition requirements.
Experiment 3: comparison of average correct recognition rate between single classifier and fusion model
To reduce the uncertainty brought by a single classifier, and further verify the average correct system recognition rate, the improved recursive centralized spatiotemporal information fusion model is used to fuse the output of each classifier, and the number of Monte Carlo experiments is designed 1000 times. We used a total of 223 ADS-B data packets from eight transmitters. Three preamble pulses of each data packet were taken. The data set has a total of 669 pulses. 70% of the data set was used for training, 15% for cross-validation, and 15% for testing. The machine learning methods we used are support-vector machines (SVMs) and backpropagation (BP) neural networks. The SVM classifier kernel function is a Gaussian kernel function. The activation function of the BP neural networks is sigmoid.
The recursive centralized spatiotemporal fusion model is shown in Figure 7.

Improved recursive centralized spatiotemporal fusion model.
In Figure 7, the SVM classifier is used for the envelope, instantaneous frequency, unintentional frequency modulation, and unintentional phase modulation, and a BP neural network classifier with 10 hidden layers is used for the AR model parameters and bispectrum diagonal slice features.
The average correct recognition accuracy results of the single classifier and fusion recognition are shown in Table 2.
The average rate of individual recognition.
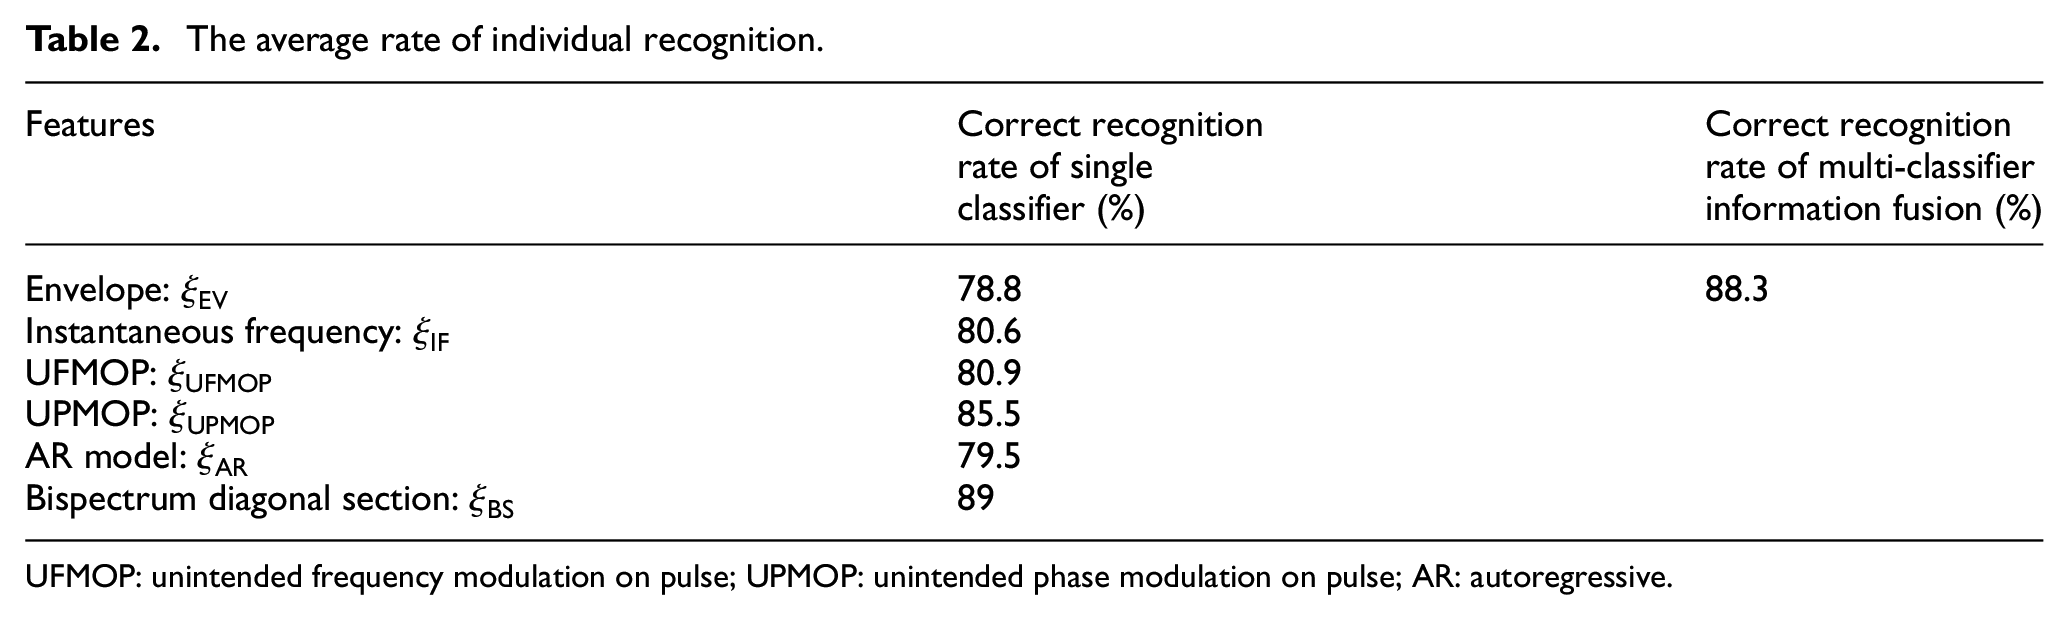
UFMOP: unintended frequency modulation on pulse; UPMOP: unintended phase modulation on pulse; AR: autoregressive.
Table 2 shows that under a single classifier condition, the individual recognition accuracy of the bispectrum diagonal slice feature is the highest, followed by the unintentional phase modulation feature, and the average envelope feature recognition accuracy is the lowest. The average output accuracy of the improved recursive centralized spatiotemporal information fusion model is 88.3%, which satisfies the actual needs.
Conclusion
In this study, aiming at the shortages of theoretical simulation and lack of verification equipment for field measurement in most current research on the individual emitter recognition technology, an individual emitter recognition system based on the ADS-B signal is designed. The system has high technical index, stable performance, and low hardware cost, which can collect and store signals with a bandwidth within 20 MHz and frequency coverage of 70 MHz–6 GHz. The functions of feature extraction, ADS-B signal coding and decoding, database access, and individual identification are completed by upper computer software. The system was continuously optimized after a long period of field experimentation. The average recognition accuracy of individual recognition reaches 88.3%, which meets the needs of individual recognition.
Footnotes
Handling Editor: Peio Lopez Iturri
Declaration of conflicting interests
The author(s) declared no potential conflicts of interest with respect to the research, authorship, and/or publication of this article.
Funding
The author(s) received no financial support for the research, authorship, and/or publication of this article.