
Abstract
The speed of drilling has a great relationship with the rock breaking efficiency of the bit. Based on the above background, the purpose of this article is to predict the position of shallow bit based on the vibration signal monitoring of bit broken rock. In this article, first, the mechanical research of drill string is carried out; the basic changes of the main mechanical parameters such as the axial force, torque, and bending moment of drill string are clarified; and the dynamic equilibrium equation theory of drill string system is analyzed. According to the similarity criterion, the corresponding relationship between drilling process parameters and laboratory test conditions is determined. Then, the position monitoring test system of the vibration bit is established. The acoustic emission signal and the drilling force signal of the different positions of the bit in the process of vibration rock breaking are collected synchronously by the acoustic emission sensor and the piezoelectric force sensor. Then, the denoised acoustic emission signal and drilling force signal are analyzed and processed. The mean value, variance, and mean square value of the signal are calculated in the time domain. The power spectrum of the signal is analyzed in the frequency domain. The signal is decomposed by wavelet in the time and frequency domains, and the wavelet energy coefficients of each frequency band are extracted. Through the wavelet energy coefficient calculated by the model, combined with the mean, variance, and mean square error of time-domain signal, the position of shallow buried bit can be analyzed and predicted. Finally, by fitting the results of indoor experiment and simulation experiment, it can be seen that the stress–strain curve of rock failure is basically the same, and the error is about 3.5%, which verifies the accuracy of the model.
Introduction
With the deepening of oil and gas exploration, the well depth extends from the middle shallow layer to the deep layer and ultra deep layer, and the difficulty of rock breaking increases gradually. In deep and ultra deep well formation, the rock hardness is large, the drillability is extremely high, the abrasiveness is strong, the failure of rock breaking tools is fast, and the mechanical drilling speed is slow. In the deep and ultra deep well drilling, there will be a variety of deep difficult to drill strata, which put forward a great test to the existing efficient rock breaking technology. The rock breaking technology of modern drilling is developed on the basis of rotary bit and high-pressure water jet. Jet drilling technology has very excellent drilling effect in shallow to mid deep formation, high mechanical drilling speed, less drilling accidents, and low cost. In the deep formation, the effect of jet drilling is not very ideal. The mechanical drilling speed is low and the cost is high. In view of the current difficulties in deep formation drilling and the actual situation of drilling rock breaking technology, it is urgent to develop new high-efficiency rock breaking technology with independent intellectual property rights.
One of the key technologies to solve the above problems is resonant rock breaking technology, which has the advantages of improving the mechanical drilling speed and reducing the drilling cost. At the same time, resonant rock breaking technology is also an important direction of the future development of drilling technology. The resonant rock breaking technology of bit is to connect a vibration generator which can adjust the frequency above the bit. When the vibration generator works, it produces high-frequency vibration similar to the natural frequency of the rock. The vibration acts on the rock through the bit and produces resonance. The rock is accelerated to break under the action of the resonance bit, so as to achieve the purpose of speedup. Resonance rock breaking drilling technology provides technical support for the speedup and cost down of drilling engineering and has important guiding significance for field application.
In order to strengthen the control and monitoring of the well group trajectory, Mauro established the prediction model of the shallow bit position according to the vibration signal when the rock was broken by the bit. It is feasible to calculate the bit position based on the distance between wells calculated by the vibration signal by combining the well trajectory measurement data with the circumferential data. Range positioning algorithm, the calculation method of bit geodetic coordinate, is derived. According to the monitoring data of an oil field in Bohai Sea, the three-dimensional (3D) well trajectory of the operation well is obtained using the bit position prediction model. Actual well trajectory and field test show that the bit position prediction model can effectively determine the bit position and determine its approaching trend under certain conditions, providing reference for anti-collision early warning.1,2 Jaiswal and Jaidhar 3 studied the seismic propagation time measurements obtained in the borehole, including vertical seismic profiles, seismic measurements during drilling, and noise data generated by the bit. These travel time data are used to evaluate information parameters, including bit position, distance to drilling target, and velocity model parameters. First, they use a simple hyperbolic propagation time equation to analyze the seismic propagation time data to obtain the radiation between the ground sampling position and the drill bit. Second, they describe a model for estimating the location of the bit and the relative distance to the geological interface in front of the bit. Finally, they proposed a dynamic Bayesian strategy for real-time prediction of bit position, velocity parameters, and distance to geological markers. 4
In this article, the discrete element method is used as the theoretical basis to analyze the effect of rock breaking under different frequencies of simple harmonic vibration. Through the discrete element simulation and laboratory experiment, the mechanical behavior of rock under the condition of simple harmonic vibration is analyzed, and the mechanism of rock breaking under the condition of simple harmonic vibration is revealed. Then, the prediction model of bit position is verified by the experimental data and relevant records. In this article, the acoustic emission (AE) sensor and piezoelectric force sensor are used to synchronously collect the AE signals and drilling force signals of different positions of the bit in the process of vibration rock breaking. After denoising, the simulation test is carried out. The position of the shallow buried bit is predicted by curve fitting, which effectively improves the rock breaking efficiency of the bit.
Drill string mechanics model
Drill string mechanics
Stress characteristics of drill string
In the drilling process of petroleum industry, drill string is an essential tool to connect the ground and bottom bit. 1 The drill string covers all parts of the steel pipe string below the tap and above the bottom bit.5,6 According to the order from the ground to the bottom of the well, the main body of the drill string is composed of Kelly, drill pipe, drill collar, connecting joint, stabilizer, and other downhole tools. In fact, the main components of drill string are many steel drill pipes and drill collars, which can be as long as several kilometers to more than 10,000 m. 7 The commonly used outer diameter of drill string and drill collar ranges from 60.3 to 279.4 mm. The main function of drill string is to transmit the ground power to the bottom hole bit and to exert the required bit pressure on the bit to break the rock depending on the weight of drill string itself.8,9 At the same time, the drilling fluid enters the drill string system through the ground faucet, and ejects from the water hole of the bottom bit, so as to achieve the purpose of cleaning the bottom of the well, cooling the drill teeth, and carrying cuttings. 10 Because of the severe working conditions in the wellbore, the drilling fluid in the wellbore, the reaction force exerted by the bottom rock on the bit, the rotation speed of the drill string itself, and many other factors, the stress on the drill string is very complex.
Axial force on drill string
The length of downhole drill string can reach several kilometers. The larger the drilling depth, the longer the drill string will be. Along the axis of the drill string, the drill string is subject to the pull of the hook, its own gravity, the buoyancy of the drilling fluid, the friction between the drill string and the wellbore, and the reaction force of the bottom hole bit. Among them, the gravity of drill string itself is the main part. In the tripping operation of the drill string, the hook exerts upward pull on the upper end of the drill string, so as to overcome the gravity of the drill string itself and other external forces caused by the friction between the drill string and the borehole wall due to the poor trajectory of the borehole. 11 At this time, all parts of the drill string bear the pulling force, and the pulling force is the largest near the lower end of the hook and the smallest near the upper end of the drill bit. In the process of drilling, the bit pressure exerted by the drill string is the resultant force of hook pull, self gravity, bottom hole rock reaction force, and drilling fluid buoyancy. Therefore, the stress characteristics of different parts of the drill string are different. Above the neutralization point, the drill string is in the stretching state, and below the neutralization point, the drill string is in the compression state.12,13
Drill string torque
The drill string connects the surface equipment and the bottom hole bit, and the torque effect causes the shear stress in the drill string.14,15 Rotary drilling is the most commonly used drilling method in the current drilling process. 16 According to the different ways of drilling power transmission, rotary drilling is divided into drill disk drilling and downhole power drilling. The torque characteristics of the drill string are different with different drilling power transmission modes. The power of rotary drilling comes from top drive or rotary table, which is transmitted to drill string and bit in turn. 17 In the process of drilling, there is friction resistance between the drill string and the wellbore, and between the drill string and the drilling fluid in the inner and outer annulus. Therefore, for rotary drilling, the torque on the drill string near the surface power is the largest, while the torque on the drill string near the bottom bit is the smallest. When the downhole power drilling method is used, such as turbodrill and screw drill, the torque of the drill string near the downhole power drilling tool is the largest, and the torque near the surface wellhead is the smallest.18,19
Drill string bending moment
There are many factors that lead to the bending moment of the drill string, such as the irregular trajectory of the well, the centrifugal force generated during the rotation of the drill string, and the gravity of the drill string itself, which can make the drill string bend and deform in different degrees, leading to the bending moment.20,21 Through the analysis of the axial stress characteristics of the drill string, it can be seen that in the process of drilling, the drill string below the neutralization point is in the state of compression, which is easy to produce the bending deformation and bending stress of the drill string. 22 The bending deformation of drill string in the irregular section of borehole trajectory is more serious. In the course of rotation, the bent drill string will produce centrifugal force, which will aggravate the deformation degree of the drill string and inevitably lead to frequent collision between the drill string and the wellbore.23,24
Static model of drill string stress
It is an important prerequisite for in-depth analysis of the dynamic characteristics of drill string to carry out the research on the statics of drill string. For a long time, Lubinski, the American Petroleum Association, has been the first to deduce the plane buckling equation and series solution of the drill string by analyzing the stress and deformation of the drill string. In this article, the parameter values of the model are determined by studying the relevant literature and combining with the actual situation of bit position. The plane buckling equation of drill string is as follows

where E is the elastic modulus of drill string material, Pa; I is the inertia moment of cross section of drill string facing neutral axis, m4; y is the horizontal displacement of drill string axis, m;
x is the axial coordinate of drill string, m;
q is the resultant force of gravity and buoyancy of unit length drill string, N; and F is the axial load of drill string, N.
The balance equation of the drill string in the inclined straight hole is as follows

where E is the elastic modulus of drill string material, Pa; I is the inertia moment of cross section of drill string facing neutral axis, m4; y, z is the transverse displacement of drill string axis, m; x is the axial coordinate of drill string, m; μ is Poisson’s ratio; T is torque of drill string, N m; F is the axial load of drill string, N; q is the resultant force of gravity and buoyancy of unit length drill string, N; and a is the well angle.
The three-dimensional buckling equation is

where θ is the angle between the displacement at point x on the drill string axis and the y-axis; s is the moment of inertia of the cross section of drill string on the neutral axis, m4; F is axial load of drill string, N; E is the elastic modulus of drill string material, Pa; I is the inertia moment of cross section of drill string facing neutral axis, m4; q is the resultant force of gravity and buoyancy of unit length drill string, N; r is the diameter of drill pipe, m; and a is the well angle.
Elastic wave detection and research status
The so-called elastic wave detection is to set up corresponding sensors in the medium, according to the characteristics of the phase, amplitude, and frequency of the elastic wave received by the sensor; analyze the elastic properties of the relevant medium or boundary; or further integrate the time and space information of the elastic wave and analyze the physical parameters and geometric parameters of the medium or other targets. The developing elastic wave detection technology is one of the main technologies in the field of exploration and detection. At present, it has been widely used in seismic, mining, geological exploration, seismic and explosion-proof engineering structures, nondestructive testing of materials, geotechnical dynamics, and many other aspects.
In the process of propagation of elastic wave in stratum rock mass, when encountering different stratum interfaces, a series of reflected wave, transmitted wave, refracted wave gliding along the interface, and mutual conversion of wave types will be generated, resulting in complex wave field, as shown in Figure 1.
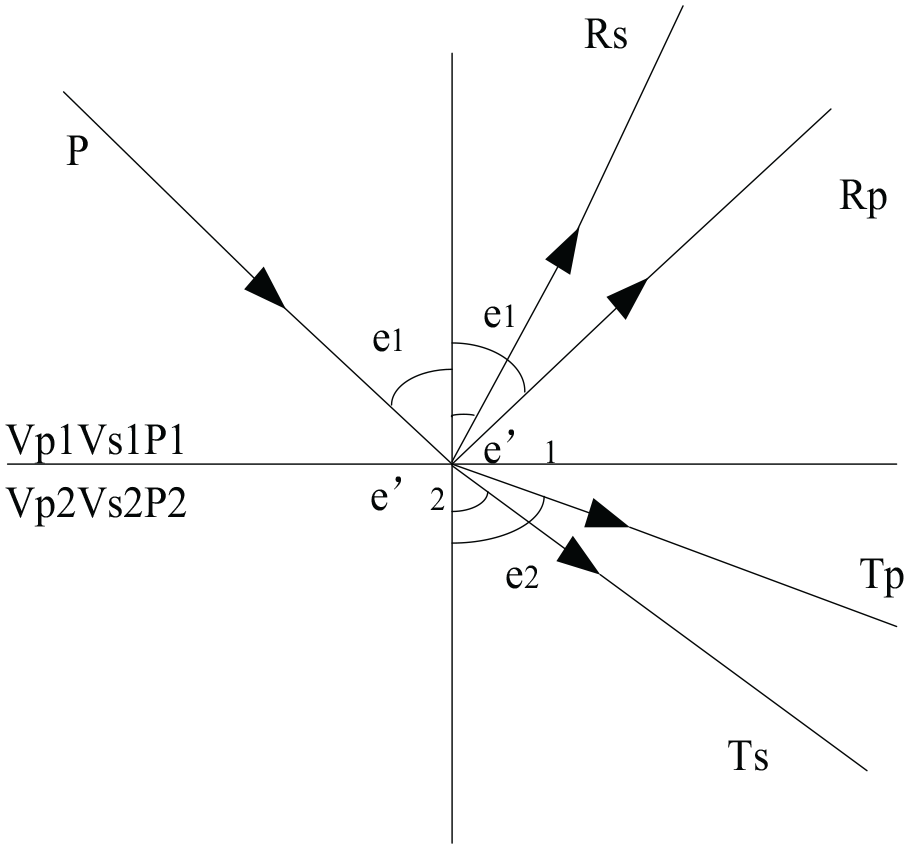
P wave reflection and transmission at the interface of the medium.
The propagation of elastic waves at the interface obeys Snell’s law of motion,

where Vp1 is the P-wave velocity in medium 1 (Vp1, Vs1, ρ1), e1 is the angle between the incident P-wave and the interface,
Suppose A1 is the amplitude of the incident wave and A2 is the amplitude of the reflected wave, then the reflection coefficient (iR) of the interface is defined as the ratio of the amplitude of the reflected wave to the amplitude of the incident wave

where ρ1 and ρ2 represent the density of the two media above and below the interface, and V1 and V2 represent the propagation speed of the wave in the two media. Z1 = ρ1V1 and Z2 = ρ2V2 represent the wave impedance of the medium. In the actual elastic wave exploration, the change trend of the density of the medium is far less than the change of the propagation speed of the elastic wave in the medium, so it can be assumed that the density of the medium in equation (5) is constant, which can be simplified as

On the contrary, if the amplitude of the transmitted wave is A3, then the transmission coefficient Ti can be defined as

According to the conservation of energy, the total energy of the incident wave is equal to the sum of the energy of the transmitted wave and the energy of the reflected wave, and the transmitted wave has no polarity. No matter Z2 > Z1 or Z2 < Z1, the transmission coefficient Ti is always positive, and its value range is
Propagation characteristics of bit vibration wave
Geometric diffusion
Elastic wave propagation can be regarded as the process of energy propagation from wave source to surrounding medium. When the elastic wave propagates somewhere in the medium, the particles begin to oscillate, thus generating kinetic energy. At the same time, the deformation of the element body makes it have potential energy (tensile energy). When the wave propagates, the medium vibrates layer by layer from near to far, and the energy propagates layer by layer. Taking the simple harmonic longitudinal wave as an example, at the fixed radius r, the radial displacement of the displacement is expressed as

The total energy density is
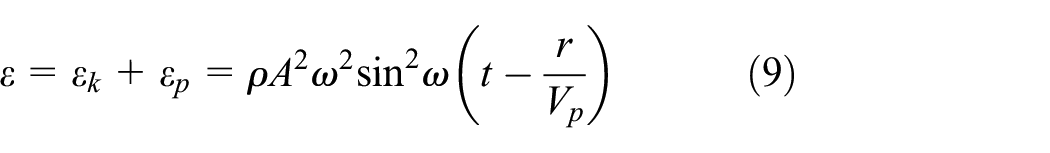
The above equation (9) shows that the energy density is directly proportional to the square of the amplitude, the square of the frequency, and the density of the medium. When elastic waves propagate in a medium, energy is transferred from one part to another due to the connection of several parts of the medium, and the energy changes with time. The energy per surface unit perpendicular to the time unit passing through the direction of wave expansion is defined as the energy flow density I. That is, the strength of the wave. Then
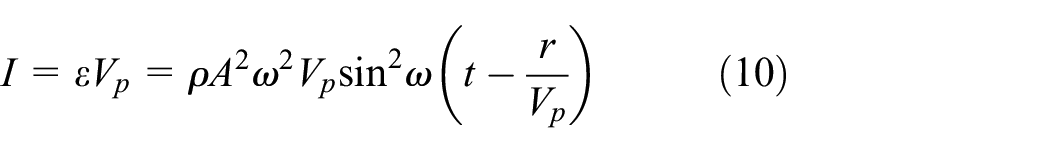
For the spherical simple harmonic longitudinal wave emitted from the spherical center, the total energy flux per unit time is equal to the energy flow density times the area, as shown in Figure 2.

Relationship between energy intensity and propagation radius.
It can be shown from Figure 2 that the amplitude of a wave is inversely proportional to its propagation distance. The larger the distance, the smaller the amplitude of the wave. The larger the wave front, the smaller the energy per unit area. This is called spherical diffusion. This is due to a reduction in energy due to geometry. It is independent of the media type.
Experimental arrangement
Experimental signal preprocessing
In the process of field test, due to the environment, weather, unstable operation of the system, and other reasons, the collected signal has abnormal points, trend items, and other interferences, which need to be preprocessed.
Remove outliers
In the actual monitoring process on site, due to the noise interference of the well pad environment, the sudden change of amplifier magnification, the long-term continuous operation and the weather (rain) impact, the sensor connection is abnormal, and other reasons, some high or low mutation points—abnormal points—will be incorporated into the collected signal. In the field work, the existence of abnormal points is generally checked by data list or time-domain waveform display, and the data with deviation greater than 3σ can also be eliminated by calculating the standard deviation of each sampling value.
Zero mean
Due to some reasons in the test, the mean value of the signal is not zero, which adds a DC component to the signal, and the zero mean value processing is needed, otherwise it will bring serious impact on the frequency-domain analysis of the signal. The process of zero mean is as follows.
First, calculate the mean value of the sampling data

Zero mean processing

Remove trend item
Trend time refers to the whole process that the vibration signal data collected locally deviates from the baseline with time, which is divided into linear trend time and nonlinear trend. The main reasons are as follows: (1) temperature change causes zero drift of amplifier, (2) environmental interference around the sensor, and (3) the low-frequency power supply outside the frequency range of the sensor is unstable. Because the existence of trend elements directly affects the accuracy of collected signal data, it should be removed before data processing. In the actual vibration signal data processing, the most commonly used method to eliminate the trend heat is the least square polynomial, which is usually used to remove the polynomial trend heat from the scanning data.
Collection of data related to field experiments
During the field anti-collision test, the following materials and data shall be prepared.
Collect daily drilling report and logging data. Information about well type, design depth, bit, bottom hole assembly (BHA), drilling parameters, troubleshooting, average rate of penetration (ROP), and other drilling processes are recorded in the drilling daily report. The logging data recorded the hook height, hook load, rotation speed, torque, and other information at each time in the drilling process. Using the daily drilling report and logging data, we can get the data of working conditions and well depth at different times in the drilling process, which can be used to judge whether the bit is in the drilling state, so as to pick out the accurate signal reflecting the bit drilling.
Preparation of anti-collision monitoring log. In the process of anti-collision monitoring, the anti-collision monitoring log shall be prepared to facilitate the search, playback, and analysis of anti-collision data. A complete anti-collision monitoring log shall include the following aspects:
Overview of platform and monitoring well;
Number of monitoring well, time of monitoring, acquisition channels corresponding to each monitoring well, sampling frequency, and magnification of each channel;
Record the drilling conditions, the characteristic signals in the process of signal acquisition, and the time of occurrence;
The ground construction situation, especially the construction situation which has great influence on signal acquisition;
Through the wavelet decomposition, the data detected by the sensor is de-noised, and the simulation effect picture of the simulation experiment is obtained.
Bit position analysis based on signal monitoring
Analysis of bit shale crushing test results
Polycrystalline diamond compact (PDC) bit acts on rock surface and forces rock to break. The crushing process can be divided into two parts: pressing crushing and cutting crushing. In conventional drilling, part of the weight of the drill string acts vertically on the PDC bit, pressing the tip of the tooth into the surface of the rock to form the initial crush. The weight on bit (WOB) is an important embodiment of the crush degree. At the same time, under the torsional action of rotary table or other downhole power drilling tools, the teeth cut the rock along the direction of horizontal cutting force, which results in reverse torsional moment on the drill string.
At the initial stage of contact between teeth and rock, the interaction surface between the bottom of blade tip and rock is very small, and the rock at the bottom of blade tip can reach the limit state under very small load and break. Under the combined action of axial feed and torsion, the distance between the bit teeth and the rock contact surface, the contact point and the rock surface increases gradually, and the force required for the rock to reach the limit state also increases gradually. When the teeth completely eat into the rock, the contact area and contact point depth will not change, and the WOB should tend to a constant value. Therefore, from the initial stage of rock breaking by bit teeth, the bit pressure gradually increases from small to stable, as shown in Figure 3 (the speed is 63 r/min and the feed rate is 0.04 mm/r).

Change of weight on bit with joint inclination.
According to the WOB waveform, the average WOB value is obtained at the stage of steady change of WOB value, and the variation rule of the average WOB value under different joint obliquity is observed. Figure 3 shows the average value of WOB of different joint dip angles under the three feed rates of 63 r/min. It can be seen from the figure that when the joint dip angle increases from 0° to 30°, the average WOB shows a steady increase trend and reaches the peak value at 30°. With the increase in joint inclination, the average WOB begins to decrease. When the joint dip angle is 90°, the average WOB decreases to the lowest again. With the increase in joint inclination, the WOB value increases first and then decreases. After drilling in shale samples with different joint obliquities for 60 s, the change curve of the amount of rock cuttings broken by the bit teeth is shown in Figure 4.

Changes in the amount of cuttings at different feed rates.
For the same speed, the amount of cuttings increases with the increase in the feed rate. By comparing the amount of rock debris under different joint obliquities, it can be found that when the joint obliquity is between a = 30° and a = 60°, the amount of rock shoulder broken by bit is larger; when the joint obliquity is less than a = 30° or greater than a = 60°, the amount of rock debris is smaller. This shows that the bedding of rock is conducive to the occurrence of volume fracture, and the influence of too large or too small joint inclination on the increase of rock debris is not obvious. Under the same drilling parameters, the larger the rock shoulder, the higher the rock breaking efficiency of the bit, and the larger the bit footage per unit time.
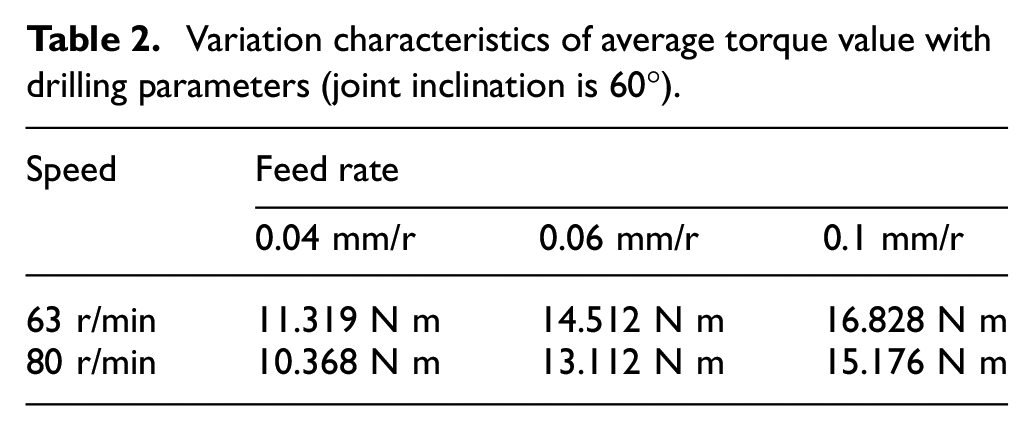
In the actual drilling process, in order to obtain a larger ROP, the driller is used to improve the bit rotation speed. However, for the long-distance (over kilometer) drill string system, the high rotation speed of the drill string can easily aggravate the instability of the drill string system, which has an important impact on the dynamic behavior of downhole drilling tools. The change results of WOB at different rotation speeds with the same joint dip angle are shown in Table 1. See Table 2 for the torque change results of drill string under the same joint inclination and different rotation speeds. The results are obtained from the average value of the stable stage when the joint dip angle is 60°. Through comparison, it is found that when the speed is increased from 63 to 80 r/min, the ROP is increased from 0.042 to 0.053 mm/s, the average WOB is reduced from 2021.626n to 1949.873n, and the average torque is reduced from 11.319 to 10.368 nm. This law is also verified in the other two kinds of feed.
Variation characteristics of average WOB with drilling parameters (joint dip angle is 60°).

Variation characteristics of average torque value with drilling parameters (joint inclination is 60°).
Calculate the average values of WOB and torque in the stable stage, and compare the variation characteristics of WOB and torque with the joint inclination under different drilling parameters, as shown in Figure 5.

Variation of WOB with joint inclination for different drilling parameters.
Figure 5 shows that when the same drilling parameter is selected to drill in shale with different joint dip angles, the WOB values are different. The effect of small angle bedding shale (0°–30°) on WOB mainly depends on drilling parameters. When the rotation speed and feed rate are small (i.e. the mechanical penetration rate is small), compared with the WOB value of other joint dip angles under the same drilling parameters, the existence of small angle bedding will reduce the pressure on the bit. However, when the speed and feed rate increase, the small angle bedding will play the opposite role. This shows that when drilling with small angle bedding shale (especially 15° joint inclination), drilling at a lower speed, on the premise of obtaining the same mechanical footage, the reaction force of bottom hole rock on the bit teeth can be reduced. For the shale with joint dip >30°, the effect of bedding on WOB is less related to drilling parameters, and the WOB value is basically stable.
Calculation of bit position
Because the distance between sensor nodes and the source bits is different, the absolute time of the signal arriving at different sensor nodes is different. The method can calibrate the distance by accurately measuring the time difference between the simultaneous interpreting points of different sensors, simultaneously interpreting the distance between the target source and the adjacent well casing. This method requires high performance of the system. First, all sensor nodes must be processed in time synchronization, which is affected and restricted by many factors. Second, the signal acquisition system needs high sampling frequency. Taking the propagation speed of vibration wave in sandstone as an example, the system’s recognition accuracy of time must reach 1/4000 s (sampling frequency 4000 Hz). In order to meet the requirement that the error is less than 0.5 m, it is very difficult to distinguish such a small time difference considering the environmental noise interference and measurement error and other factors.
The bit distribution mode has the characteristics of high overall strength, strong impact resistance, easy cleaning and cooling, good chip removal, and strong mud bag resistance. The single tooth distribution mode can improve the service life of the bit, but the hydraulic control ability is low, and it is easy to mud bag in the turnover formation. The combined gear distribution mode has better cleaning, cooling and chip removal ability, and the gear distribution density is higher, which is generally used in medium hardness formation. The density of bit teeth and the size of cutting teeth depend on the formation and drilling conditions used. The harder the formation, the smaller the cutting tooth size and the higher the tooth distribution density. With the increase in the number of teeth, the cutting load borne by each tooth decreases, and the life of the drill bit is prolonged, but the mechanical drilling speed is correspondingly reduced. When the composite piece is installed on the drill bit, it has a rake angle and a camber angle. The rake angle is the working angle of the cutting teeth, generally a negative angle, which is conducive to protecting the cutting edge and extending its service life. According to the drillability and working load of the formation, the rake angle is generally controlled in the range of 10°–30°. The role of the side angle is to make the cutting teeth produce side thrust on the cuttings before cutting the formation, so that the cuttings move to the outer edge of the drill bit, which is conducive to the removal of cuttings. Through numerical simulation, the cutting teeth angle θ is changed to set different front angle. The three-dimensional comparison between the calculated trajectory of the model and the actual trajectory is shown in Figure 6.
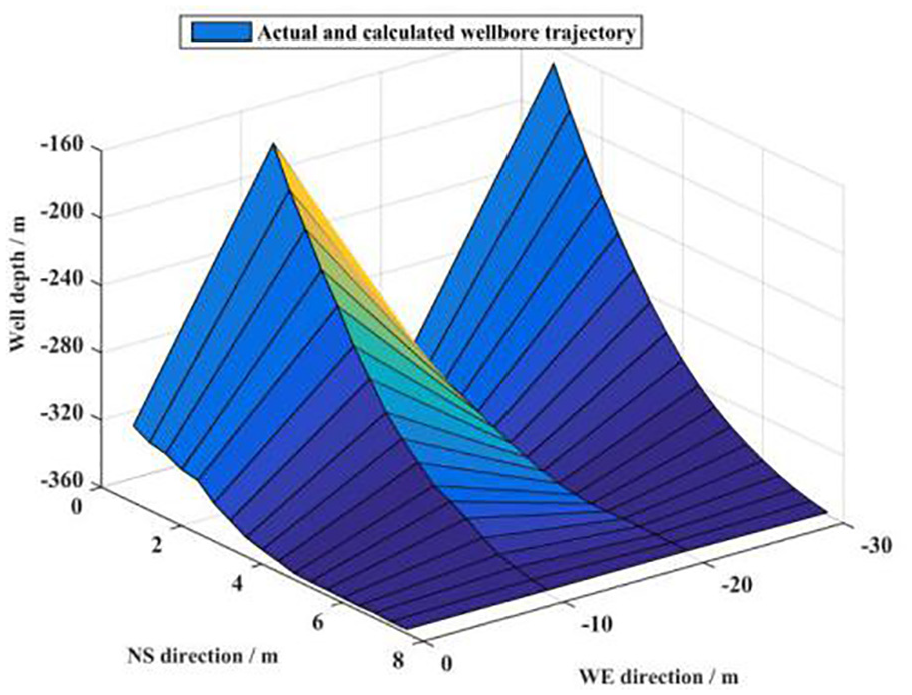
Three-dimensional comparison of model calculated trajectory and actual trajectory.
From the comprehensive results of Figure 6 and a large number of signal data analysis, it can be concluded that the average value of AE signal decreases with the increasing wear degree of drill bit, but its size change is not obvious, the difference is not more than 0.05, indicating that the correlation between the average value of AE signal and the wear state of drill bit is not high. The variance of AE signal fluctuates very much. The results show that the variance of AE signal cannot reflect the wear state of bit. As for the root mean square value of AE signal, observe the change trend of its comparison chart, and find that the root mean square value increases with the increase of bit wear degree, and its growth trend is relatively stable, which shows that there is a good corresponding relationship between the root mean square value of AE signal and the wear state of bit. In conclusion, the root mean square value of AE signal has better regularity than other time-domain eigenvalues, so it is selected as one of the characteristics of vibration drilling bit position monitoring system.
Conclusion
In this article, the research status of the vibration signal monitoring of bit broken rock at home and abroad is investigated, and the principle of borehole anti-collision based on the vibration signal monitoring of bit is described. Through the research, the standard of judging the bit approaching the adjacent well is improved and perfected, the characteristic amplitude method of vibration signal is improved to the relative amplitude method of characteristic signal, and the distance relationship between relative wells is improved to the distance relationship between wells, the prediction of the risk of wellbore collision by the vibration wave anti-collision monitoring system of the bit is quantified continuously. Through the systematic analysis and research of the drill string mechanics and rock mechanics theory, the static stress characteristics of the drill string are clarified, and the finite element analysis method of the straight section drill string system using the linear beam element is mainly studied. On this basis, the laboratory simulation experiments and finite element numerical simulation of bit shale and drill string bit shale are carried out, and the expected research results are achieved.
In this article, the basic theory of the particle discrete element method is introduced, which provides the theoretical basis for the establishment of the uniaxial compression and tension experimental model of rock. The parameters of the link bond between particles are calibrated. Through the analysis of the influence of the link bond parameters between particles on the rock model, it can be seen that the maximum stress of rock is positively related to the critical limit stress of the particle bond. The deformation is positively related to the stiffness per unit area. The results show that the curve law after fitting is basically the same, and the error is about 3.7% to verify the accuracy of the model.
In this article, the prediction model of relative distance between wells in shallow layer is established according to the actual work of anti-collision. This model mainly considers the absorption and attenuation of vibration wave and solves the problem of multiple wells together. It can get the relationship between the relative amplitude of vibration signal of each well and the relative distance between wells. It can be used as a prediction and judgment method for the approach of monitoring wells by bit. Combined with the actual work of field anti-collision, a prediction model of the distance between wells in deep single well is established. However, due to the lack of in-depth research on drilling detection technology and lack of practice, this model has certain limitations in the actual exploration and prediction of bit position, such as the prediction accuracy of deep well bit position is insufficient. It is hoped that in the future, in-depth research can be carried out to better improve the rock breaking efficiency of bit.
Footnotes
Handling Editor: Francesc Pozo
Declaration of conflicting interests
The author(s) declared no potential conflicts of interest with respect to the research, authorship, and/or publication of this article.
Funding
The author(s) disclosed receipt of the following financial support for the research, authorship, and/or publication of this article: This work was supported by the 13th Five Year Plan of Major National Special Projects of China (Grant No. 2016ZX05003-004-006).