
Abstract
Seepage behavior assessment is an important part of the safety operation assessment of earth-rock dams, because of insufficient intelligent analysis of monitoring information, abnormal phenomena or measured values are often ignored or improperly processed. To improve the intelligent performance of the monitoring system, this article has established an assessment framework covering project quality, maintenance status, monitoring data analysis, and on-site inspection based on the relevant norms of seepage safety assessment of earth-rock dams and the expert survey scoring method, and the Leaky Noisy-OR Gate extended model were used to determine the probability of events, and the dynamic and static Bayesian networks used to assess the possibility of seepage failure of earth-rock dams and diagnose the most likely cause of failure. The function of static and dynamic Bayesian networks to assess the seepage behavior of earth-rock dams, abnormal measured values, and causes of anomalies can make up for the limitations of reservoir management personnel and monitoring system in seepage failure experience and seepage knowledge of earth-rock dams and enable better handling of abnormal phenomena and monitoring information, making the monitoring system more intelligent.
Introduction
There are 98,002 reservoir dams in China at present, with more than 90% as earth-rock dams. According to the statistics from the International Commission on Dams, as of April 2020, earth-rock dams accounted for about 78% of all dam types. 1 The safety of the earth-rock dams is the key to reservoir dam safety. According to statistics, since the first record of dam failure in 1954, there have been over 3500 dam failures in China.2,3 As shown in the National Register of Reservoir Dam Failures, the number of earth-rock dams that collapsed in China accounted for more than 98% of all dam types since 1954. The International Commission on Dams has conducted three survey studies in history,4–6 and the survey data are similar to those of China. The causes of earth dam failure include overtopping, seepage failure, and insufficient foundation shear strength.2,3 Among them, accidents caused by seepage damage accounted for 37.1% in China and about 46% in foreign countries. The assessment of seepage behavior is the basis of safe operation of the earth-rock dams. 7
Seepage behavior safety assessment of earth-rock dams is usually carried out regularly by experts according to the code requirements, and the reservoir management personnel analyze the monitoring data, make regular tour inspections, and record the relevant information daily. Monitoring data can be obtained by manual measurement or via a monitoring system. The monitoring system of some reservoirs can not only inquire measured values but also alert on abnormal measured values. However, there are many reasons for abnormal measured values, and they can be caused by the aging or failure of monitoring instruments or work quality problems 8 such as uneven compacting quality of dam body, unqualified soil material gradation, and incomplete foundation clearing can also result in local measured values not conforming to the specification. Due to the large variety and quantity of information obtained from daily monitoring, the complicated causes of abnormal measurements, and the weak professionalism of reservoir management personnel, abnormal phenomena or measurements of reservoirs are often ignored or improperly handled. To further improve the safety management of reservoirs, efforts can be made to improve the intelligence level of the monitoring system.
Many scholars have carried out relevant research based on some traditional methods, such as event tree, 9 analytic hierarchy process (AHP), 10 and fault tree. 11 However, the above methods still have some limitations in practical application. When there are too many indicators at the same level of the analytic hierarchy process, the weight difference is not obvious. Event tree and fault tree methods are usually used to infer the target event probability from one direction, and the analysis system is too complex. In addition, these methods are not ideal in solving the correlation between events at all levels. However, there are some correlations between superior and subordinate events in seepage failure, which need to be fully considered and analyzed. Bayesian network is often used to establish human health assessment and structural safety assessment.12,13 It is suitable for evaluation and analysis based on related multi-factors14–17 and can take into proper account multi-factor seepage behavior assessment of earth-rock dams and cause analysis of abnormal phenomena and abnormal measured values. 18 So, it can assess the possibility of seepage damage based on the project quality, maintenance and repair status, monitoring data, and on-site inspection and analyze the most likely cause of damage from the monitoring data and on-site inspection results.
In summary of the above, this article has carried out seepage behavior assessment of earth-rock dams based on Bayesian network by combining various conditions of earth-rock dams, to conduct an assessment from regular to routine and make the monitoring system more intelligent.
Methods
Analysis of factors influencing the seepage behavior of earth-rock dam
According to the relevant specification for seepage safety assessment,19–21 four factors shall be considered in seepage behavior assessment of earth-rock dams: dam body and foundation work quality, dam maintenance status, monitoring data analysis, and anomalies in field inspection. The above four aspects cover the quality, maintenance, and tracking monitoring of the whole life cycle of earth-rock dams, providing technical support for the seepage behavior assessment of earth-rock dams. The dam body and foundation work quality are mainly related to whether the anti-seepage and anti-filtration and drainage facilities are complete, and whether the design and work quality meet the requirements of the current code. For the assessment of maintenance status, according to the requirements of the Maintenance and Repair Regulations for Earth-rock Dams, 19 relevant conditions for maintenance and repair of earth-rock dams were considered. Monitoring data analysis and field inspection are based on the requirements of Technical Code for Safety Monitoring of Earth-Rock Dams, 21 to consider whether the seepage pressure water level or seepage flow is abnormal in the monitoring data analysis, as well as abnormal phenomena such as turbidity or suspicious substances in the seepage water, dam slope collapse, or spreading soaking in field inspection. Considering the limitations in listing events, other possible events are listed as others and included in the conditional probability calculation, as shown in Table 1 in detail. Based on the above-mentioned factors, seepage behavior assessment and analysis of earth-rock dams can be carried out.
Earth-rock dam seepage behavior assessment indicators.

Bayesian network
Bayesian network is an uncertainty processing model and can simulate causal relationships in the reasoning process. 22 The network is a directed acyclic graph, composed of nodes representing variables and directed edges connecting these nodes. The directed edges connect parent nodes to child nodes. The conditional probability is used to represent the intensity of the relationship between mutual information elements, if there is no parent node, prior probability is used to express the information.23,24 Bayesian network is the combination of probability expression and inference visualization and can be divided into static Bayesian network and dynamic Bayesian network. The joint probability of static Bayesian network is expressed in equation (1) and that of dynamic Bayesian network is expressed in equation (2)25–27

where P(A) and P(B) are the probabilities of events A and B, P(A,B,C) is the probability of simultaneous occurrence of events A, B, and C, and

where
Determination of conditional probability
Bayesian networks use rigorous mathematical methods to simulate the world, and their accuracy depends on professional knowledge and probability determination. 28 Due to the severity of the accident consequence of hydraulic projects and the fact that seepage damage cannot be reproduced, researches related to seepage damage are mostly carried out using experimental simulation and numerical simulation,29–31 and it is difficult to obtain a large number of seepage and seepage damage data. Therefore, the conditional probability here is determined by the expert survey scoring method. Concerning the qualitative description and quantitative probability conversion table proposed by Peng et al., 32 US Bureau of Reclamation and Bowden, and the risk probability grading method proposed by the UN Intergovernmental Panel on Climate Change (IPCC), 33 the conversion table was optimized into the qualitative description and probability corresponding to seven categories of events, for the purpose to facilitate expert scoring data in reference and distinction. The language expressions and probability ranges of all levels are shown in Table 2. This method of determining conditional probability converts the experts’ qualitative judgment on the possible occurrence of an event into quantitative probability, overcomes the lack and bias of historical data, and combines with the practical engineering and experts’ experience and knowledge.
Corresponding of qualitative description and probability of the possibility of event occurrence.

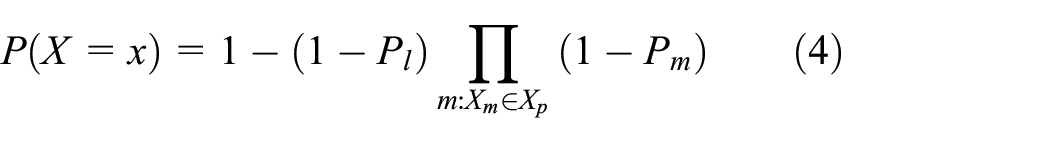
Due to the limitation of human identification of possibility, there are always some unknown or missing factors influencing the nodes in the Bayesian network in practical application. To take unknown factors into account and improve the accuracy and objectivity of probability calculation, this article adopted the Leaky Noisy-OR Gate extended model to calculate conditional probability. Suppose the parent nodes of event X are Xm and Xn, and Xn is the sum of all factors other than Xm, that is, the others in the table, denoted as Xl, and their connection probability is, respectively, Pm, Pn, and Pl, then we have

The conditional probability of node X is
Steps to determine the model
Based on the above discussion, an assessment model for seepage behavior of earth-rock dams based on the Bayesian network is established as follows:
Identify factors that need to be considered. Based on relevant specifications for earth-rock dam seepage safety assessment, including the guideline for reservoir dam safety assessment, specification for maintenance and repair of earth-rock dams and technical specification for safety monitoring of earth-rock dams, and according to the requirements of the seepage safety assessment, factors to be taken into account were determined such as the work quality of dam body and dam foundation, maintenance and repair, field inspection, and monitoring data.
Construct the BN framework. The above factors to be taken into account were summarized and classified, the node names determined, and the Bayesian network framework was constructed based on their relationships.
Establish the model with GeNIe. In this article, the modeling tool GeNIe software was selected to establish the framework of the assessment model based on the relationship between indicators and events as determined in Table 1.
Obtain probability with the expert survey scoring method. The prior probability, conditional probability, and transition probability were determined with the expert survey scoring method against the qualitative description and probability corresponding table of the occurrence probability of events.
Calibrate the expert score. To reduce the subjective difference caused by the valuation of different experts, for items with big differences in assessment, experts should be organized to fully justify and re-assess them until the evaluation values of all experts were in the same interval or adjacent interval in Table 2. The results were obtained by averaging the valuations in the same interval or adjacent intervals.
Optimize the probability. The influence of unknown or missing factors on the nodes in the constructed Bayesian network was fully considered to improve the accuracy of probability calculation, and the Leaky Noisy-OR Gate extended model was used to calculate the conditional probability, to optimize the conditional probability obtained with the expert survey scoring method.
Obtain the static Bayesian network results. Input the final probability into the static Bayesian network and sort out the calculation results.
Obtain the dynamic Bayesian network results. Input the final probability into the dynamic Bayesian network, and the prior probability of key time nodes of the dynamic Bayesian network was selected for real-time updating. Run the software to complete the dynamic reasoning process of seepage behavior under different time slices and get the dynamic results of each node.
With the above steps, the static Bayesian network for seepage behavior assessment of earth-rock dams was established, as shown in Figure 1, and the dynamic Bayesian network is as shown in Figure 2. Among them, the correlation between nodes is reflected by pointing arrows; in Figure 2, the directed circular arc segment “1” on parent nodes indicates that the time interval of adjacent time segments is 1.

BN model of the earth-rock dam seepage behavior.
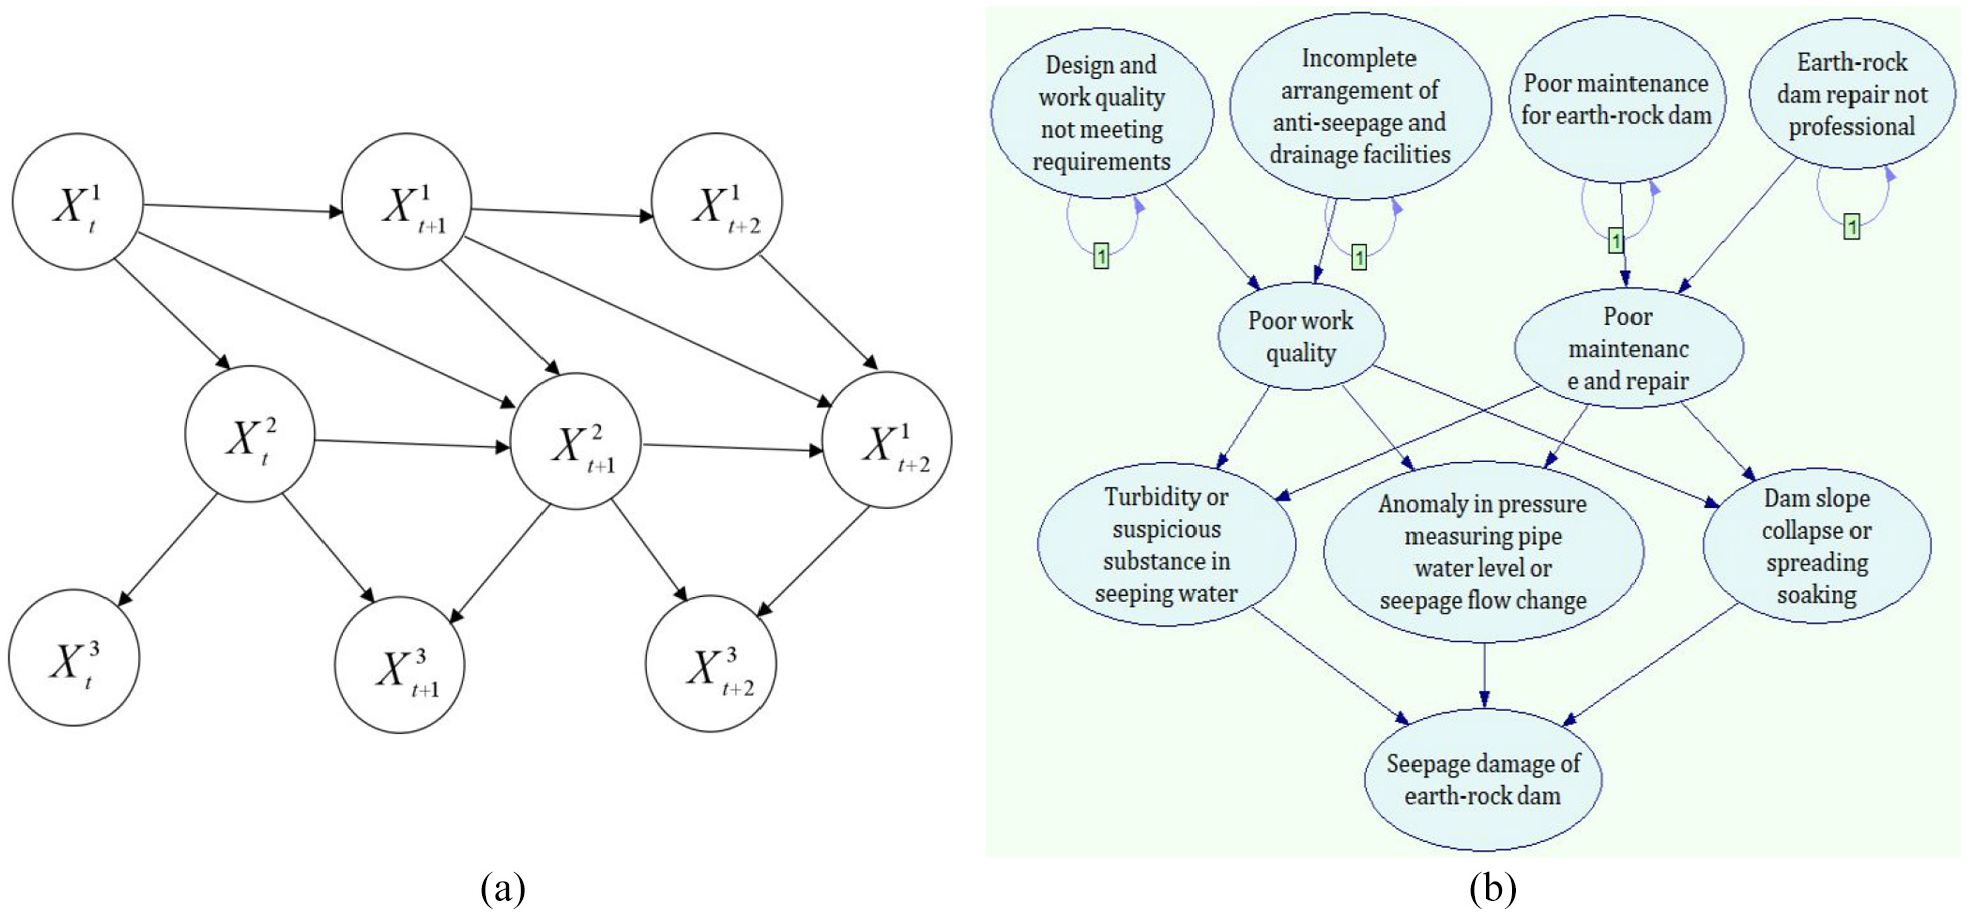
(a) Expansion of the DBN on the time axis and (b) DBN model of the earth-rock dam seepage behavior.
Determination of prior probability, conditional probability, and transition probability
Based on fully studying the dam type data, water conservancy experts were organized to assess the prior probability and conditional probability of nodes in the Bayesian model, unknown factors were taken into account, and the Leaky Noisy Noise-Or Gate extended model was used to calculate the conditional probability. The events in the network were arranged from left to right and from top to bottom as X1–X10, and the probability calculation of nodes with “poor work quality” in the model was taken as an example to illustrate. “Poor work quality” is event X5, and its representative parent nodes “design and construction quality meets the requirements” and “complete seepage prevention and drainage facilities layout” are X1 and X2, respectively, “Xi = 1” means that the event occurs, and “Xi = 0” means that the event does not occur. Experts scored the probabilities to get the prior probability and conditional probability of the event and its parent nodes, as shown in Table 3.
Probability parameter of node (poor work quality).

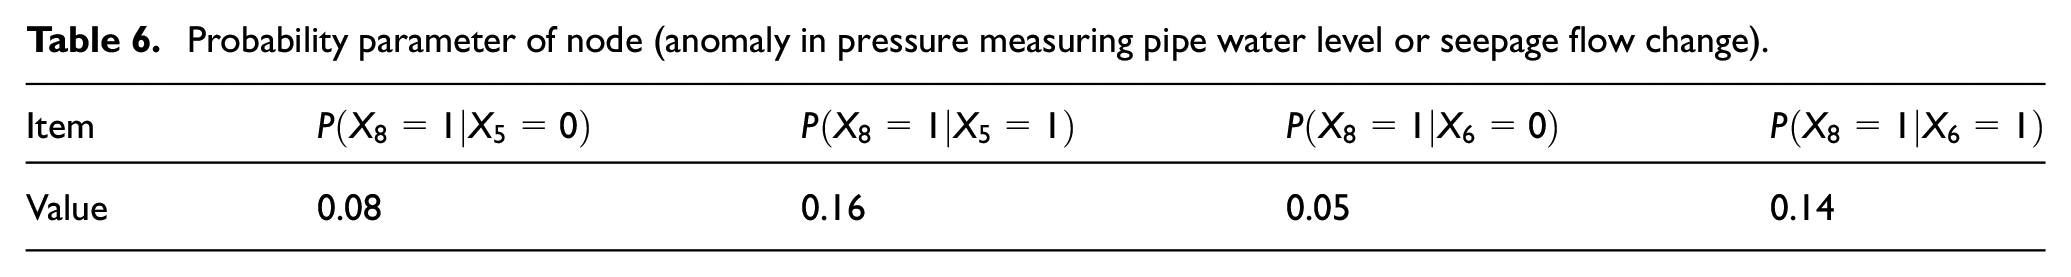
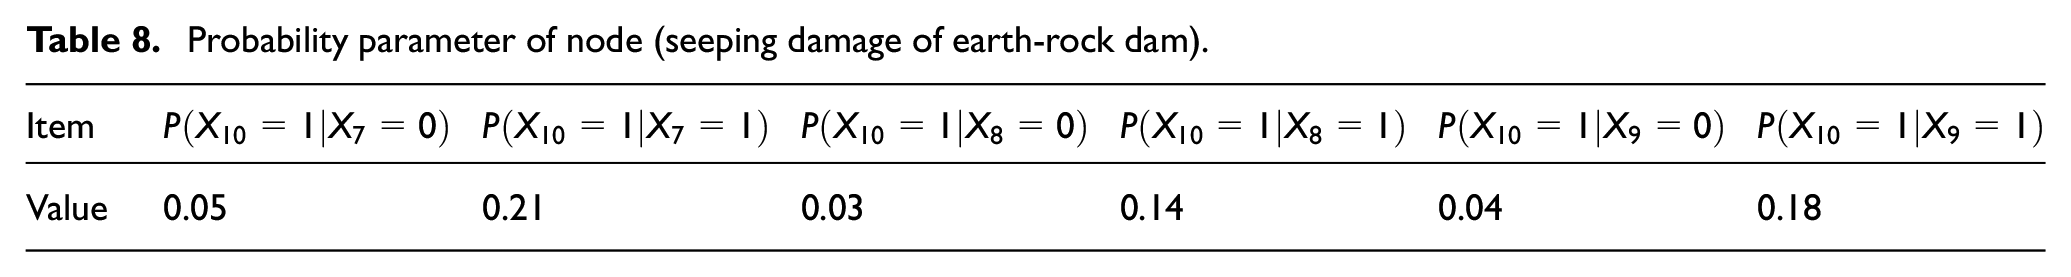
With the above method, the probability parameters of nodes “poor maintenance status,”“turbidity or suspicious substance in seeping water,”“anomaly in pressure measuring pipe water level or seepage flow change,” and “dam slope collapse or spreading soaking” can be determined, as shown in Tables 4–8.
Probability parameter of node (poor maintenance status).

Probability parameter of node (turbidity or suspicious substance in seeping water).

Probability parameter of node (anomaly in pressure measuring pipe water level or seepage flow change).
Probability parameter of node (dam slope collapse or spreading soaking).

Probability parameter of node (seeping damage of earth-rock dam).
Transition probability refers to the probability that event i still occurs in the current time slice on the premise that the event i has already occurred in the previous time slice, and it is determined with the expert survey scoring method.
Transition probability of nodes.

Results and discussion
Taking Mopanshan Reservoir as an example, the Bayesian network model is used to assess the seepage behavior.
Mopanshan Reservoir junction is composed of a barrage dam, spillway, irrigation tunnel, and water supply tunnel. The barrage dam is an earth-rock dam with a clay core wall, with a crest elevation of 324.50 m, crest length 406 m, and crest width 8 m; the maximum dam height is 49.90 m, with the normal water storage level of 318.00 m and the limit water level in flood season 317.00 m. Construction was started in June 2003, water storage acceptance was made in September 2005, and complete acceptance was in January 2013.
On 5 September 2013, the water level of the earth-rock dam was 317.64 m. The reservoir management personnel manually observed that the water level of PT2-1 dam body pressure measuring pipe at section 0 + 225 was 287.33 m; on 8 October, the water level of the reservoir was 317.84 m, and the water level of the pipe was 313.71 m, with a sharp increase of 26.38 m. Subsequently, there were phenomena such as high moisture in dam body rubble, upward returning of white fog, and suspicious substances in the water body in the downstream river course. 34
Static Bayesian network
Inferring results
From the monitoring data above, it is known that the measured previous pressure water level of the earth-rock dam is abnormal, and there are suspicious substances in the water of the downstream river course. In the monitoring data, high moisture in dam body rubble and the up returning of white fog reflected spreading soaking of different forms. Input the above monitoring data and field inspection information into the network, and the probability of occurrence at each node can be inferred, as shown in Table 10. It can be observed from the table that as reversely inferred from the abnormal phenomena, that with slightly higher possibility is the former of poor work quality and poor maintenance and repair, and the most likely in X1–X4 is that the design and work quality failed to meet the requirements. The possibility of the seepage damage of earth-rock dam is inferred from the abnormal phenomenon, and the result is that the possibility of this event is medium.
Inferring results with static Bayesian network.

Verification of inferring results
According to the drilling data of 16 core walls along the axis of the core wall of the dam, as well as the relevant construction and supervision data, it can be concluded that the filling quality and anti-seepage performance of the core wall do not meet the design and specification requirements; the soil material grading is not good, with defects. 34 The above data can correspond to the inferring results that the work quality is not good, and design and construction do not meet the requirements. The core wall drilling data, construction, and supervision data have verified the cause inferring of the Bayesian network.
In response to the above abnormal phenomena, the reservoir was operated at lowered water level starting from 24 January 2014. On 28 February 2014, the water level of the reservoir was 313.02 m, but the water level of the related pressure measuring pipe of the section was still maintained at 303.45 m–304.69 m, without obvious lowering trend. 34 According to the subsequent treatment measures and the corresponding monitoring data, the seepage failure of the earth-rock dam can be verified, and the inferring result of the static Bayesian network was verified.
Dynamic Bayesian network
Historical data
The following seepage data have been obtained for the earth-rock dam since its operation: 34
On 1 July 2009, the management personnel found in the inspection a collapse pit sized 1.95 m × 2.35 m and 1.86 m deep in the rubble of the downstream slope revetment at pile No. 0 + 255. Some milky white material appeared at the outlet of the irrigation tunnel. Yellow paste overflowed from the contact part of the drainage prism and water surface behind the dam after the gate was closed. On 2 July, the stone block at the collapse pit was cleaned up, and water injection was carried out to check the continued subsidence. After stabilization, sand and gravel materials were backfilled. On 3 July, the backfilled location was inspected again, and no subsidence was found.
On 13–18 May, 2010, the water level of the reservoir reached the normal storage level for the first time, with the highest water level at 318.06 m. At 1:00 pm on 6 June, the management personnel found in the inspection a collapse pit sized 3 m × 1.7 m and 0.9 m deep on the road surface at the dam top and in the rubble of the downstream slope revetment at pile No. 0 + 255. After the irrigation tunnel gate was closed, the same yellow material flowed out from behind the dam as in 2009. On 11 June 2010, the subsidence location was scoured and it subsided further by 20 cm. After stabilization, it was filled with fine sand, and after 6 m3 of fine sand was filled, no further subsidence was observed.
Inferring results
According to the historical data above, in July 2009, the dam body downstream of pile No. 0 + 255 collapsed, and yellow paste spilled out behind the dam; in June 2010, the same part of the dam collapsed, and yellow material flew out behind the dam. The yellow material can correspond to the suspicious material in the seepage water as in the network model. The above abnormal phenomena; monitoring data anomalies in September 2013 and anomalies found in field inspection were input into the network; and the prior probability, conditional probability, and state transition probability of nodes were input at the same time; run the software to complete the dynamic inferring process of seepage failure of earth-rock dam at different times, and the dynamic referring results are shown in Table 11, the node probability-time sequence variation curve of specific causes is as shown in Figure 3, the node probability-time sequence variation curve of various causes is as shown in Figure 4, and the possibility-time sequence variation curve of seepage damage of the earth-rock dam is as shown in Figure 5.
Inferring results with dynamic Bayesian network.


Node probability–time sequence variation curve of specific causes.

Node probability–time sequence variation curve of various causes.
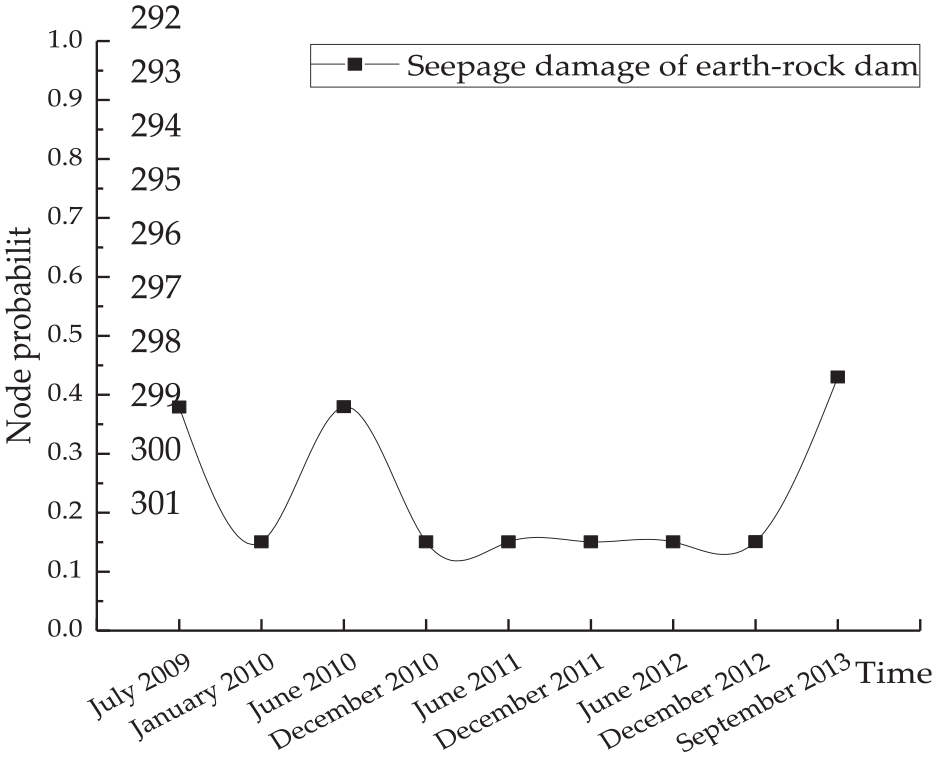
Possibility–time sequence variation curve of seepage damage of the earth-rock dam.
Verification of dynamic network results
After inputting the historical data into the dynamic Bayesian network, the inferring results showed that the most likely cause for the abnormal monitoring data and phenomena in September 2013 was that the design and construction quality fail to meet the requirements, and the most likely cause is poor work quality, and the possibility of seepage failure of earth-rock dam is medium. The inferring results of the dynamic Bayesian network can be verified by verifying the results with the drilling data of the core wall, subsequent processing measures, and corresponding monitoring data in section “Verification of inferring results.”
Comparative analysis of dynamic and static networks
By comparing the inferring results of dynamic and static Bayesian networks, it can be found that according to the abnormal phenomena and abnormal monitoring information, the possible causes and the possibility of seepage failure of earth-rock dam reflected by the two networks are consistent, and the results of the two network models agree with the actual data, indicating that both dynamic and static Bayesian network models can be used to analyze the causes of abnormal phenomena and monitoring information and to assess the possibility of seepage failure of the dam body. However, the specific values of abnormal phenomena and probabilities of possible causes of the measured values derived from the dynamic and static network reference are slightly different, because the dynamic network can effectively accumulate the inferring results at the previous moment and feedback them to the new time nodes. Through comparison, it can be found that the dynamic Bayesian network can observe the dynamic change of events over time, and the inferring results of the model can take into account the influence of historical anomaly monitoring data and abnormal phenomena.
Conclusion
The seepage safety assessment model of earth-rock dams adopts the Bayesian network to establish the assessment framework covering work quality, maintenance and repair, monitoring data and field inspection, making the work to assess the seepage behavior of earth-rock dams according to specifications intelligent and also making the model for an intelligent assessment of the seepage behavior of earth-rock dams professional.
In this article, the expert survey scoring method and the Leaky Noisy-OR Gate extended model were used to determine the prior probability, conditional probability, and transition probability of events. The expert knowledge and experience were integrated into the Bayesian network, to make up for the limitations of the monitoring system and relevant personnel in seepage knowledge on earth-rock dams and the lack of relevant experience in seepage damage.
The example shows that the static and dynamic Bayesian networks have high accuracy in finding abnormal phenomena, the causes of abnormal measurements, and assessing the possibility of seepage failure of earth-rock dams. The dynamic Bayesian networks can better take into account the influence of historical causes and observe the dynamic changes of events with time. The intelligent inferring function of dynamic and static Bayesian networks can make the seepage behavior assessment of earth-rock dams from regular to real-time and also enable more intelligent functioning of the monitoring system.
Footnotes
Handling Editor: Francesc Pozo
Author contributions
L.H. and S.W. contributed to the Conceptualization of this study. L.H. contributed to the methodology.; L.H. contributed the software. Validation was done by L.H., S.W., and Y.G. Formal analysis was done by L.H. Investigation was carried out by S.W., J.D., and Q.P. Resources were contributed by S.W., J.Y., and Y.W. L.H. contributed to supervision, data curation, writing—original draft preparation, and reviewing and editing. L.H., S.W., and Y.G. contributed to visualization. Project administration was done by S.W. and Y.G. Funding acquisition was done by S.W., Y.G., and Q.P. All authors have read and agreed to the published version of the manuscript.
Declaration of conflicting interests
The author(s) declared no potential conflicts of interest with respect to the research, authorship, and/or publication of this article.
Funding
The author(s) disclosed receipt of the following financial support for the research, authorship, and/or publication of this article: This research was funded by National key research and development program (Grant No. 2018YFC0407106) and National Natural Science Foundation of China (Grant No. 51979175).