
Abstract
Climate change brings many changes in a physical environment like plants and leaves. The flowers and plants get affected by natural climate and local weather extremes. However, the projected increase in the frost event causes sensitivity in plant reproduction and plant structure vegetation. The timing of growing and reproduction might be an essential tactic by which plant life can avoid frost. Flowers are more sensitive to hoarfrost than leaves but more sensitive to frost in most cases. In most cases, frost affects the size of the plant, its growth, and the production of seeds. In this article, we examined that how frost affects plants and flowers? How it affects the roots and prevents the growth of plants, vegetables, and fruits? Furthermore, we predicted how the frost will grow and how we should take early precautions to protect our crops? We presented the convolutional neural network model framework and used the conv1d algorithm to evaluate one-dimensional data for frost event prediction. Then, as part of our model contribution, we preprocessed the data set. The results were comparable to four weather stations in the United States. The results showed that our convolutional neural network model configuration is reliable.
Introduction
Plant disease forecasting is critical in the farming sector. Agricultural production’s economic growth is dependent on the product quality they produce, which is dependent on crop growth and yield. Defining the disease could also lead to faster treatments that must be applied to mitigate the effects of significant financial loss. The diagnosis of different diseases in crops through the plant’s roots may be complex. Plant disease detection by hand is a time-consuming process. Charrier et al. 1 presented the seasonal variations in frost hardiness (FH) in various tissues of new seedlings and established orchard walnut trees were compared. The electrolyte leaks procedure was used to test FH. Guillaume et al. 2 introduced that if exposure overtakes frost vulnerability, frost damage grows. Therefore, a complex frost resistance simulation utilizing temperatures and photoperiod in interface with the stage of development is essential for frost risk assessment.
Charrier et al. 3 suggested an applied eco physiological-based method for frost risk assessment in order to address the classical empirical relationships used for modeling frost hardness. On the basis of this overall context, it illustrates the numerous environmental factors (e.g. weather, light, flood, and dryness) that impact frost vulnerability and frost exposure in the trees and the management activities (taking, thinning, curding, sheltering, spraying, irrigation, and fertilization). In the article, Suvanto et al.’s 4 aim was to investigate whether the temperature of the spruce in Norway and of Scots Pine in Finland could have an impact on radial development. In the article, Charrier et al. 5 provided an operating instrument for simulating leaves’ carbohydrates parameters which might forecast frost hardness with temperature, water contented and early starch and soluble carbon measurements at an exact temperature of approximately 3.4°C. It is now to be studied in different weather and biological processes. In the article, Arco Molina et al. 6 examined the occurrence by changing age and bark thickness of frost ring in trees, with the hypothesis that certain variables can play a role in physiologic processes that improve the temperature resistance to freezing, impacting the constantly changing tissue. In the article, Hänninen 7 volume describes the annual period with different properties, including the timescale of bud explosion and other phonologic activities, seasonal photosynthesis, or frost resistance of the plants. In recent decades, the annual cycle, especially in the prediction of environmental impacts from climate change, has been used more and more dynamically in eco-physiological studies. Bachofen et al. 8 presented differences in the hardening cycles between species highlight the importance of analyzing cold hardiness repeatedly during potentially vulnerable times to predict species range changes in the context of climate change, between February and July, on seven occasions.
The rest of the article is arranged as follows. Section “Literature review” addresses the literature work. Section “Material” presents the material. Section “Methodology and materials” presents the methodology. The result and discussion are presented in section “Results and discussion.” Section “Conclusion” presents the conclusion of the article. Section “Future work” discusses the future work.
Literature review
According to Salazar-Gutiérrez et al., 9 the purpose of this analysis was to establish the essential temperatures of apple flora blooms in various stages of development, from sleeping to full bloom. Salazar-Gutiérrez et al. 9 used the HPFM method for analyzing the damaged root. Based on time series cold experiments with trees extracted from four seeds source populations and tree-planting sites, Martin et al. 10 assessed the timing of cold hardening between Abies sachalinensis populations. Martin et al. 10 measured the timing of cold hardening between A. sachalinensis populations using time series frozen experiments with trees harvested from four seed source populations and three planting sites. The researchers 11 focused on longevity diameter at the breast, height, stem shape, apical supremacy, vegetative, plant root bud break, and biotic or abiotic damage. Style and Worster 12 presented the study on pure ice sublimating and solid form into an unsaturated atmosphere. Their findings may be used to predict the appearance of frost flowers (FFs) in climate models. Martin et al. 10 presented in a laboratory analysis on the growth and effects of these flowers also on the temperature of an indirect radiometer on new snow at various temperatures. Hara et al. 11 proposed the seasonal sea-ice zones and described sea-salt cycles. Bowman and Deming 13 purposed at FFs developed in a frozen lab from such a pathogen saline solution, as well as FF produced naturally in the marine (April) and the central North Sea. Martin et al. 14 differentiated between direct physiology-related effects on freezing sensitivity and indirect phenology-driven CO2 and warming effects. Vitasse et al.’s 15 aim in this study is to provide a summary of the interaction between leaf phenology and species-specific freezes sensitivity. In their study, Feng et al. 16 presented an freeze injury comprehensive evaluation index (FICEI) model for the estimation of the winter crop. Wang et al. 17 presented that hyperspectral will quickly gain the spectrum between each pixel in a picture and track plant condition in a secure way.
Liu et al. 18 introduced three adaptive threshold segmentation techniques that have been used to isolate the field’s plant crops from the soils in this report. Wang et al. 19 in their study used winter wheat as an experiment object to predict the freeze damage stress intensity of winter wheat developing under natural conditions quickly and reliably. According to Basler and Körner, 20 anthropogenic climate change has a major effect on physical and biological processes around the world, as well as on some continents. Hegland et al. 21 presented in the impact of plants and pollinators on climate change and address how increased temperatures will affect their interactions. Primack et al. 22 proposed a spring phenology study on 12 taxa: six trees, three birds, one frog, and two insects. To investigate the dynamic interactions of temperature, site impacts, and latitude on phenology, Sujatha et al. 23 created a hierarchical Bayesian model, and compared the performance of machine learning and deep learning (DL) algorithms, which are Random Forest (RF), Support Vector Machine (SVM), and Stochastic Gradient Descent (SGD) to detect the citrus plant disease. Brun-Laguna et al. 24 informed us about the frost in 2013, and the whole production of peach orchards gets destroyed due to the frost event. In Diedrichs et al., 25 forecast of frost event usage machine learning methods is recommended. In Armoniené et al., 26 the RGB Image processing Phenotyping Laboratory (LCP Laboratory) has been developed for low-cost image and analysis. These protocols can be used to build low-cost imaging systems for limited research studies and learning. Hanson et al. 27 presented an innovative method to the study of a plant infection detection system based on leaf classification tasks using convolutional neural networks (CNNs). Sardogan et al. 28 presented the method in order to detect and classify tomato leaf disease using the CNN model and Learning Vector Quantization (LVQ) algorithms. A method was introduced in Kumar and Vani 29 used a CNN to detect tomato leaf disease. Madhulatha and Ramadevi 30 used a DL technique to detect the symptoms of plant diseases at an early stage and classify plant diseases based on the symptoms. In Gu et al., 31 the robot can be used to protect field plants, control corn diseases and plant diseases, and achieve human–machine separation.
The citrus detecting system developed with a DL neural network was acceptable for citrus planting in the natural habitat. Citrus detect mode presented by Chen et al. 32 was based on DL and CNN. Lauguico et al. 33 presented a method for distinguishing three different diseases from healthy grape leaves and considered the system’s confidence value in detecting the classes. In this study, Convolutional Neural Networks were used to detect plant illnesses and diagnose them using plant leaf images. The accuracy rate of the SmallerVGG model was higher at 87% than the sequential model’s was at 65%. 34
In this article, we analyzed the impact of frost on plants and flowers, how frost affects the roots and decreases the development of plants, vegetables, and fruits. After that, we forecast the frost to develop and how we can take steps to protect our crops. Frost event modeling includes a complex decision analysis that uses statistical probability and economists. For frost event prediction, we introduced the CNN model system and used the conv1d algorithm to analyze one-dimensional (1D) data. After that, we preprocessed the data set, which is our model contribution. The findings were analyzed against four weather stations in the United States. The results showed that our configuration of the CNN model is reliable.
Material
Frost effect on plants
Low temperature affects living plants and their structures. If the temperature goes below zero degrees, then chilling and freezing damage occurs. Freezing risk often depends on the conditions of the formation of ice.
Frost damage to plant cells
Frost is an important event because a plant’s tissues get damage when there are ice crystals, or the temperature goes below zero degrees. When the temperature goes below 0 C, there will be crystals around the nucleus. Tissues that are in secondary growth are usually get affected by freezing; this can also cause a shrinkage effect on cells. As intracellular ice is created, exothermic ice is produced at a low temperature than extra-cellular ice creation. Lower temperature induces species and seasonal variations. It interacts with molecular bonds such as hydrogen, prominent to membrane destruction and inhibition of macromolecules along with enzymes and operational proteins. Intracellular ice development naturally prevents cell death under natural conditions.
Frost damage to plant structure
The ice present on the outside of the plant cell puts a strain on cell walls and creates osmotic disturbances. The increased volume of this ice results in frost cracks in the wood. Once the sap freezes, it increases the stiffness of wood, which can tolerate the weight of ice and snow. Apo plastic water makes water fluxes when there are consecutive melting and freezing. Ice expands during freezing, and then air bubbles are expelled, making the xylem embolism. The diameter of the conductor is a significant element in the sensitivity of xylene. Due to the freezing event, embolism damage 100% of the water content in Quercus robur, but only 0% in Pinus sylvestris. However, species that are having narrow xylem elements can also make embolisms after the freezing event. Hydraulic conductivity is lost due to the low temperature in xylem conduits. Trees that contain narrow xylem do not get affected by freezing and grew more energetically. Therefore, winter embolism is a significant aspect of controlling tree appearance. Consecutive melting and freezing can also cause a deficiency in apple trees, and this phenomenon is well-known as “frost-fatigue.”
Table 1 shows that many countries have frost events, and frost has damaged the plants, crops, and fruits. We have elaborated on the countries with their frost damage and showing the accuracy of how much they are predicting the frost event. Some countries are predicting at the accuracy of 93%–95%, but we have done 98.86% to save the crops and plants earlier and before the time of frost.
Frost events predict the accuracy of the crop damage among the various countries.

Methodology and materials
Data collection and study site
We have got the historical weather data set of the United States from 10 different meteorological stations. The data set is from January 2015 to February 2019, and the stations are Rocky Mountains, Wasatch, Alaska, Arkansas, and California. The data contain several features, but we have taken the soil data to predict frost events for surface data. We have collected the whole year’s data, but we predict the frost for some months, like winter frost or spring frost. After choosing the parameters now, we must remove the data with missing values. We concentrate on this research on two concepts: more than “0” degrees and less than “0” degrees. While the high temperature is over “0” degrees, no frost will exist, although when the temperature is below null, the frost will occur. Since we use our model’s supervised process, labels are also necessary, but there are no labels in the data set; in this case, we need to describe the labels. Data collection is divided into data sets 20% for evaluation data and 80% for training.
Variation of frost event on flowers and leaves
We have collected some pictures of plants that we take before the frost and after the evaluation. There is a binary scale for frost damage where 1 is representing that there is a frost and 0 represents that there is no frost. In flowers, the frost damages the whole flower, or it damages the root that results in low production. We have analyzed frost sensitivity in flowers and leaves within species that how much frost is affecting the flowers and leaves. In the case of leaves, the frosted damage ranges between −4°C and below, and the flowers, as shown in “Figure 1,” have frost damage between −1°C and below. Reproductive structures, which are sensitive to frost, are more sensitive than plant structures. In frost, there are brown patches on the leaves, and these patches are between the veins of the leaves.
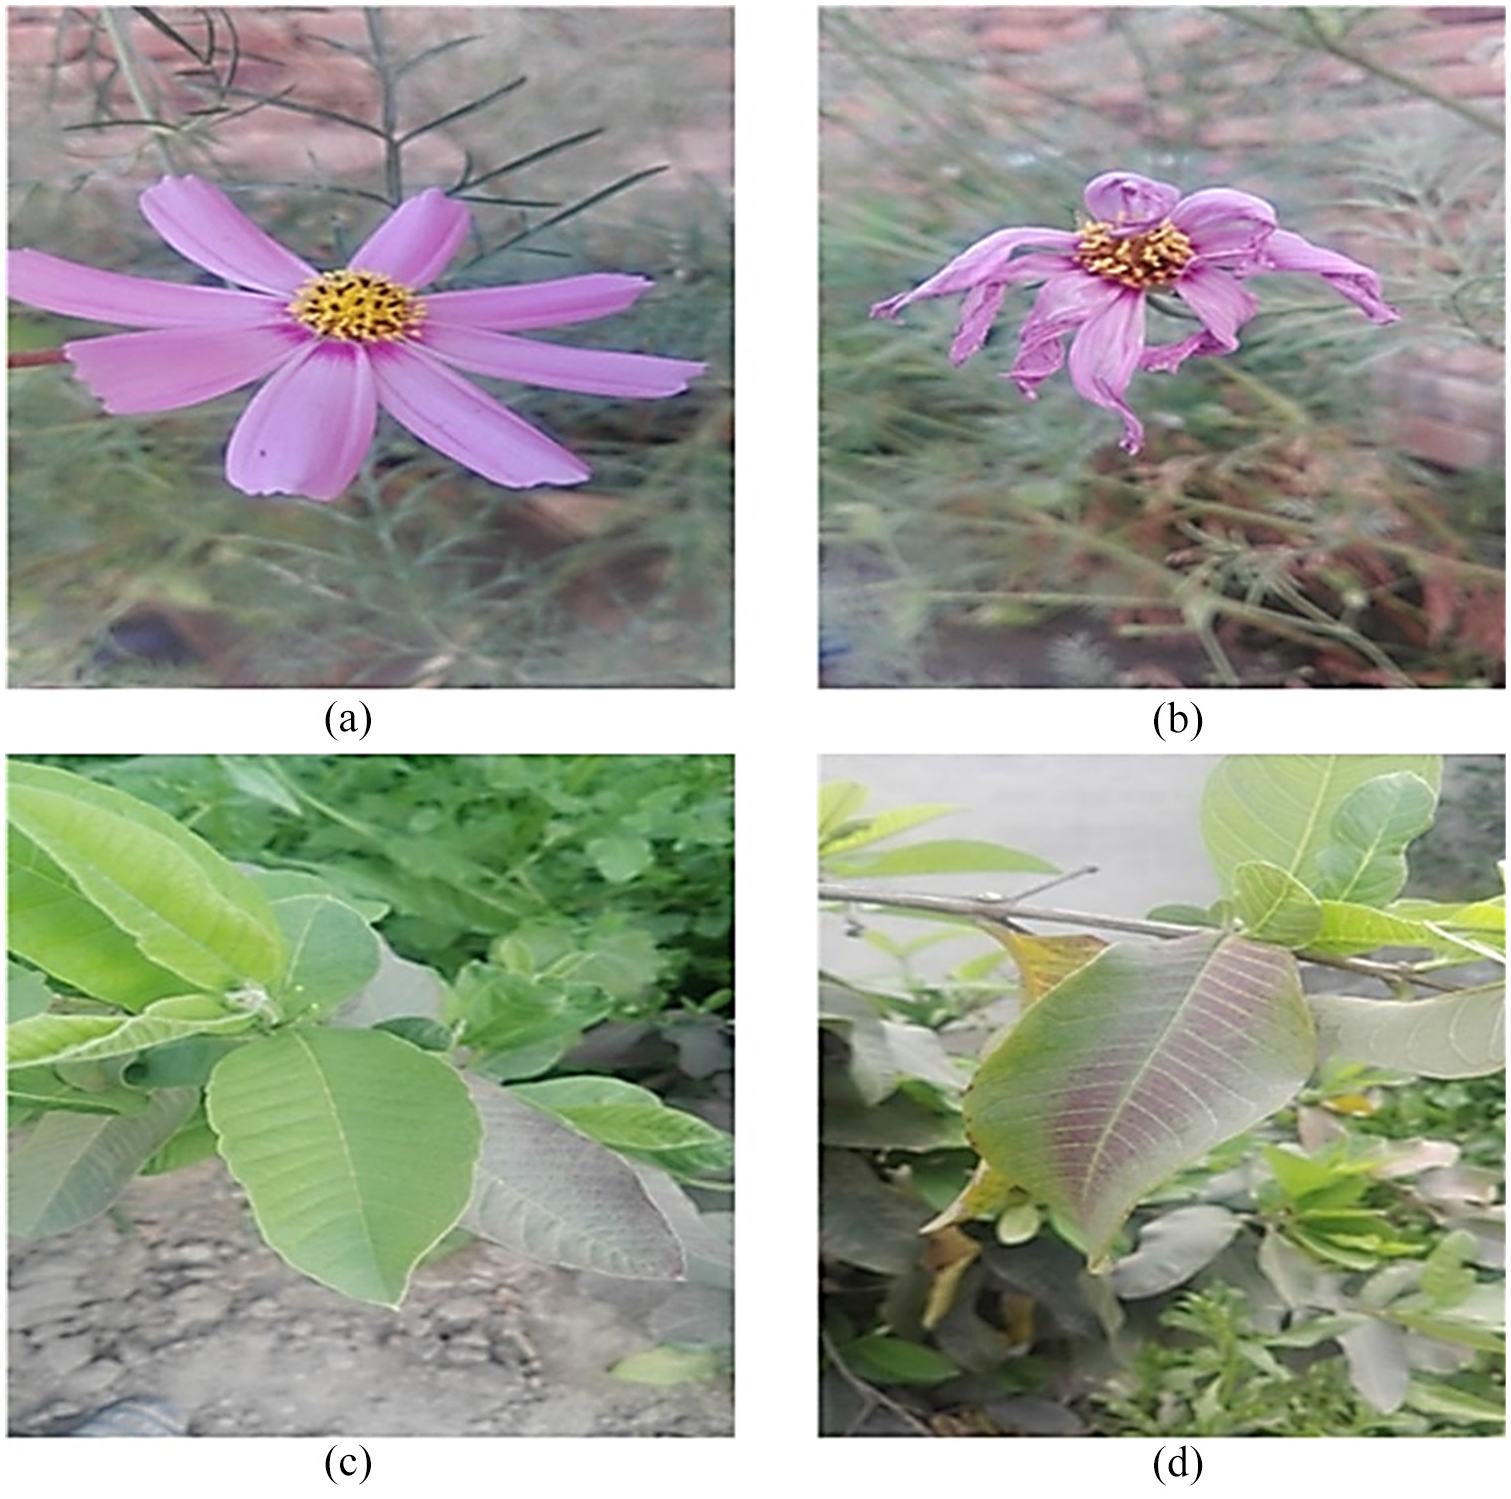
Different variation of frost event on (a) and (b) flowers ((a) flower before frost and (b) disk and petals of flower affected by frost) and (c) and (d) leaves ((c) leaves before frost and (d) leaves affected by frost).
CNN for the prediction of frost event
CNN is an in-depth learning approach that we have used to predict frost events, and this model is explained below.
Convolutional layer
The convolutional layers are the core aspect of CNN; it is the foundation of CNN. These layers perform a convolution operation on the input before passing it to the next layer. Convolution is the unit of measure of the integral of two positions when they intersect. In Python, we used the “conv1d” feature, which has several attributes as input, such as filtration system, width, and phase. The kernel scale is between 1 and 2. We used a Gaussian distribution to set the values of the filtration and biases. Our next layer is the pooling layer, so the output of the convolution layer will be the input of the pooling layer. “Equation (1)” shows the formula for a convolutional layer that we used

where
Pooling layer
In CNN, the pooling layer is located between the convolutional layers. This layer’s role is to reduce the amount of data processing and variables in the network; this also helps to control over-fitting by reducing the network size. This layer has two functions: average pooling and highest pooling, but we have used the highest pooling with a pool size of 1 1. In the highest pooling, the filtration will drag through all the input, selecting only the most important parameters and removing the remainder. The network will be down-sampled using this technique. “Equation (2)” depicts the formula used in the architecture of the pooling layer
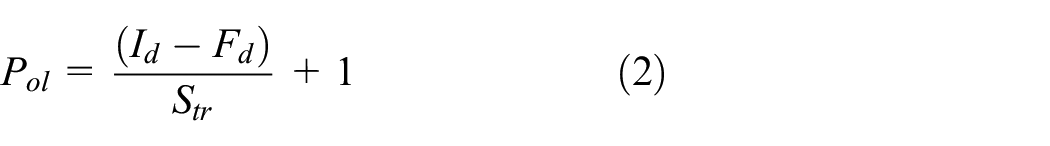
where
Fully connected layer
A fully connected layer is also known as Multilayer Perceptron, and each neuron is connected to the previous layer’s neuron. The network of convolutional layer network is made up of fully connected layers and hidden layers. It can be computed by matrix multiplication with a bias effect. This layer also helps in mapping the input and output layers.
Activation function
The activation function is a non-linear transformation applied to the input signal, with the output sent to the next layer as input of neurons. We used the ReLU and LReLU functions because the ReLU function does not always stimulate all neurons at the same time. Its computation is thus faster and more effective than “tanh” and sigmoid functions. Negative values are also removed from its activation map by setting them to zero in ReLU. Both “equation (3)” and “equation (4)” describe these functions
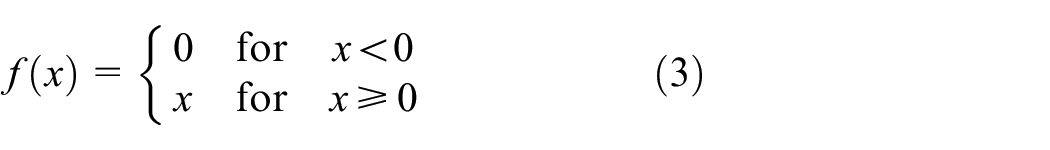
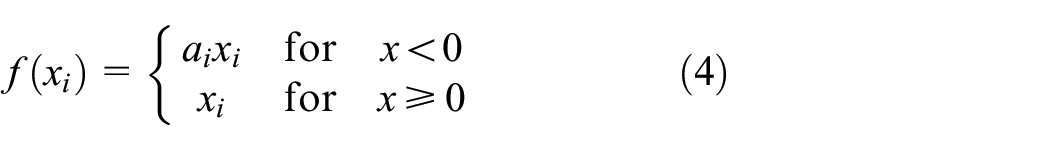
“Equation (3)” represents the ReLU functions, and equation (4) represents the LReLU task. In this equation, both

“Equation (6)” is the modified kernel function that we obtained after the estimate

Figure 2 demonstrates the architectural framework of the CNN model. We have a convolution layer and a minor number of convolution layers to enable the model to compute efficiently and accurately. We then have a convolution layer in the center and the output for the pooling layer, and the input of an interconnected layer. We still use two completely linked layers; our kernel scale is 2 2 with a filter size of 32,64,96. The pooling layer is just 2 in height; our data set involves a variety of tests, 80% of which are used for training samples and 20% for testing the study. Afterward, we obtained our findings completely interconnected in the form of a diagrams matrix with accuracy.

Structural design of CNN model.
Results and discussion
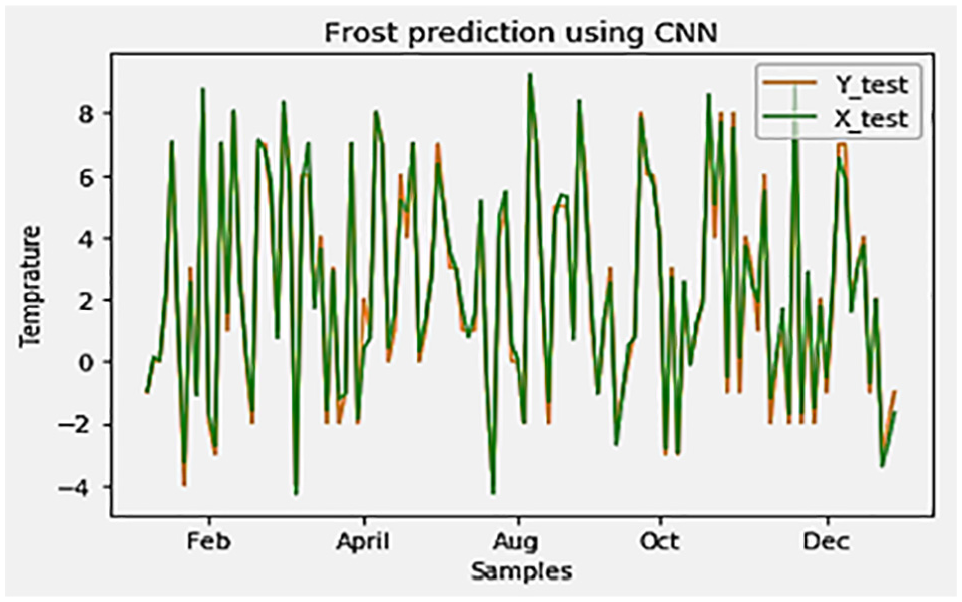
In “Figure 3,” X indicates the test data model, where Y is the test data set. X and Y are two different stations from which data for testing purposes are obtained. We have developed a testing model. We obtained data from a variety of meteorological stations around the United States. Then, forecasted frost occurrences and plotted them. In this graph, there are two color lines in which the orange line is signifying the training data while the green is labeling the testing data. The occurrence of hoarfrost will occur if the high-temperature value is less than “0” degrees.

Forecast of hoarfrost event using CNN.
Moreover, if the high temperature is over “0” degrees, there would be no hoar frost. Figure 4 depicts the model’s error rate, which was derived by calculating the difference between actual and estimated data. “Figure 4” displays the inaccuracy ratio that how much error is there in prediction and how accurate our prediction is. Our prediction is stronger than the less error rate. The difference between the forecasted and actual rates was used to compute the error. Because we used data from different sources, the outcome varies depending on the data they provided, and thus the number of iterations we performed. As indicated in Table 2, we have determined that the setup of our model is now more practical and efficient. We predicted the accuracy of the frost event in Figure 7, where the accuracy of 30,000 iterations is 97.6%. It is shown that the behavior of the data is linear. While the accuracy of 50,000 iterations is 98.6%. By doing the comparative analysis, we came to know that this CNN model is more feasible and efficient. While the number of different iterations used, we can improve the accuracy and predict the early frost event. Table 1 depicts the problem of frost events and the resulting damage to plants, crops, fruits, and other agricultural products in a variety of nations. With various nations, some studies have obtained an accuracy of 93%–95%, but we have reached a better accuracy of 98.6% in virtual data from the United States.

CNN model of error rate.
The result of the model using different data sources.

Using data from January 2018 to December, we have also forecast the frost occurrence; as seen in “Figure 5,” the orange line defines the testing data, while the green line is training data, “Figure 6” shows the model’s error rate on a 1-year data collection.
Forecast of frost occurrence via 1-year data.

Inaccuracy rate model of 1-year data set.
The accuracy is improving when we have the number of iterations, shown in Table 2. We have used the data of different meteorological stations, so the outcome fluctuates according to the data. By doing the comparative analysis, we came to know that this model is more feasible and efficient. The number of iterations and accuracy is shown in “Table 2.”
In “Figure 7,” we have an accuracy graph with 30,000, and in “Figure 8” 50,000 iterations. It shows that at 30,000 iterations, we have 97.6% accuracy, and at 50,000 iterations, we have 98.6% accuracy. The purpose of the accuracy graph is to show that our prediction of frost events is at higher accuracy.

Prediction accuracy at 30,000 iterations.

Prediction accuracy at 50,000 iterations.
Conclusion
Climate change causes several changes in the physical environment, such as plants and leaves. Natural climate and local weather extremes have an impact on flowers and plants. The anticipated increase in frost events, however, causes sensitivity in plant reproduction and plant structure vegetation. Plant life’s ability to avoid frost may be dependent on the timing of its growth and reproduction. In this article, we have assessed the effect of frost on plants and flowers, how the frost is damaging the roots, and production of plants, vegetables, and fruits get reduced. After that, we have to forecast the frost occurrence to take measures to save our crops. The forecast of hoar frost events includes complex decision study that utilizes conditional probability and economists. For frost event prediction, we implemented a CNN model method and have used a conv1d algorithm to analyze the 1D data. First, we have preprocessed the data set, which is our input for the model. The results have been evaluated against four meteorological stations in the United States. The results have shown that our configuration of the CNN model is efficient.
Future work
In the future, we will create three CNN models: one layer in one model, two layers in the second model, and three layers in the third model. We will embed those models into the structured model and take the average of three models and test the model. After that, we can also merge this model with the RESNET model and build a novel model by merging the two models, which will result in higher precision of the forecast with less computation.
Footnotes
Handling Editor: Francesc Pozo
Declaration of conflicting interests
The author(s) declared no potential conflicts of interest with respect to the research, authorship, and/or publication of this article.
Funding
The author(s) disclosed receipt of the following financial support for the research, authorship, and/or publication of this article: This work was supported, in part, by the National Social Science Foundation of China under grant no. 21ZDA033, by the National Natural Science Foundation of China under grant nos 71771118 and 72071104, by the Ministry of Education Humanities and Social Sciences Foundation of China under grant no. 18YJCZH146, and by the Key Project of Jiangsu Social Science Foundation under grant no. 20GLA007.