
Abstract
Intrusion detection systems play a vital role in traffic flow monitoring on Internet of Things networks by providing a secure network traffic environment and blocking unwanted traffic packets. Various intrusion detection systems approaches have been proposed previously based on data mining, fuzzy techniques, genetic, neurogenetic, particle swarm intelligence, rough sets, and conventional machine learning. However, these methods are not energy efficient and do not perform accurately due to the inappropriate feature selection or the use of full features of datasets. In general, datasets contain more than 10 features. Any machine learning–based lightweight intrusion detection systems trained with full features turn into an inefficient and heavyweight intrusion detection systems. This case challenges Internet of Things networks that suffer from power efficiency problems. Therefore, lightweight (energy-efficient), accurate, and high-performance intrusion detection systems are paramount instead of inefficient and heavyweight intrusion detection systems. To address these challenges, a new approach that can help to determine the most effective and optimal feature pairs of datasets which enable the development of lightweight intrusion detection systems was proposed. For this purpose, 10 machine learning algorithms and the recent BoT-IoT (2018) dataset were selected. Twelve best features recommended by the developers of this dataset were used in this study. Sixty-six unique feature pairs were generated from the 12 best features. Next, 10 full-feature-based intrusion detection systems were developed by training the 10 machine learning algorithms with the 12 full features. Similarly, 660 feature-pair-based lightweight intrusion detection systems were developed by training the 10 machine learning algorithms via each feature pair out of the 66 feature pairs. Moreover, the 10 intrusion detection systems trained with 12 best features and the 660 intrusion detection systems trained via 66 feature pairs were compared to each other based on the machine learning algorithmic groups. Then, the feature-pair-based lightweight intrusion detection systems that achieved the accuracy level of the 10 full-feature-based intrusion detection systems were selected. This way, the optimal and efficient feature pairs and the lightweight intrusion detection systems were determined. The most lightweight intrusion detection systems achieved more than 90% detection accuracy.
Keywords
Introduction
In the last decade, the field of Internet of Things (IoT) has expanded greatly, with more than 20 billion interconnected devices, including computers, different kinds of smart tools, conventional or smart sensors, and fast 4G and 5G Internet access devices being used in different types of traditional or smart applications, such as health care, education, energy, and transportation. It is expected that, due to the rapid increase and proliferation of IoT devices, this number will reach 50 billion by 2030. 1 Such large numbers of interconnected devices constantly exchange and transmit a huge quantity of data (Big Data), making IoT systems a target to various types of cyberattacks.
Furthermore, IoT systems do not have a single-standard architecture that is internationally recognized by researchers and engineering developers. The basic architecture of IoT consists of three layers,2–4 while other researchers suggest four- and five-layer architectures.5,6 Having no standard architecture, naturally, causes security and privacy issues because smart environments consist of different types of IoT systems including several distinct sensors, different hardware tools, or software applications from various technology companies that do not share a universal standard language. 7 Besides, IoT fully depends on Internet connection in all its architectures. It uses communication technologies such as Radio Frequency Identification (RFID), 8 Near Field Communication (NFC), 9 Bluetooth, 10 Wi-Fi, 11 and Long-Term Evolution (LTE), 12 which have become the biggest target of cyber threats such as service attacks, authentication problems, Denial of Service (DOS), and Distributed DOS (DDOS) 13 on the Internet. Being the number one target for cyber-attackers with such kinds of cyber threats is a daunting challenge for researchers, IoT manufacturers, and even for IoT users. In addition, IoT networks suffer from power efficiency problems.
To overcome these challenges, serious and realistic security and investigation measures such as lightweight (energy-efficient) network intrusion detection, malware detection, and network forensic systems need to be effectively developed and implemented in the place of traditional heavyweight intrusion detection systems (IDS) which are built on full or inappropriate features of datasets. Thus, conventional heavyweight IDS which are based on data mining, fuzzy techniques, classical neural networks, genetic algorithms, neurogenetic algorithms, particle swarm intelligence, rough sets, and statistical learning and classical machine learning (ML) algorithms are not suitable for the IDS on IoT networks. 7 For these reasons, there is a need for robust, high-performance, and lightweight artificial intelligence (ML and deep learning) algorithms that can detect network attacks efficiently and take necessary countermeasures. To develop such algorithms, well-structured and representative datasets are paramount for training and validating the credibility of systems. 14 Although a wide range of studies has been conducted in this area, IoT has become such a topic that needs to be researched and developed further and deeper, since cyberspace is very broad, and attacks in cyberspace are random and unpredictable. In addition to this, there are enough research gaps in terms of methodologies, implementation, and datasets. To address these deficiencies and fill the gaps, it is very important to conduct extensive and comprehensive research on anomaly detection using ML algorithms, real and realistic datasets, and, especially, the impacts of dataset features on the accuracy of ML models. 15
Based on the nature of algorithms, each machine or deep learning model depends on distinct features in a dataset. For example, features with a linear trend nature have high impacts in linear methods such as linear regression, ridge regression, or linear support vector machines (SVM), whereas nonlinear algorithms will leverage the more complex and complicated links in the data. Thus, different features or feature pairs should be investigated and implemented with various techniques, discovering which features have a more significant, greater impact on the accuracy and performance of these models. Furthermore, IoT devices constantly generate data. This huge amount of data is called big data, and it increases by gigabytes every day. Therefore, the size and dimensionality of big datasets are astronomical. Hence, determining and estimating which features (which columns) of a dataset are crucial allow us to analyze and focus on the parameters that are the most effective, saving valuable time and resources. Moreover, machine or deep learning–based anomaly detection systems or network forensic systems are usually trained with datasets via random features or full features, which leads to low accuracy rates or has negative effects on the performance of a system. In addition, due to the explosive growth in energy consumption and high costs of using these cloud-based ML systems, energy-efficient workflow scheduling under budget constraints becomes the most challenging issue. Very few pieces of research that consider the stated issue have been reported. Most of them mainly focus on minimization of schedule length under user-specified budget constraints or energy consumption constraints. 16 Due to these reasons, robust, lightweight, and energy-efficient IoT network IDS are vital to protect such systems optimally efficiently.
To address these challenges, we proposed a new approach that can help to determine the most effective and optimal feature pairs of datasets which facilitate improvement of the accuracy and performance of intrusion or anomaly detection systems on IoT network systems. For this purpose, we chose the most popular 10 ML algorithms and the most recent and realistic Bot-IoT dataset by the School of Engineering and Information Technology, UNSW Canberra Cyber, University of New South Wales Canberra, Australia. We generated 66 unique feature pairs out of the 12 best features of the dataset. Actually, 10 best features were utilized in the original paper where the Bot-IoT dataset was presented. However, in the article, it was recommended to use 12 best features; thus, we have utilized 12 best features. We have trained ML algorithms with 10 best features, and 12 best features at the same time, but we achieved higher accuracy via 12 best features. Therefore, we have used the 12 best features as was recommended in the original paper. The selected ML algorithms were trained via the generated unique feature pairs. Next, the feature pairs that performed best and with the highest accuracy were determined as the most effective and optimal trainable input data. In addition, we also investigated which ML algorithms were the most appropriate and optimal in terms of accuracy and performance for online and offline IoT network IDS to be developed using the Bot-IoT (2018) dataset. The entire system can be seen in Figure 1. The contribution of the study is as follows:
Real-time energy-efficient and lightweight IDS that can perform an incoming network traffic packet in less than 0.01 ms was developed in this study.
Ten ML and the recent Bot-IoT 2018 dataset were utilized to develop the lightweight IDS. Twelve best features recommended by the dataset developers were chosen. Next, 66 unique feature pairs were generated from these features.
Ten IDS were developed by training the 10 ML algorithms with the full 12 features; 660 feature pair-based lightweight IDS were also developed by training the 10 ML algorithms via each of the generated 66 feature pairs. Consequently, we obtained 10 heavyweight and 660 lightweight IDS which belonged to the 10 algorithmic groups, including K-Nearest Neighbors (KNN), Linear SVM, Radial Basis Function (RBF) SVM, Gaussian Process (GP), Decision Trees, Random Forest, Neural Networks, AdaBoost, Naive Bayes, and Quadratic Discriminant Analysis (QDA).
Next, the 10 heavyweight IDS and 660 lightweight IDS were compared based on the algorithmic groups. For instance, the KNN-based heavyweight IDS trained via the full 12 features was compared to each of the 66 KNN-based lightweight IDS trained via each of the 66 feature pairs. Then, the optimal and efficient feature pairs were determined by the accuracy and packet execution time variables. This way, we have shown that high-accuracy and high-performance IDS could be developed by training ML algorithms with just a feature pair.

The developed system. Left side represents 660 lightweight IDS trained with every single of 66 feature pairs. Right side is 10 IDS trained via full 12 features of the Bot-IoT dataset (2018).
A brief outline of the remaining parts of the article is as follows. In the “Literature review” section, a summary of traditional IDS and machine and deep learning–based IDS is described. “The proposed approach” section presents the methodology. The “Experimental setup” section explains the experimental setup. The “Results and discussion” section includes the results and discussion, and in the “Conclusion” section, conclusions are provided.
Literature review
The battle between cyber-attackers and security developers or researchers has been going on since the first computer virus which was known as the “Creeper Worm” in 1970s and the boot-sector virus “Elk Cloner” in 1980s were created. For instance, according to Symantec, smartphone malware threats increased by 54% in 2017, whereas attacks on IoT devices increased by 600%, with the Mirai botnet and its distinct versions serving as the vehicle for some of the most potent DoS and DDoS attacks in history. 17 Generally, regular/traditional computer networks share a unique and universal language, whereas IoT network systems do not have such a standard mechanism since IoT systems consist of different types of hardware tools, conventional or smart sensors, and software applications from different companies. Regular computer networks contain seven-layer, well-defined architectures, while IoT network systems do not have a unique, defined, and standard number of layers in their architecture. In addition, regular computer network systems share unique, well-defined communication protocols, but IoT networks do not have standard data communication and transfer protocols. Therefore, traditional computer networks generate well-structured network traffic flow packets in each layer while the IoT network packets can be different depending on the hardware tools, sensors, and software application used in these systems. 18
Naturally, cyber threat developers have been innovating different types of viruses, threats, and attacks every day, while countermeasures against these threats, viruses, and attacks have been developed by cybersecurity researchers and developers. Countermeasures (intrusion detection, malware detection, and network forensics systems) have been developed using distinct methods and techniques such as conventional heavyweight IDS based on data mining, fuzzy techniques, classical neural networks, genetic algorithms, neurogenetic algorithms, particle swarm intelligence, rough sets, statistical learning and classical ML algorithms, artificial intelligence (large, complex machine and deep learning) techniques, and other conventional anomaly detection methods. However, these conventional heavyweight approaches are not energy efficient and do not perform as accurately as expected due to inappropriate feature selection or the use of full features of datasets. Classical IDS methods are usually trained via full features of datasets or they use inappropriate features (columns) of datasets. These conditions increase the time complexity of packet processing and they cause more energy consumption. On the contrary, IoT systems need IDS systems with low power consumption, because IoT systems mostly suffer from power efficiency problems. Thus, lightweight (energy-efficient) IDS are needed to replace heavyweight IDS which are built on full or inappropriate features of datasets. Due to these reasons, the accuracy and performance of these methods drop significantly. 19
As it was reported in most intrusion, anomaly, or malware detection survey studies, conventional IDS approaches face challenges in terms of their high false-positive rates and computational complexity. High false-positive and false-negative rates reduce the Quality of Services (QoS) of such a network system. If any user packet is dropped by mistake, the user will suffer a billing error, and the user packet will be delayed. Anomaly-based IDS also face challenges with regard to illegal analysis methods, such as packet-based methods, that infringe on user privacy. 20 However, lightweight ML algorithms have a clear advantage over other traditional techniques, and they are replacing these conventional methods due to their high ability and high performance in detecting cyber threats and attacks by dynamic learning from huge volumes of data. 21
ML is a subfield of artificial intelligence that can extract necessary, useful knowledge and information from very complex and large volumes of data using its supervised and unsupervised learning techniques. Hence, this area has made incredible strides in the field of computer vision, speech recognition, natural language processing, and cybersecurity over the past decade. In general, ML methods in the fields of intrusion, malware, and anomaly detection have been categorized into three groups such as static, dynamic, and hybrid (static + dynamic) methods. 22
Static methods use manually extracted rules and static features with statistical approaches, while dynamic algorithms utilize dynamic rules and features extracted via flexible and dynamic approaches that do not rely on experts’ prior knowledge of the domain to define discriminative features. Furthermore, static methods are based on static analysis which is impractical and computationally prohibitive, and they detect anomalies without running the content of an incoming packet file in contrast to dynamic methods which recognize malicious programs by running them on virtually dedicated environments. 23 Static approaches are far faster than dynamic models. However, they cannot detect anomalies that have not been defined in their blacklist. Unlike static methods, dynamic models can detect most malicious packets using their characteristics and activities extracted from dynamic features without any prior knowledge about the incoming packets. 22 Because of the aforementioned reasons, dynamic ML algorithms have become an essential part of intrusion and anomaly detection systems. As usual, conventional techniques utilize static features, whereas dynamic ML approaches use the dynamic features of an incoming IoT packet. A categorization of static and dynamic features is illustrated in Figure 2.
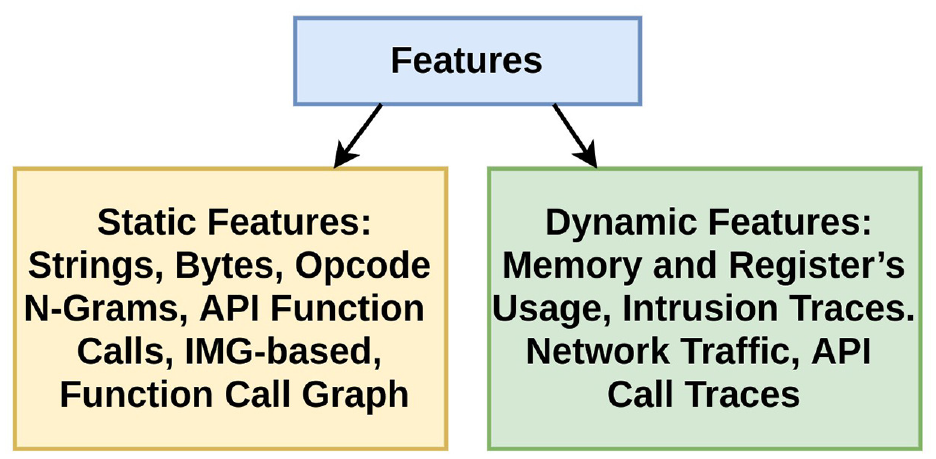
Feature taxonomy: static and dynamic features.
Dynamic features are extracted from the execution of a program or an incoming packet at runtime. Analysis of a program or an incoming packet using dynamic methods has been carried out by observing the packet for whether it follows normal programming or network instructions or it misuses the memory and central processing unit of a device. The monitoring process reveals process creation, file, and registry manipulation, and modifications of memory values, registers, and variables. 22 For instance, researchers 24 proposed a method to distinguish benign programs from malicious programs using the features of memory and registers usage, while another previous study 25 developed a method that performed dynamic analysis on virtual machines (VMs) to extract program run-time traces from both benign and malicious executables. Besides, in previous studies,26–28 network traffic features such as Hyper Text Transfer Protocol (HTTP) and Domain Name System (DNS) requests, host-based events, and metadata such as IP addresses, ports, and packet counts have been actively utilized to detect and classify packets as normal or threats, while other studies29–33 have presented a dynamic approach to detect malicious programs using Application Programming Interface (API) call traces. Here, all these approaches have been developed using ML algorithms, and these methods have conditionally been categorized as dynamic learning approaches for malware or IDS by previous studies. 22 Moreover, it is presented that all of these methods are fully dependent on datasets and their example feature (column(s)) because these techniques generalize features using their linear and nonlinear functions to extract crucial information and knowledge about programs and packets, classifying them as anomaly or normal labels.
IDS are divided into three classes based on signature, anomaly, and specification according to the detection method. A signature-based IDS matches network traffic patterns to the existing attack patterns in a database. If a match is found, an alarm is issued. 34 A signature-based IDS have a high accuracy and low false alarm rate, but it cannot detect new attacks. A specification-based network IDS maps parameters to a predefined set of rules and specifications to detect malicious activity. 35 These rules are specified manually by the user. Unlike the signature and specification-based IDS, an anomaly-based IDS constantly checks network traffic for any deviation from the normal network profile. 36 If a deviation exceeds the threshold, an alarm is issued to indicate intrusion detection. The normal network profile is learned using ML algorithms. 37 An anomaly-based IDS is preferred over signature and specification-based IDS because of its ability to detect new attacks. The efficiency of anomaly-based IDS increases considerably with the quality of the network traffic models that are used. 38 Once the system is trained, it can effectively detect new attacks. Intrusion detection in IoT networks aims to classify network traffic according to the normal or attack classes with a trained classifier, maximum accuracy, and minimum false alarms (FAR). 39 The classifier’s high performance in terms of accuracy and FAR depends solely on the chosen lightweight algorithms and the choice of training data. Researchers or security professionals prefer high-performance lightweight ML algorithms for the task of intrusion detection. 40 Due to these reasons, the essence of robust datasets and their features cannot be underestimated in creating a successful intrusion detection model for IoT systems using ML algorithms. 41
In the literature, there is a large number of datasets for intrusion detection, but most of them do not fit the general FAIR 42 concept for dataset requirements. The FAIR concept defines four principles that scholarly data should fulfill, namely, Findability, Accessibility, Interoperability, and Reusability. 43 A dataset may be utilized to train an ML algorithm when it fulfills this concept. There are less than 10 anomaly detection datasets in the literature, and among them, the recent Bot-IoT dataset is the only option for IoT botnet detection, because other datasets do not contain any information about the botnet scenarios on IoT. In addition, previous datasets are not well-structured, while the Bot-IoT (2018) dataset is well-structured, and it includes more than 40 features (column(s)). 14 For these reasons, we chose the Bot-IoT (2018) dataset in this study. Furthermore, correctly selected feature (column)s are as essential as correctly labeled datasets, because selecting the right features or feature pairs helps improve the accuracy and performance of IDS. However, in the Bot-IoT (2018) dataset, as with other datasets, there is no clear information on what features or feature pairs of this dataset are more important, and which of these features or feature pairs is more compatible with which ML algorithms. Due to these reasons, we proposed a new system that helps determine the most import features or feature pairs and the most compatible ML algorithm for intrusion and anomaly detection systems in the field of IoT.
The proposed approach
In this study, we propose a new approach that helps to determine the most effective and most optimal features or feature pairs of datasets which can help improve the accuracy and performance of the intrusion, malware, or anomaly detection systems of IoT devices. For this propose, we chose the 10 well-known ML methods and the latest Bot-IoT (2018) dataset. Furthermore, we also aim to discover which ML algorithm(s) is the most appropriate and optimal in terms of accuracy and performance for IDS to be developed using the Bot-IoT dataset.
The ML methods and the dataset
ML algorithms are a repetitive process that mainly consists of four stages such as gathering available data, cleaning and preparing the data, building models, and validation and deployment into production (Figure 3). For data collection, there are two methods including data acquisition from real-life surveys or experiments and generating synthetic data. In the first method, the data are collected directly from the field if it is possible to obtain the data by observing or experimenting from real life. If data are not available, the dataset is generated programmatically. For this study, we opted for the realistic Bot-IoT (2018) dataset which had been developed using simulation tools that imitate a real IoT environment. Figure 3 depicts the test-bed of the Bot-IoT dataset, in which several VMs are connected to local area network (LAN) and wide area network (WAN) interfaces in the cluster and linked to the Internet through the pfSense machine.

The simulation of IoT services system. 14

Main workflow diagram of machine learning algorithms.
On Ubuntu VM platforms, the Nod-RED was used for simulating various IoT sensors (weather station, smart fridge, motion activated lights, remotely activated garage door, smart thermostat), which were connected to the public IoT hub, Amazon Web Services (AWS). Java scripts on the Nod-RED were developed for subscribing and publishing IoT services to the IoT gateway of the AWS via the Message Queuing Telemetry Transport (MQTT) protocol. The pcap files were collected using this virtualized setup. Then, the normal and attack traffic flow data were extracted, and the created dataset was saved as a “.csv” file. The dataset contained more than 73 million records and 42 features (28 original and 14 derived feature columns). It was claimed by researchers that they selected 3 million most important packets (rows) and the most important 10 features using the Correlation Coefficient and Entropy 44 techniques, and they tested these with three ML algorithms such as SVM, recurrent neural networks (RNN), and long short term memory (LSTM). 14 However, we selected 12 features (10 best + sport and dport) and 10 popular, lightly structured ML approaches instead of three large-structured deep learning architectures because of performance concerns. The selected classification algorithms for this study were K-Nearest Neighbors, Linear SVM, RBF SVM, GP, Decision Tree, Random Forest, Neural Net, AdaBoost, Naive Bayes, and QDA. The brief descriptions for these classifiers are given below.
K-Nearest Neighbor is a simple classification algorithm that categorizes input data using k > 0 neighbors and similarity measures like the Euclidean distance (see equation (1)) or other distance measures such as the Minkowski or Manhattan. The principle behind nearest neighbor methods is to find a predefined number of training samples closest in distance to the new point and predict the label from these. The Euclidean distance measure is used in this article. The number of neighbors was taken as k = 3 after some experiments

where D is the distance, k is the number of neighbors, and
The idea behind the linear and RBF SVM is separation of input data into several classes using linear or nonlinear hyperplanes. The algorithm creates a linear function (equation (2)) for a linear SVM and a nonlinear function for an RBF SVM (equation (3)) which separates the input data into binary classes. The separating line of an SVM function is called a hyperplane

where
The RBF SVM algorithm is also similar to the linear SVM method, but it uses a radial basis nonlinear function kernel instead of a linear function. These linear and RBF binary SVM algorithms provide an efficient classification environment in dealing with extra-large datasets (for instance, several millions of training data pairs). In our case, there were 3 million records in the dataset, so the methods that were used are some of the ideal classification techniques for the study. The regularization parameter C = 0.001 was used for linear SVM, and C = 1 was used for the RBF-based SVM classifier in this article. Degree = 3 and gamma = 2 were set for both classifiers since there are two normal and attack class labels

The GP classifier is a supervised ML algorithm which is utilized in binary logistic regression and binary classification tasks. It predicts the label of input data with probabilistic confidence level interpolating the observations in a training dataset using Laplace approximation. The GP function (equation (4)) is specified by its mean

The Decision Trees algorithm is established on tree-structured rules. The rules are extracted using an entropy information gain function (equation (5)) or the Gini approach, while the Random Forest algorithm constructs its classification model with several individual decision trees. It pools all prediction values from the individual decision trees to make a final decision. The decision tree does not generalize from the training data but memorizes all samples since a nonparametric supervised learning method is used for classification. It usually results in overfitting; however, it performs better when the dataset is well-structured and accurately annotated. In addition, the Random Forest classifier overcomes the overfitting cases using several weak decision trees
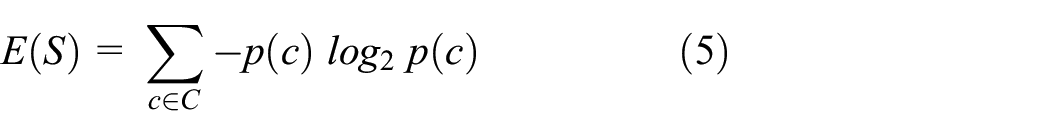
where S is the feature of the current dataset, C is the set of the classes, c is the label, and p(c) is the probability of the classes.
A Neural Network is a system that imitates the human brain. It contains the input–output layers, the hidden layer(s), neurons, activation, and decision functions as in equation (6). In our case, we chose a simple, three-layered neural network. Larger neural networks could be constructed, because more layers and more neurons provide higher accuracy. However, this decreases the performance of a system. The Rectified Linear Unit (ReLu) was used as the activation function. The Adam optimizer approach was used for weight optimization in this study. The learning rate was 0.001, and decay was 0.9

where y is the predicted label,
The AdaBoost classification algorithm is an ensemble algorithm like the Random Forest algorithm. The logic behind it is combining several weak classifier algorithms under one system. It classifies input data using this function as in equation (7). The main difference between the AdaBoost classifier and the Random Forest approach is that the former makes the final decision combining through a weighted majority vote (or sum) of the weak decision tree classifiers. For this study, 50 weak decision tree classifiers were selected, and the learning rate was chosen as 1.0

where
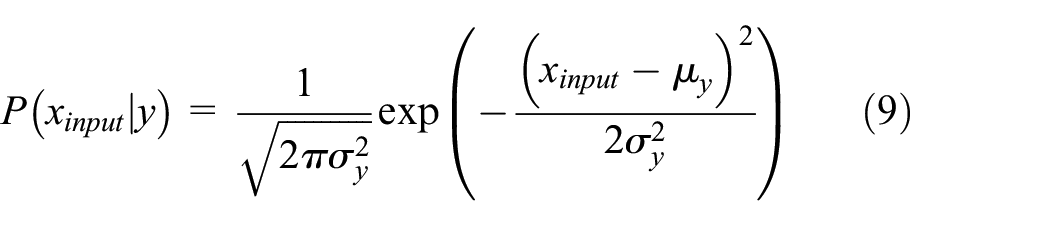
The Naive Bayes classifier performs the task of classification using the Bayes’ probability theorem as in equation (8) which relies on the assumptions between feature vectors. In our case, it categorized an input packet into class labels as normal and attack using the “naive” assumption of conditional independence between every pair of features such as sport–dport and sport–state_number. Thus, the classifier is best fit for determining the optimum feature pairs based on the likelihood of the features (equation (9))

where
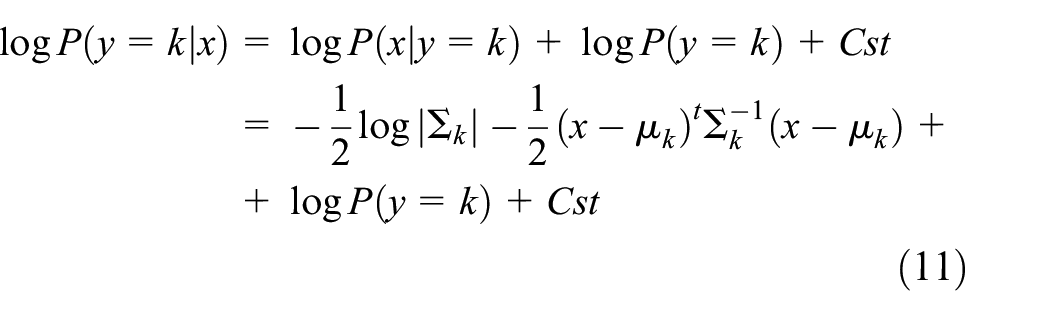
QDA is a nonlinear example of linear discriminant analysis that uses the measurement assumptions of each class which is normally distributed. It classifies input data according to the distribution of a feature vector. More specifically, for linear and QDA, it is modeled as a multivariate Gaussian distribution (equation (10)) with density

where d is the number of features, and in our case, it was 2 for feature pair training and 12 for full feature training. According to the model above, the log of the posterior (equation (11)) is
The model of the proposed system
The model included four steps. The first step was cleaning the dataset and normalization. The Min–Max Scaler transformation method was used to scale all selected features into the [0; 10] range (equation (12)). This was because it helps ML methods to converge and generalize the training data focusing on the extremum points

where X is an input feature,
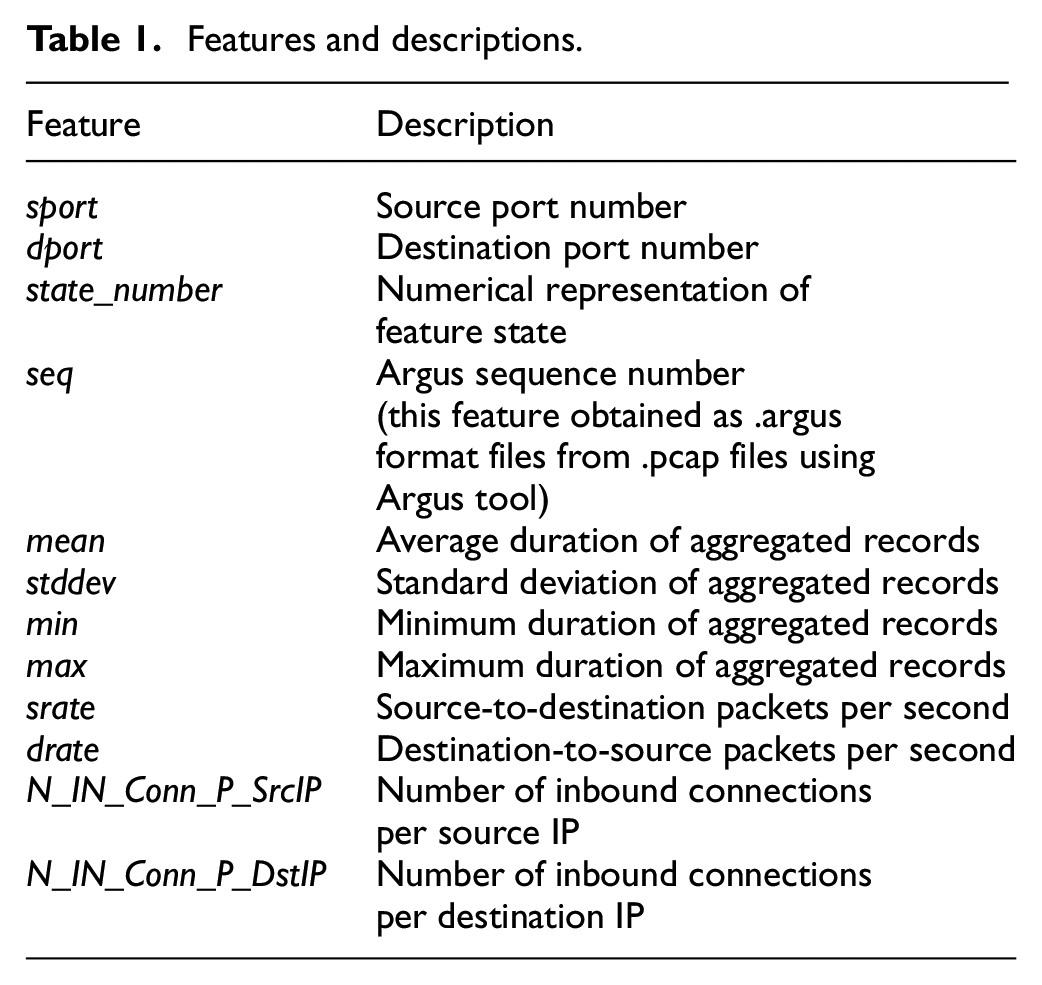
The second step was generating the distinct feature pairs. We used the permutation technique without repetition and replacement to find out the distinct pairs among the 12 features. The selected features are illustrated in Table 1. There were 66 generated unique feature pairs. In the third step, we built the 10 ML models and fed the data with all features and each feature pair one by one to the models so that we could calculate the difference between the accuracy values of when an ML algorithm is trained with full features and a certain feature pair. This way, we estimated which features or feature pairs were the most effective and optimal for a certain type of ML-based intrusion detection algorithm. Then, in the last step, we measured the accuracy and performance of the models, validating them on the test data. All accuracy and performance values by the feature pairs and ML algorithms were stored in the two-dimensional (2D) array. We determined the effective and optimal feature pairs and algorithms, minimizing the accuracy (equation (13)) and time complexity (equation (14)) values with full features and feature pairs training. The block diagram of the entire system is illustrated in Figure 5. In Figure 5,


where
Features and descriptions.

Flowchart of the proposed approach.

Training and test accuracy results of the machine learning methods trained with the feature pairs. The first raw represents the ML algorithms, the first column represents feature pairs (as
Experimental setup
In this study, we used a computer with 4 GB RAM and a conventional CPU, and the Google Colaboratory TPUs and GPUs to train and test our system. We chose 10 well-known, lightweight ML algorithms. Different datasets were examined for this study. However, we opted for the recently released realistic Bot-IoT (2018) dataset because it includes usual IoT and other types of network traffic, as well as distinct kinds of common botnet attacks and threats. Training and testing systems were developed using the Python programming language due to its wide range of flexible ML and other scientific frameworks such as Scikit-learn (for data preprocessing, and ML training and testing), 45 NumPy (for matrix processing), 46 Pandas (for reading data from a file, data handling, and writing the processed data), 47 and Matplotlib (for displaying data and results). 48
The dataset was divided into two parts, 80% training and 20% test sets, as it was recommended in the original paper of the dataset. Then, 66 unique feature pairs were generated, and IDS were developed by training ML algorithms once with all the features and once with each of the generated 66 unique feature pairs. This way, the most efficient and optimal feature pairs were determined by comparing the time complexity and accuracy based on the algorithmic group. IDS that were developed by training ML algorithms with the most efficient and optimal feature pairs of the dataset were considered as energy-efficient (lightweight) IDS.
For the accuracy calculation of the classification systems, we used a conventional accuracy calculation metric which is known as the confusion matrix (equation (15))

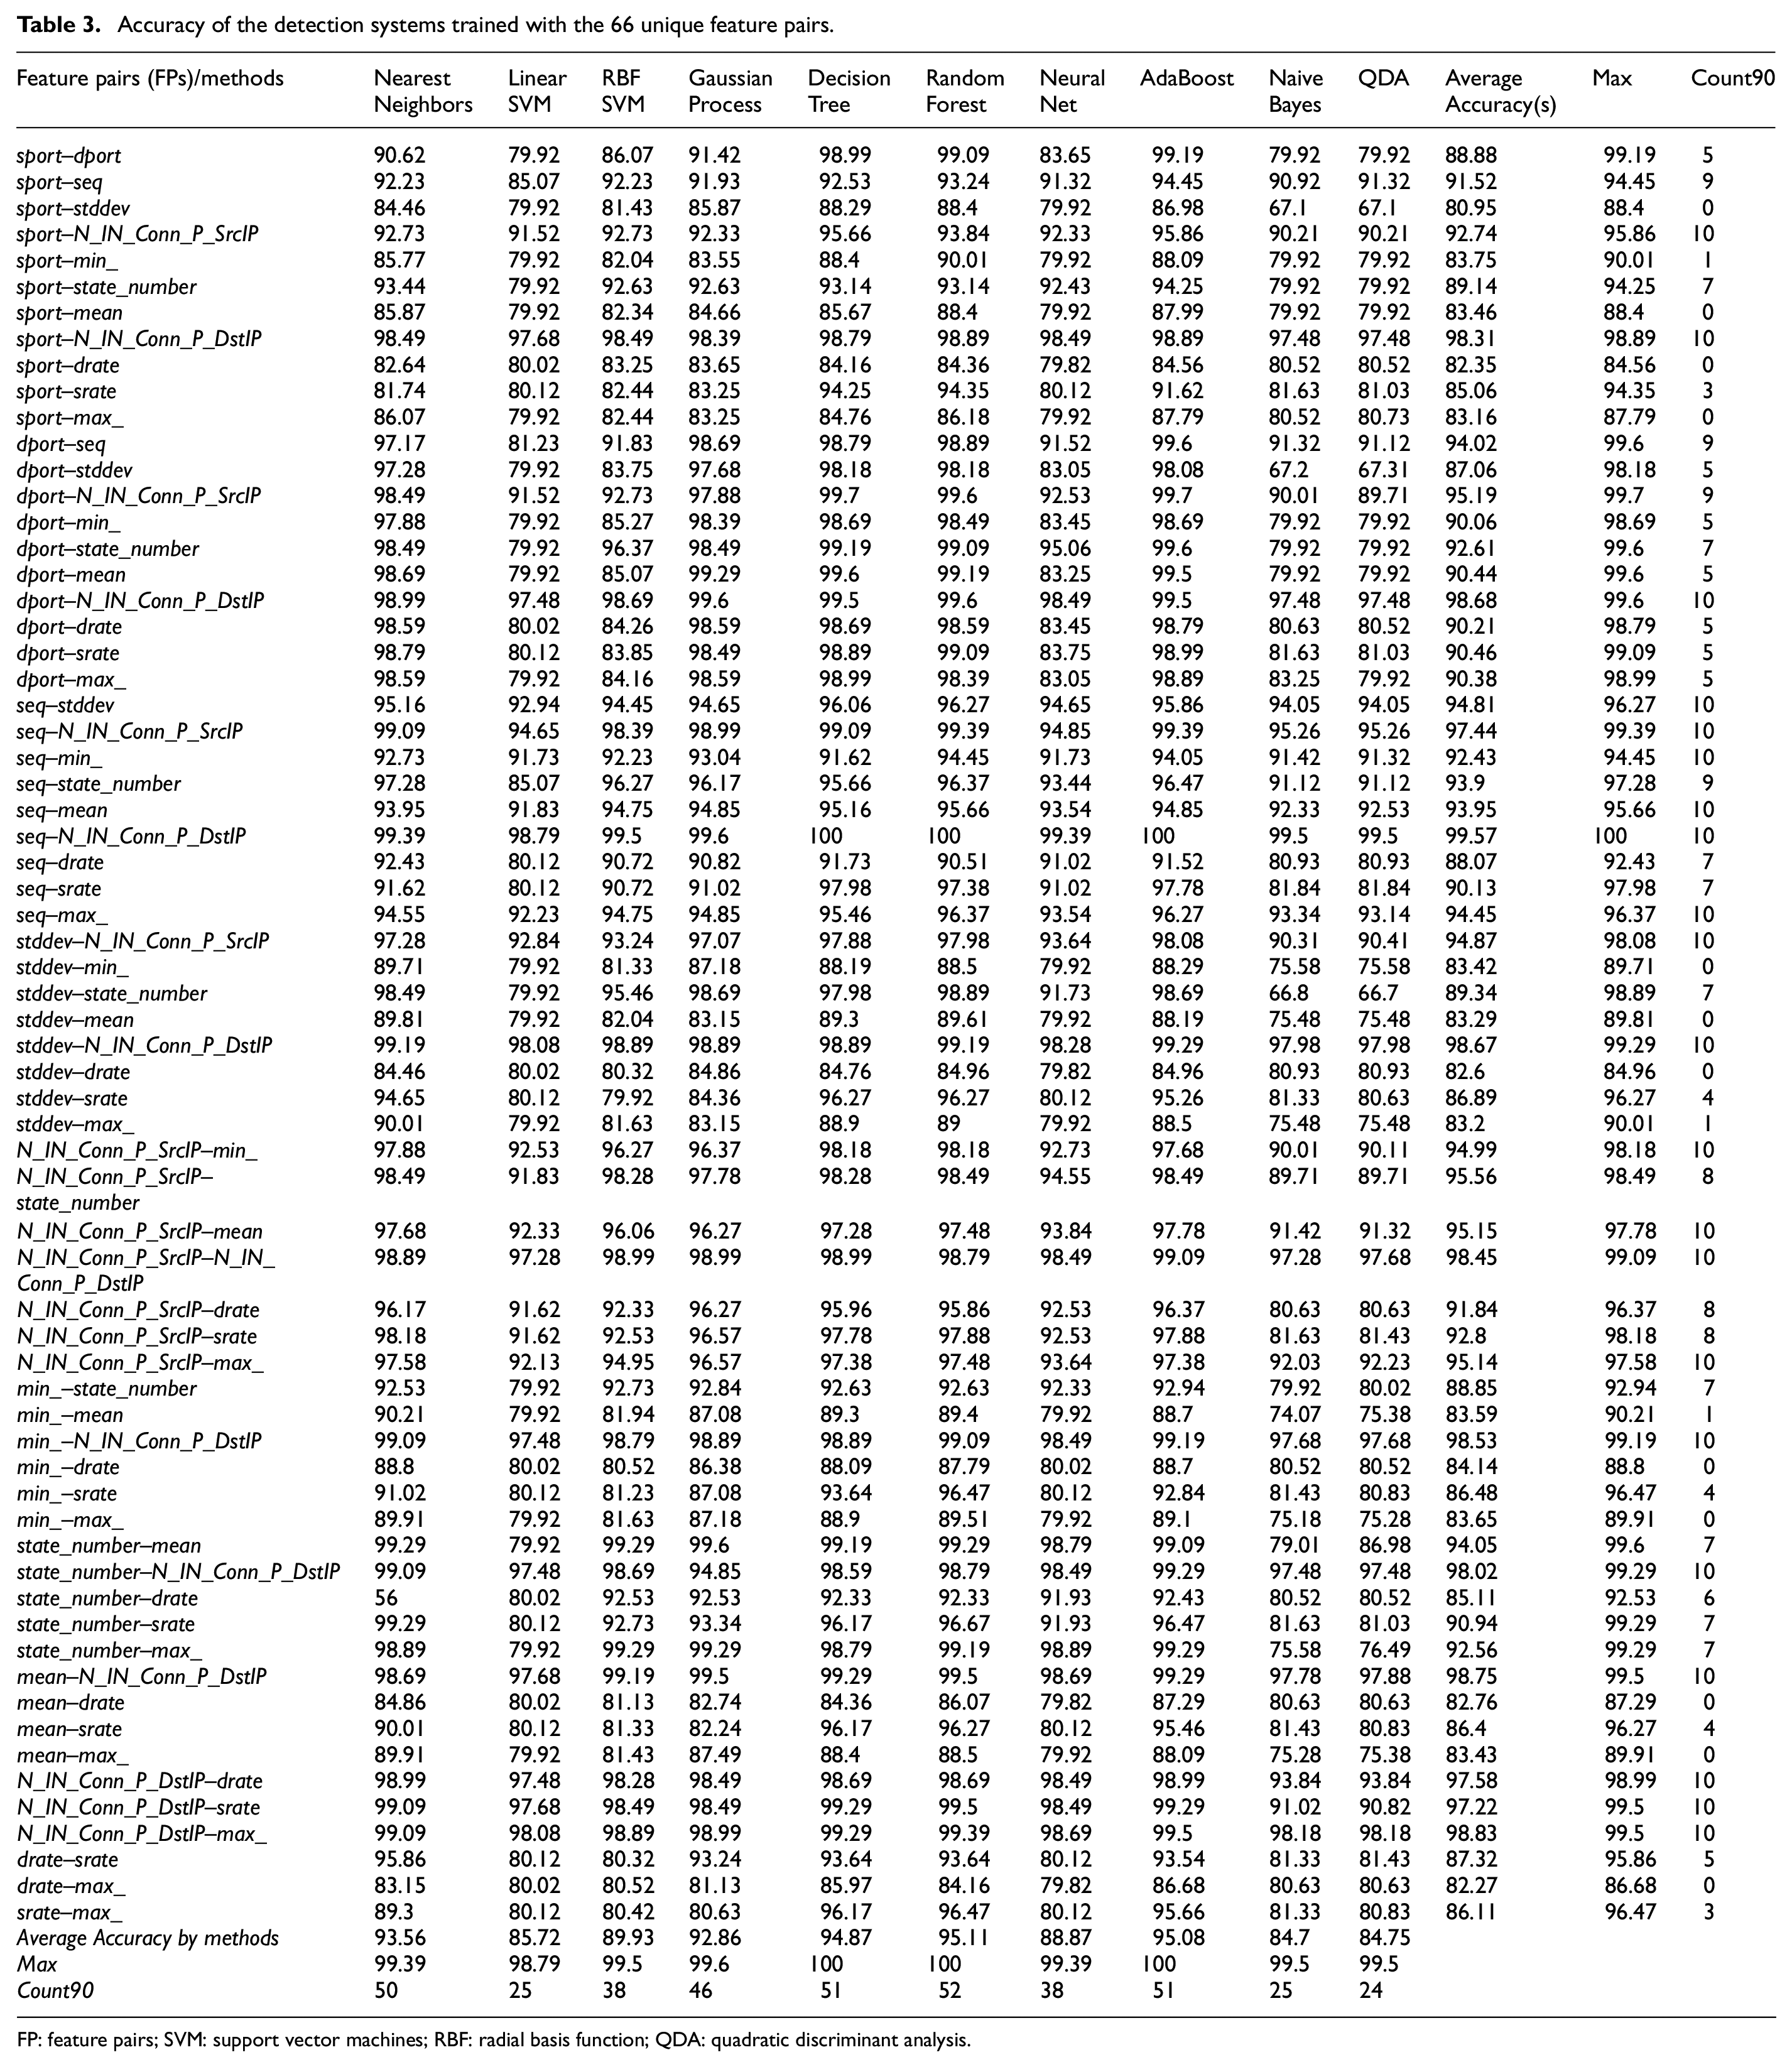
According to these measures, the difference between the accuracy values of two systems trained with full features (Table 2) and a certain feature pair (Table 3) is minimized as in equation (13). The execution time (see Table 5) values of these botnet detection systems that were trained with full features and feature pairs were minimized via equation (14) to determine which algorithm(s) and what features performed the most effectively and optimally.
Overall accuracy and F1-score values of the IDS, and execution time for an incoming packet when the systems trained with full features.

IDS: intrusion detection systems; SVM: support vector machines; RBF: radial basis function; QDA: quadratic discriminant analysis.
Accuracy of the detection systems trained with the 66 unique feature pairs.
FP: feature pairs; SVM: support vector machines; RBF: radial basis function; QDA: quadratic discriminant analysis.
Results and discussion
In this study, we developed lightweight IDS using ML algorithms and by determining the optimal feature pairs of the Bot-IoT (2018) dataset. The results of the study suggested that in determining the most effective and optimal feature pairs, and ML algorithm(s), the distributions of the input feature pairs (input data) are very important and critical. The distribution of an input feature pair parameter is a crucial factor due to the reason that the normally distributed
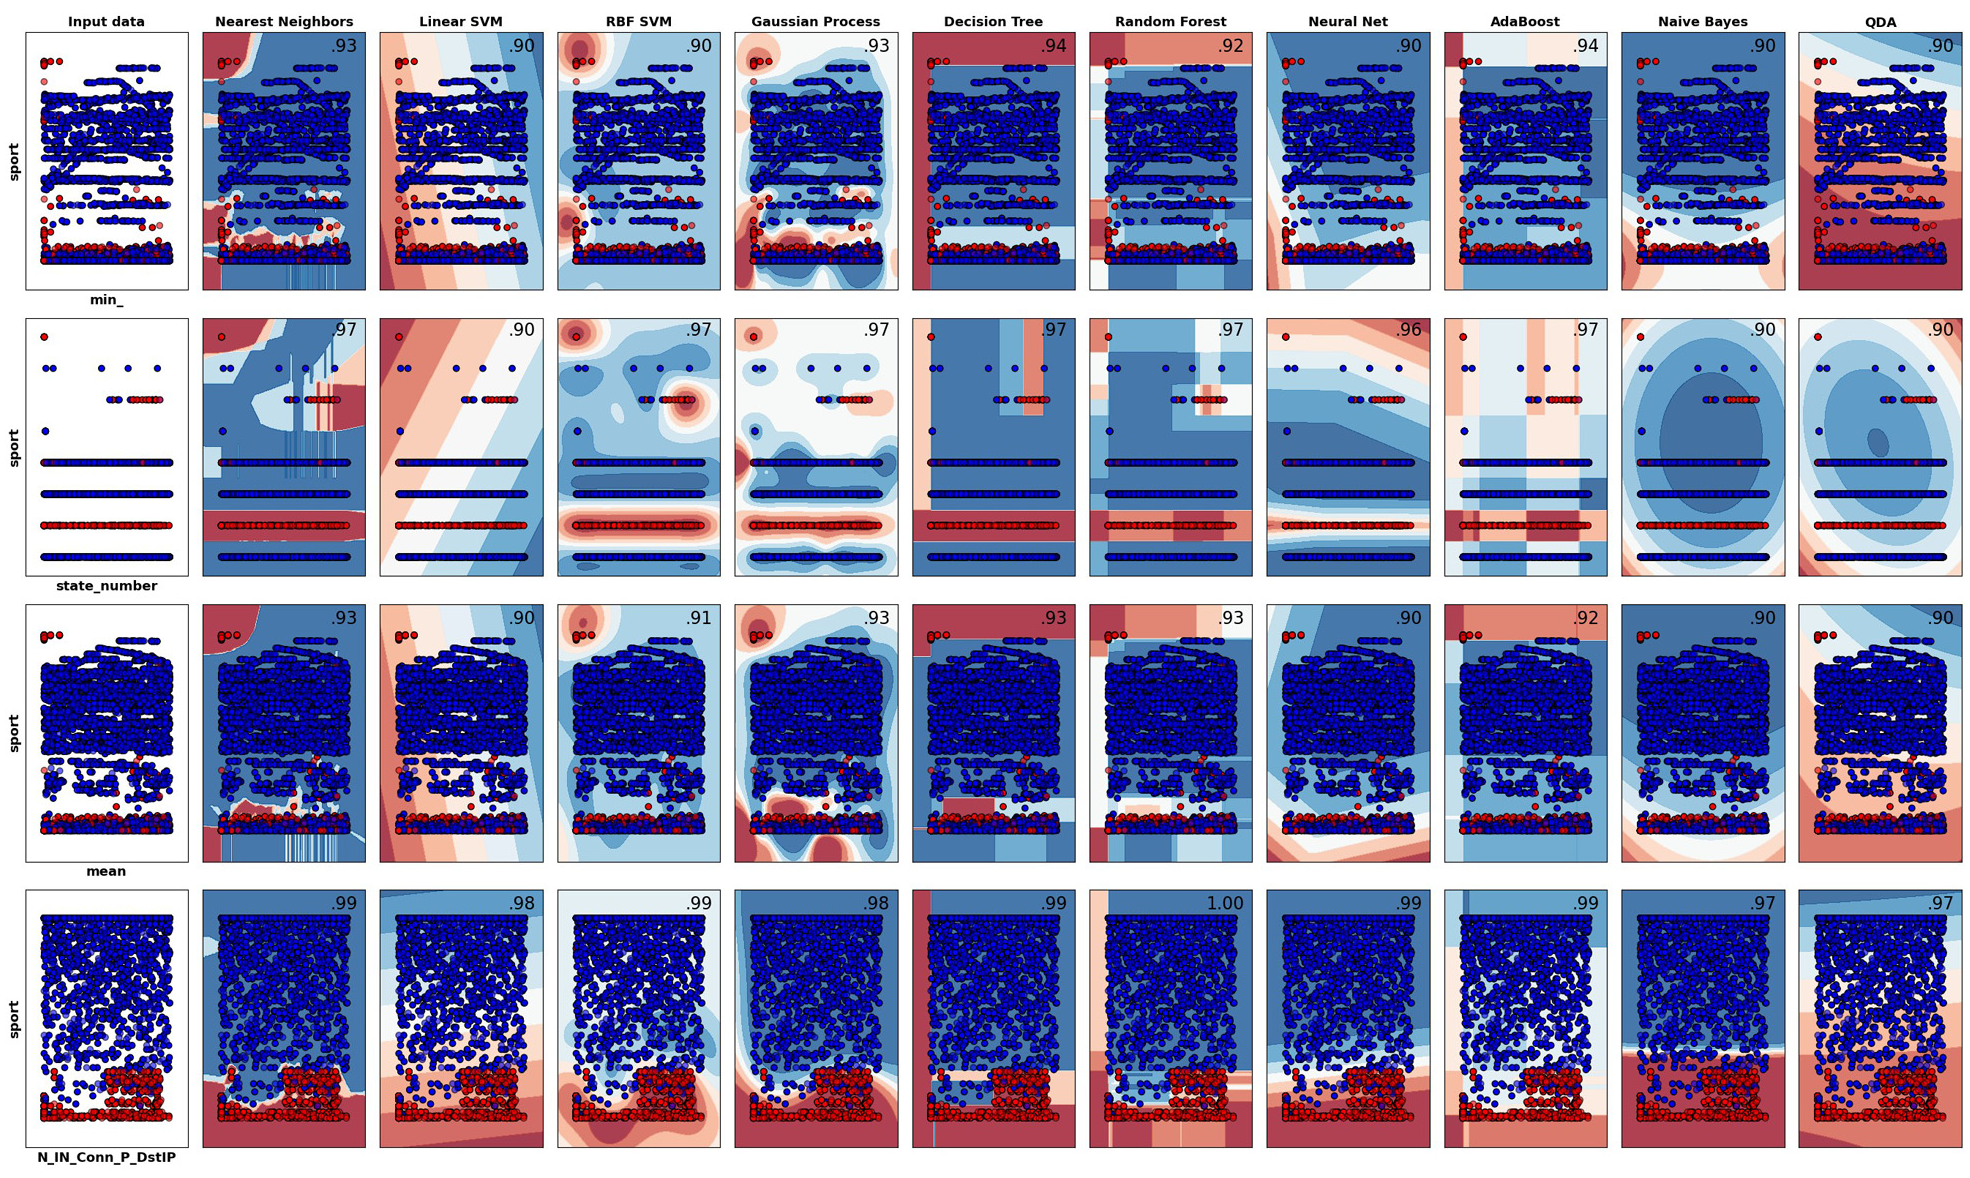
Training and test accuracy results of the machine learning methods trained with the feature pairs. The first raw represents the ML algorithms, the first column represents feature pairs (as
F1 score of the detection systems trained with the 66 unique feature pairs.

FPs: feature pairs; SVM: support vector machines; RBF: radial basis function; QDA: quadratic discriminant analysis.
Every single one of the 66 feature pairs can be used for a certain type of ML algorithm. For example, the feature pairs state_number–N_IN_Conn_P_DstIP, or N_IN_Conn_P_DstIP–max, or seq–min, or seq–stddev performed significantly well with the linear SVM due to the reason that these pairs were linearly distributed, while the feature pairs such as dport–seq and dport–state_number achieved better accuracy with the RBF SVM which was because these input data were distributed nonlinearly. However, 37 out of 66 pairs could be used for all 10 methods because when all 10 algorithms were trained with these feature pairs, an intrusion detection accuracy rate of over 90% was achieved, and this is illustrated in Table 3, with the column “count90.” If the number in this column was greater than 7, a feature pair was considered best, because the number 7 means a certain feature pair performed well when it was fed to 7 ML algorithms. In addition to this, four ML algorithms, namely, Nearest Neighbors, Decision Trees, Random Forest, and AdaBoost, were determined as the most effective and optimal ones due to the reason that they produced more than 90% accuracy when they were trained with more than 50 different feature pairs separately (Table 3, row “count90”). However, none of these algorithms was good enough in terms of performance when they were trained with full features and thousands of input data, since they make decisions by comparing an input packet to thousands of trained examples in their memory. Therefore, selecting normally distributed feature pairs is vital to building a real-time botnet anomaly detection system when the Bot-IoT dataset is used. Although we can achieve a desired real-time performance when these methods are trained with a feature pair and less than 50,000 example packets, they will fail in real-time IDS if they are trained for more than 50,000 input data with a feature pair since these methods compare thousands of memorized examples to each incoming packet.
Furthermore, the time complexity appeared very well (under 0.4 ms to process an incoming packet) for all feature pairs and ML algorithms. For this very reason, the models in this study were trained with just 2500 packets (the network packets were randomly selected from 3 million records). However, this would not provide such a good performance when the systems were trained with thousands or millions of network packets (Table 5). Although the overall accuracy rates of some models were above 80%, none of them could be used for a real-time IDS, because these models were very slow. For example, the algorithms such as Nearest Neighbors and GP categorize input packets into the anomaly and normal classes by comparing the input data to all packets stored in their memory. As a result of this long comparison, the detection process takes more time. Thus, they will be unable to handle online traffic flow data; however, they are ideal for offline network traffic flow analysis systems. Other methods including Linear SVM, RBF SVM, and Neural Networks are best at generalizing input data via their activation and decision functions. This is why these three methods were better than the other methods in terms of both accuracy and performance. The methods including Decision Tree and Random Forest are very good in terms of accuracy, but they cannot be used for real-time detection systems due to their slow performance. One of the most slowing factors of these systems is that they use all the attributes of the dataset at the same time. In addition to this, detection systems such as SVM, RNN, and LSTM which were used in a previous study, 14 where the Bot-IoT dataset was created and validated, have sufficient and good accuracy. So, they are ideal for offline detection systems, but they cannot process input packets in real time, since they have been trained with full features. Another reason was that they utilized large-structured deep learning algorithms such as RNN and LSTM. However, if the features of this dataset are reduced, and then, smaller and more suitable ML architectures are used, both the accuracy and performance of the system may increase. In that case, a real-time anomaly detection system can be built with deep learning algorithms with large architectures, and it might produce the desired real-time performance, when they are trained using a certain appropriate feature pair.
Execution time in milliseconds for an input packet when the detection systems are trained with feature pairs.

SVM: support vector machines; RBF: radial basis function; QDA: quadratic discriminant analysis.
Conclusion
In this study, we developed a new approach that assists in determining the most effective and optimal feature pairs and ML algorithms. We evaluated each ML algorithm out of 10 with each feature pair of the 66 feature pairs. For this purpose, we developed a new system that included 10 ML algorithms and a feature pair generation module. The system automatically generated feature pairs from a given number of features, and it trained itself with the generated feature pairs; then it evaluated 10 algorithms in terms of accuracy and performance when the methods were trained with the generated feature pairs. In our case, 12 features were given. The system generated 66 unique feature pairs, and it fed each feature pair to a certain ML algorithm. Then, it evaluated the accuracy and performance of each anomaly detection algorithm. As a result, we determined that 37 feature pairs including sport–N_IN_Conn_P_SrcIP, seq–stddev, seq–min, and sport–N_IN_Conn_P_DstIP performed very well in all algorithms, because they were distributed very well with each other. Four ML algorithms including Nearest Neighbors, Decision Trees, Random Forest, and AdaBoost achieved a high accuracy of over 95%; however, their performance (execution time for an incoming network packet) was not good enough for real-time intrusion detection applications. In particular, if these methods are trained with millions of records, they cannot be used for an online detection system, but they are ideal for offline applications. In addition to this, methods like Linear SVM, RBF SVM, and Neural Networks also performed well in terms of both accuracy and time complexity. They were the most effective and most optimal algorithms for both online and offline anomaly detection systems when they were trained via 37 feature pairs of the Bot-IoT (2018) dataset.
Footnotes
Handling Editor: Peio Lopez Iturri
Declaration of conflicting interests
The author(s) declared no potential conflicts of interest with respect to the research, authorship, and/or publication of this article.
Funding
The author(s) received no financial support for the research, authorship, and/or publication of this article.