
Abstract
Urban green spaces are really vital for the well-being of human in urban areas. In urban planning for green space site selection, the study of the bond among the usage of green spaces and their categories that really influence their use can provide useful references. A spatial and temporal research on the allocation of visitors in 157 green areas was carried out in Shanghai to know which green spaces are denser or crowdsourced by utilizing social media big data. We evaluated the association with statistical testing and Kernel Density Estimation among the spatial pattern of the visitor spread in urban green areas. We used check-in data from social media to test this study comparing the number of humans who visit various green parks. We have classified green areas into various categories and our main findings are focused on their characteristics: (1) famous category of green parks according to visitors’ preferences, (2) Differences in the number of visitors by daytime, and (3) crowdsourced area based upon number of check-ins. The main aim of this article is to remind policy makers of the value of providing local people access to green areas and to empower cities with a framework for contacting green parks with the purpose of increasing the comfort of urban people with the architecture of smart city.
Introduction
In urban green spaces there is essential ecological, community, and traditional value. A number of studies have found that urban green areas, such as rest, 1 leisure,2,3 and a connection to nature, 1 bring health advantages and well-being. Other studies have already shown that urban greenery is a key component of environmental services that contributes directly to the extenuation of extreme temperatures,4,5 air pollution mitigation, 6 noise reduction, wildlife habitat, 7 and flood and soil erosion prevention. Surveys have shown that cultural amenities provided by green areas have also been of considerable benefit, such as protect the surface, outdoor recreation and moral and cultural values. 7
While large cities like Beijing, Tokyo, and New York have vast open spaces, the public cannot effectively use all urban green spaces. Urban green architecture involves a detailed study of the usage frameworks. Public green fields are areas where outdoor exercises can be performed by the public. Practices to expand the utilization of green areas that have a positive effect on a person’s health 8 enable people to be more physically active. As an outcome, by discovering ways in which people visit greener areas, the establishment of green urban areas to support an active lifestyle that facilitates good health can be promoted. Factors associated with human consumption of urban green spaces have also been considered in many studies. The importance of these areas has been noted for recreation, for mental and physical healing, or just for outdoor society. The manner in which green spaces are used is connected to facilities and adaptations. 9 Studies find, for example, that the existence of green spaces like tree, water, and light objects is related to body functions.10,11 Recent studies found that there are mixed effects on the usage of green spaces in urban areas due to a particular style of green space. Other studies have shown that the number of people sitting on the lawn can be related to landmarks, which are strongly isolated from urban green areas (e.g. hills or trees). Furthermore, it has been found that vegetative consistency is linked to people’s usage of urban green areas. 12
Related results were seen by research focused on internal elements that affect the usage of green parks. We also intended to examine the effect of green area visits on users’ inspection practices in this article. In different actions using park services to research parks check-in habits such as enjoyments and dislikes, we used a collection of data as a description of the personal behavior or likings of the public. The analysis also attempts to address the questions below explicitly. (1) Which parks do people want to visit? (2) How constantly changes the weekly trend? To fully recognize the relationship between green parks and tourist behaviors, we analyzed the space–time patterns of visitors of urban green parks with a large amount of approximately 30,000 checks between July 2016 and June 2017. The research took place in southeastern China, in the town of Shanghai. Our main results display users’ check-in distribution in various green parks and the use of Kernel Density Estimates (KDEs) on the basis of different categories of urban green areas. We have reconnoitered public attitudes toward green places to illuminate real-life fashions. Appraising these variables, we can explore the convention and change of urban green parks through many temporal scales. This strategy to visitors’ actions is to try and overcome the limits of the previous study in urban green spaces. This methodology is generated for sociology–ecological research of various outlets and social networks instead of focusing on the outcomes of subjective exposure and observatory results.
Related work
Usually, urban environments are characterized by declining biodiversity, elevated pollution, greater temperatures, and decreasing green areas in urban areas. With the aim to expand the quality of life in urban cities, urban green areas are critical for having a thermal balance and providing thermal comfort, 13 for people to recuperate from their everyday cognitive and emotional loads. 14 Urban green parks, which ultimately lead to an improvement in the price of land and energy use for cooling purposes, are essential in an attempt to enhance living conditions in urban environments by refining air superiority and beauty.
Urban green areas, vital for their societal, physical, and perceptive growth, are also a place to play for children. 15 Public areas were industrialized in the 19th century in the United Kingdom and in the United States to improve the welfare and living standards of the working classes under terrible circumstances. 16 The gap from home to the parks also influences the degree of use of green parks when planned for the first time; and also the future health implications resulting from outdoor land are believed. To eliminate illnesses, social tension, and violence, they needed green parks and to have “green lungs” in metropolitan areas. 16 To create healthy, secure, and productive communities, convenient access to urban green parks is increasingly important.1,17 These spatial aspects are ignored by researchers (mostly when conducting nostalgic assessments using Twitter data),1,18 or studies that take into account only the spatial aspects of visits to green parks18,19 and better health. 20 Even a small number of findings are focused on the direct effect of park visits on wellness and physical activity.21,22 Although studies have improved our understanding of psychological causes to date, one of the major limitations of earlier studies is that they depend heavily on small, mostly standardized samples of persons who are not typically illustrative of the bigger inhabitants. Likewise, these studies naturally depend on assessments engrossed on backdated self-reports of attitude and health opinions: an approach that shrinks time granularity. This guarantees the design of those evaluations to develop high-level skills over lengthy stretches. There have been many observational efforts in recent years to utilize social media data for implementation areas, and urban planning uses range from foundational tasks to extremely complex research, like verification of urban form and purpose. Facebook, Twitter, Weibo, and other big data networks have clearly been utilized to determine people’s movement and behavior, 23 but the better temporal and spatial phases of these two phenomena are mostly exceptionally difficult to establish using standardized techniques such as questionnaires or on-site annotations. In addition, the socio-spatial analysis can be performed using location-based social network (LBSN) data 24 using techniques such as the absorption or exploration of feelings and their space and time differences by the consumer tweet. Health considerations such as physical activity or diet are also taken into consideration. Campagna introduced the concept of “geographical information of social media” 25 to investigate “people’s visions and views and desires in equally time and place to encourage spatial planning and geodesign through the use of space–time analysis. ‘ Data sources other than survey data, together with cellular data, are feasible if the time-space elements of urban climate are to be better described. 26 The writers focused on smart city transport and software and innovations for smart cities.27–29
The KDE approach is often used to model the geolocation data spatially and adds a supplementary detailed and easy spatial density estimation template. KDEs have been applied to the environmental asset evaluation, for example, health properties, 30 the environment of food, 31 and entree to greenery. Converting point data to a non-stop surface and fallowing the characteristic density to be determined at any point on the surface of map 32 complements the sum of access or distance measurements. The relations between the classifications of positions, the speed of walking, and sufficient physical exercise using KDE were investigated by researchers. 32 Regarding the variables like overweight, body mass indexing (BMI), and food consumption, KDE was also used for study locations such as grocery stores. The analysts used the KDE method in the study by Li et al. 33 to assess the relative value of demand allocation variables dependent on external time and space in urban green spaces. Another important possible use of data from social networks is the exposure and interpretation of happenings or events and their influence on daily city planning procedures. 34
Materials
Study area
In the alluvial plain, the average height of Shanghai and River Delta of Yangtze is about 4 m. There is a minor terrain gradient in the east. In some south-western foothills, however, the ground is plain. The North Subtropical Moist Monsoon Area is fragment of Shanghai (Figure 1). There are four seasons with a great deal of sunshine and rain. In the metropolitan zone, however, traumatic incidents and expansion of cities have had significant impacts on people’s health systems and the economy of the country. The 10th and most bulbous agglomeration region in the world is also Shanghai. It also points to the relatively fast as well as very rapid urbanization process. Possible forecasts for future urbanization (United Nations) were presented, noting that Shanghai has the second largest urban population worldwide and the largest in China.35,36

Study area.
In fact, past research has already shown that Weibo data can reflect the preferences and attitudes of individuals in urban areas in great detail. A new model has been proposed using the check-in data from Weibo to include the parameters of the urban network and thus enhance the understanding of an urban network structure. 37 On the contrary, while Weibo check-ins are not yet popular to be used as a visiting agent, previous research that used data from equally relevant websites or networks like Facebook, Instagram, and Flickr initiate considerable useful links between official visit statistics and the number of people visiting those sites.38,39
Dataset
Details, for example, the user ID and the time and day of check-in are included in the Weibo data for the most recent analysis. In addition, from the Weibo API, geolocation data (latitude and longitude) and gender were retrieved. The data registry of the LBSN registry is, therefore, assumed to include everyday activity patterns, social media usages, and user-related spatial-time proof. 40 JSON (JavaScript Object Notation) is still the most common data format for the Java programming platform, while Java is the dominant programming language for open-source public readers and coding modules. 41 Mango DB has been used for the transformation. Data are compiled by chosen applications into a CSV format file such that all consumer data can be viewed, including geopositions, independent of advertisement period and inventory. The example of “check-in” in the CSV format is given in Table 1.
Weibo check-in.

In consideration of the issue of variability, to maintain a comparatively large amount of representativeness, it is essential to use only parks that will have more than 100 check-ins to make up a consumer sampling frame. With the assistance of Python, the data were extracted (version 2.7.12). Prohibitions, such as invalid records and fraudulent users, were examined for data.
The geographical locations of data are only accessible in Shanghai.
During the study time in each green park, the lowest amount of check-ins will be 100.
The user ID, time, gender, day, month, year, and time for each record should be given geolocation (latitude and longitude).
Domestic parks separated into many spatial places are collected in a solitary geolocation.
Figure 2 indicates the parameters used to collect the tests.

Process flow of data preparation.
Park type classification
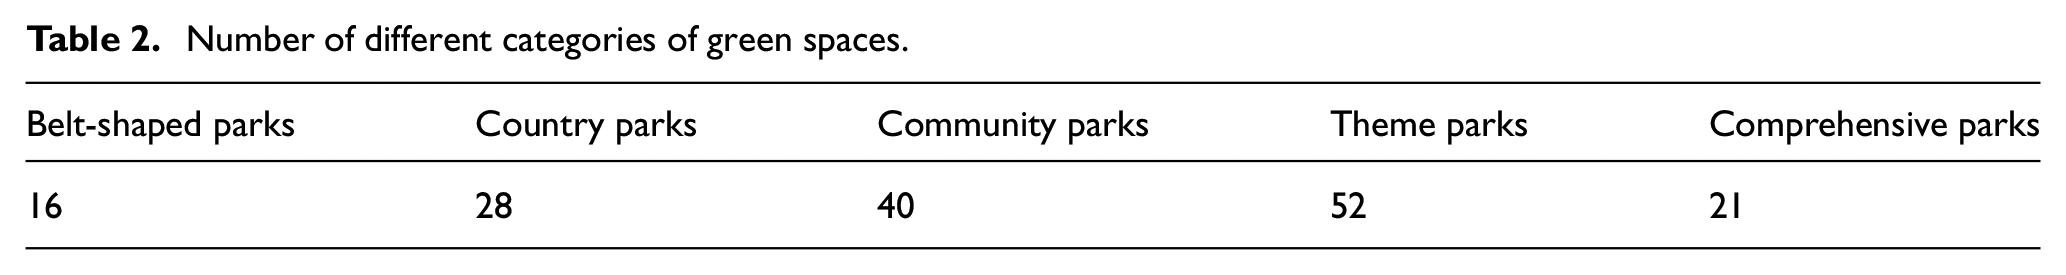
The research topics called urban green spaces and rural parks were listed before the study was performed. China’s “Norm for Urban Green Space” 33 states urban green zones as green areas with some amenities accessible for public usage; their use is mainly for outdoor pursuits, development of the environment, calamity prevention, and calamity removal. The five core types of urban green parks are: comprehensive parks, community parks, theme parks (e.g. zoos, children’s parks, historical gardens, botanical gardens, and famous scenic parks), belt-shaped parks, and roadside green spaces. Comprehensive parks are broad in size and ideal for leisure sports with rich entertainment facilities. Few physical exercises are mainly carried out by community parks as residential facilities. Theme parks require unique events and services that are theme-based. In addition to urban highways, city walls, and waterfronts, belt-shaped parks are often narrowly dispersed. The green areas on the side of the road are small and are mostly used as whistles. The impact of green roadside on the density of visitor space is minimal, this is why this type of urban green space was omitted from our analyses. The second urban green area category covered by the study was country parks. Country Parks are designed to protect the biodiversity and climatic conditions in many other urban areas of China. The country parks of Shanghai are an exception, as other green areas play a better role. For example, they have a broad variety of recreational opportunities, and thus have a close association with the compactness of the spatial spread of the visitor. For these five categories of urban green areas, our study objects were chosen: community parks, comprehensive parks, theme parks, belt-shaped and country parks. Table 2 shows the number of parks in our study area.
Number of different categories of green spaces.
Methodology
Social media data analytics
In this review of 15 districts of Shanghai in China, we looked at the Weibo geolocation dataset (July 2016 to June 2017). Figure 3 illustrates the compliance test framework including LBSN data analysis methodology; pre-processing and purification; spatial, temporal LBSN data analyses and statistical evaluation providing details on the value of LBSN data.

Methodology.
Temporal analysis
Time timelines for check-in can be separated into multiple temporal groups to measure variations in customer sentiment. The monthly gender check-in distribution provides a general trend to indicate the percentage of check-ins who visit green parks quite frequently. In addition to exploring and analyzing hierarchical databases and data cubes, Tableau 2019.2 was used for temporal techniques.
Statistical analysis
The data were statistically examined using the Statistics Package for Social Sciences (SPSS v25). SPSS is an extensively used structure for sociology statistical analysis. This software platform is used in various studies by corporations, health scientists, sample firms, national education professionals, advertisement companies, data mining corporations, and many others. It includes a number of features such as ad hoc review, indication of hypotheses, generalization of documents, and data analysis. An easy design to expand informative analysis capability with modular add-ons is assisted by SPSS Statistics. Table 3 demonstrates the correspondence of the reason used in this research and demonstrates that the factor is substantial.
Significance of correlation.

Correlation is significant at the 0.01 level (two-tailed).
Table 4 presents the descriptive data for associated variables and shows that our findings are opposed. It describes about standard deviation and mean regards to months, week days, gender, hours, date, and year.
Descriptive statistics for correlated variables.

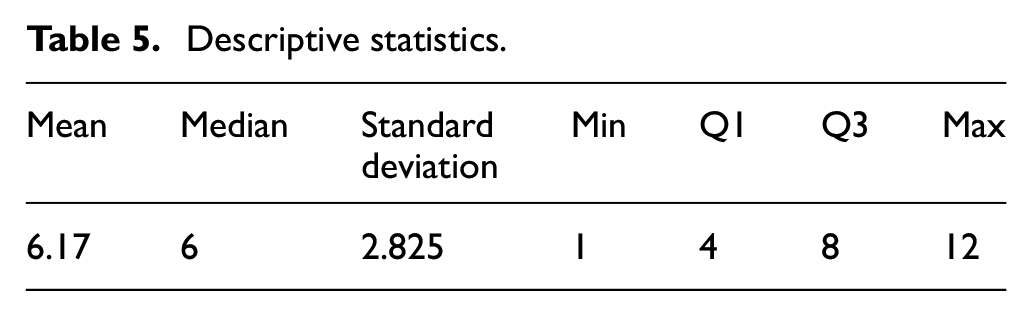
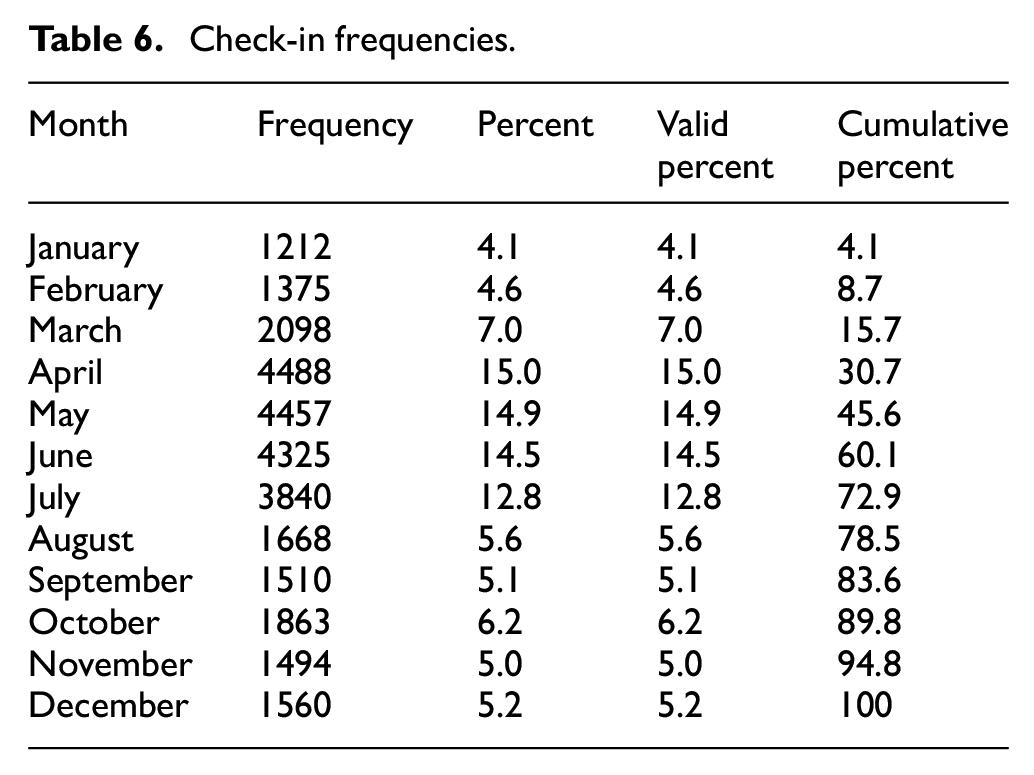
The explanatory figures are shown in Table 5 and display no insignificance. The information is usually dispersed, nearly the ordinary; and Table 6 presents the year-round check-in rates.
Descriptive statistics.
Check-in frequencies.
Spatial analysis
The author used KDE to create a good external concentration in the geographical zone for fill-in hot area. For the detailed inspection of randomized sample, 42 the KDE is a non-parametric method. KDE loans each piece of data to slight density peaks and combines all those minor smashes to create a signal intensity estimation for spatial circulation;43–45 the KDE approach has been commonly used. KDE explains the spatial density circulation incorporated into the remote degeneration effect and project hotspots by changing scattering data mad about a reliable density surface. To examine several features of public networking (but not limited to LBSN), KDE is an evolving spatial temporal approach recently being used46,47 for inspect-in behavior, 48 such as digital user behavior and moving patterns, 42 town boundary descriptions,44,45 and point of interest suggestions. It is also analyzing the dissemination of population targets so that researchers can assess where the destinations are closely clustered and far more distributed. In the geographical area of spatial points, it is eventually attempting to evaluate a fine surface density. 41
KDE is really an effective measurement of the visitor density spatial structure in a research region. KDE is a mathematical method for assessing a smooth and continuous circulation of a finite number of points detected. The data gained into account in our investigation are in geo-tagged check-ins. Let “E” be the historical check-in data set, that is, E = {e1., en} where e i = < x, y > is a geolocation check-in from 1 < I < n of person I and t, where “E” is the dataset used. A smooth curve that is a region of the unit will be generated with the sum of the kernel functions. This outcomes in the following method of a KDE bivariate

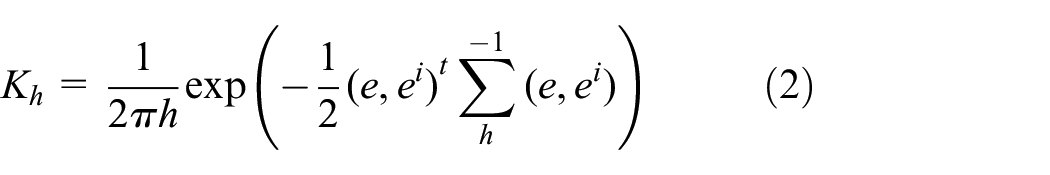
where “e” states to the check-in position in dataset “E” together with bandwidth “h”; “h” is supposed to be reliant on the predictable density “fKD,” making a flat density surface around “E” at the data point “e.”
ArcGIS 10.0 is being used. ArcGIS 10.0 (Environmental Systems Research Institute, Inc., Redlands, CA, USA) developed the WGS-1984 map of the 2016 Geodetic Coordinate System for Shanghai. The Map for 2016 was made. The main transportation lines (line layer) and the organizational factors (polygon layer, along with district layers) and the existing metro lines and access points (point layer) also were hierarchical description included in the base map.
Results
Shanghai City has a population of 22,125,000 and is one of the fastest-progressing cities on earth in a 4015 km2 surface. The total amount of green areas within the town of Shanghai is 366, 36 allowing the public of Shanghai to have an excellent exposure toward healthy practices. A total of 157 green parks have been chosen, following analyses of the data acquired from Weibo. Figure 4 exhibits the distribution in this review of multiple green park forms. Several colors show many varieties of park.

Green parks locations.
With KDE, we utilize a geo-area-based check-in dataset for spatial investigation that estimates spatial flexibly of checks and envisions this dataset in Bend GIS. Red concealed territories reflect higher densities of people, bigger joint effort, and a more significant level of web-based media use, as can be found in Figure 5. It’s not generally bizarre that the city zone contains huge business groups and a sole control thickness over the range of study in Shanghai.
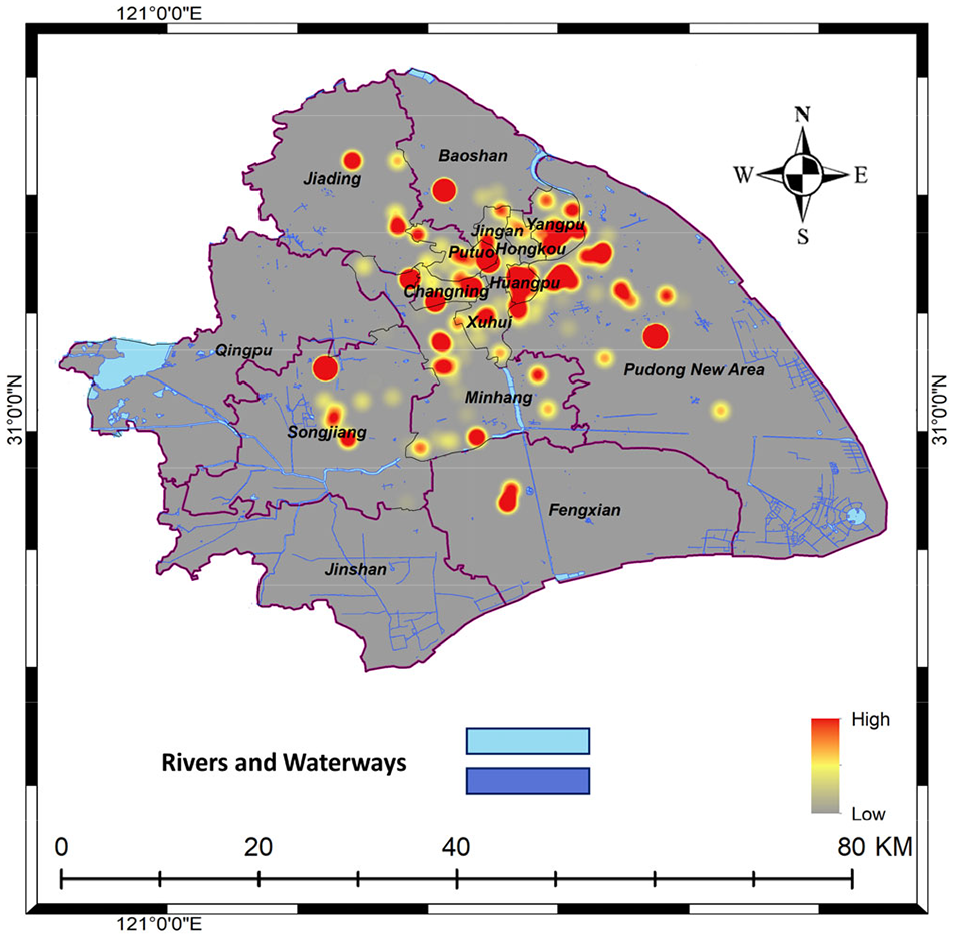
Check-in distribution.
Figure 6 outlines the principal registration density of the apparent multitude of different classifications of parks ordered into five kinds. Our outcomes show that the most registration was in theme parks and in community parks, so this gathering is considerably thicker. The reason behind this is the quantity of theme parks is more than approach and they are easily accessible and can be found close to the local locations.

Density of different parks categories.
Figure 7 illustrates the comparison between the check-in distribution on weekdays and weekends across users in 15 districts of Shanghai, where 5:2 is the ratio between weekdays and weekends. It is noteworthy to emphasize that the figure represents the check-in dispersion as high, even though the ratio for weekends is less.

Check-in distribution for weekends and weekdays.
Weekly patterns are very typical, with check-in numbers almost equal to Saturday and Sunday per week. Figure 8 illustrates the weekly variation in all green park categories and shows whether or not it should be any category, checks have been noted for most weekend check-ins.

Density in categories of green parks.
Figure 9 illustrates the main visiting patterns of the park during the study period. The assurance of a person’s very own ecological reaction and its effect on an individual’s contribution in outer exercises can be dependent upon numerous factors. Check-in appears to be much higher throughout the months of April, May, and June that point out the seasonal deviation data, which illustrate that in spring and summer there is a huge percentage of check-ins.
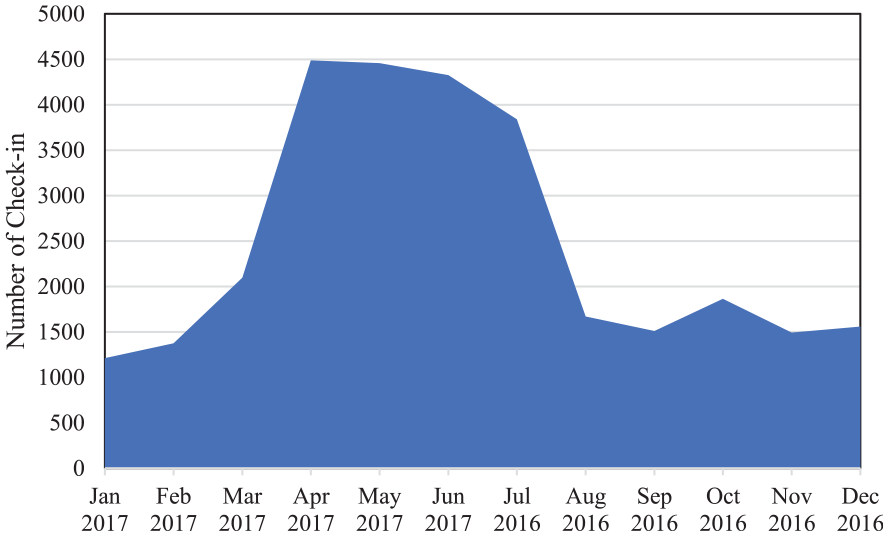
Variation in the number of park visitors with respect to month.
In Figure 10, the most influential categories in our field of study based on the number of check-ins are illustrated. In the center of the city, a greater part of citizens visits these parks and shares their experiences through Weibo. According to the figures, mostly participants choose to visit theme parks and community parks, so the number of visitors is 38.23% and 24.74%, which made them a popular group.

Famous categories according to number of check-ins.
We have researched all the five categories of green spaces in shanghai metropolitan city and Table 7 reveals all the check-ins frequency among the days and monthly basis.
Category/gender.

Discussion
Some of Shanghai’s green parks are packed with tourists but others are rarely explored. This study sought to determine the changes in the conduct of visitors to the park. In Shanghai’s green parks, we observed the space–time method of check-ins dispersion. We have carried out a detailed empirical assessment of inspection attitude utilization of fashion charts and density maps from LBSN facts. The spatiotemporal developments of check-ins have been concentrated from numerous perspectives, remembering for the day of the week. All through the day, the number of tourists in green parks was limited. In the heart of the city from a spatial viewpoint, the degree of spatial mass of urban green parks has been higher as it is also the center for other actions.50
This research is based on the use of geotagged social media check-in data, which work as a proxy to govern the sum of green park visits in Shanghai. This approach saves us from time-consuming and labor-intensive assessments and it can carry admirable space coverage. Finally, this method has its own limitations. We had no straight disclosure to inveterate visitor rates, so we could not decide whether there was a visible relation among check-in data and reported visits to the planning and assessment of urban areas. The relation among the frequency of check-in and visitation of Weibo will differ in green parks. One most important concern is that, in a gap with traditional census data, the social media data habitually do not directly hold demographic data such as race and marital status. However, these variables can be deleted indirectly. 14
KDE is a role that brings about activities by distances and demands two factors. The first of these is the transfer speed, and the second is the separation power. Transmission capacity choice impacts results. The subsequent boundary is the weighting highlight K, ordinarily a typical component. The bandwidth of the kernel is a free parameter, which shows a clear impact on the calculation. The density will be normal density with variance 1 and mean 0. In limit h→0 (no smoothing), where the calculation is a combination of n delta functions based on the data co-ordinates analyzed, there is an exceptional context. In our best evidence presented, this research may be the first study to consider the different types of green parks in Shanghai by using KDE-based Weibo information and statistical evaluates, which can provide very cherished green spaces for authorities.
Conclusion and future work
Green urban parks are areas for people to engage in safe outdoor sports. Studies on the affiliation among green parks and their usage are very critical for the renewal of human fitness. One year of city park visits to Shanghai by the use of Weibo data by regular users provide spatial and temporal patterns for healthcare. Our study signposted that the quantity of visitors in theme parks and community parks is greater compared to their check-in percentage, which could be due to the greater number of such parks and that people use green spaces to visit habitually on weekends. There have been key enhancements based on months in the user’s processes, and patterns show that April, May, and June are the most frequent months with regard to check-in. More amenities will fascinate more sightseers, such as transport and the park area, meanwhile this study indicates that visitors to parks in the city center are more as compared to other regions. These outcomes can be supportive in community design for green zones by taking into account the requirements of visitors.
Furthermore, this research can be done using the methodology and outcomes of this study, including possible directions for future appraisals of the outlines of leisure visits to urban green parks by the use of geotagged photographic data to define approaches of attractive activities.
Footnotes
Handling Editor: Lyudmila Mihaylova
Declaration of conflicting interests
The author(s) declared no potential conflicts of interest with respect to the research, authorship, and/or publication of this article.
Funding
The author(s) disclosed receipt of the following financial support for the research, authorship, and/or publication of this article: This work was supported by The Anhui Natural Science Foundation (No: 1908085MF178), Anhui Excellent Young Talents Support Program Project (No: gxyqZD2019069) and Anhui Quality Engineering Projects (2019kfkc131).