
Abstract
“Social sensors” refer to those who provide opinions through electronic communication channels such as social networks. There are two major issues in current models of sentiment analysis in social sensor networks. First, most existing models only analyzed the sentiment within the text but did not analyze the users, which led to the experimental results difficult to explain. Second, few studies extract the specific opinions of users. Only analyzing the emotional tendencies or aspect-level emotions of social users brings difficulties to the analysis of the opinion evolution in public emergencies. To resolve these issues, we propose an explainable sentiment prediction model based on the portraits of users sharing representative opinions in social sensors. Our model extracts the specific opinions of the user groups on the topics and fully considers the impacts of their diverse features on sentiment analysis. We conduct experiments on 51,853 tweets about the “COVID-19” collected from 1 May 2020 to 9 July 2020. We build users’ portraits from three aspects: attribute features, interest features, and emotional features. Six machine learning algorithms are used to predict emotional tendency based on users’ portraits. We analyze the influence of users’ features on the sentiment. The prediction accuracy of our model is 64.88%.
Introduction
With the rapid development of the Internet, popular social media platforms like Weibo, Twitter, Facebook have emerged. Social media users express their opinions, discuss and share information with others. In the era of information explosion, the dissemination of information and the interaction of opinions are unprecedentedly fast, and the expression of online public opinion is increasingly diverse. “Social sensors” refer to those who provide opinions and ideas through electronic communication channels such as the social networks. As a “sensor network,” social networks have been becoming critical in managing social emergencies. In general, the public will pay wide attention due to the rapid spread of public emergencies. If the relevant management departments cannot promptly respond and predict the development trends, it will expand the impacts of public losses to a certain extent and cause immeasurable damage and threats. Extracting representative and high-quality opinions and discovering valuable information behind the messy data with data analysis on social networks is imperative for sentiment analysis in emergency events. In addition, it is of great significance for maintaining social stability and creating a harmonious society.
Sentiment analysis technology has been widely applied in many different fields such as e-commerce, education, health, and entertainment. For example, in the field of merchandise retail, through sentiment analysis on a large number of users’ comments, it is possible to quantify the degree of praise or criticism about the products and its competitors by users. In financial transactions, sentiment analysis can be used to analyze traders’ attitude toward stocks and other financial derivatives. It can provide the auxiliary basis for market transactions. However, sentiment analysis on the social networks still faces many challenges. For instance, widely adopted short sentences and abbreviations in tweets, and informal language expression increase the difficulty of sentiment analysis. Many users use sarcasm or vague expression in their tweets, which can cause complexity when trying to identify positive or negative emotions. Besides, analyzing the sentiments within the text alone instead of considering users’ various features leads to the poor performance of models and difficulty in explaining the experimental results.
With Twitter users as social sensors and Twitter as a social sensor network, we research the “COVID-19,” a public emergency that attracts international attention. In this work, we propose an explainable sentiment prediction model based on the portraits of users sharing representative opinions in social sensors. In the public opinion analysis, we need to know the motivations of users’ emotional tendencies while understanding users’ sentiments. Existing sentiment analysis research only focuses on the accuracy of the models, but cannot explain which factors affect the sentiment of social users. Compared with existing models, our model not only analyzes users’ sentiments by training neural networks, but also predicts emotional tendencies based on users’ portraits. We conduct the correlation analysis between features and sentiment to find the motivation of users’ emotional tendencies, and explain the differences in features between user groups with different emotions. Besides, existing studies lack real public emergencies to verify the models. Our model explains the experimental results based on the actual situation of the “COVID-19” incident, such as why social users who pay more attention to people’s livelihood and politics are more likely to hold negative emotion. Therefore, our sentiment analysis model is interpretable. We make the following contributions:
We conduct sentiment analysis from the perspective of text and users’ portraits. First, we determine the labels of training data by multiperson voting and train the LSTM neural network to analyze the users’ emotional features from the text. Second, we extract attribute features and interest features of users sharing representative opinions and build their portraits. Six classification algorithms, namely, k-Nearest Neighbors (KNN), Naive Bayes, Logistic Regression, Random Forest, Support Vector Machine (SVM), and Gradient Boosting Decision Tree (GBDT), are used to predict sentiment from users’ portraits. Finally, the users’ features that have an impact on sentiment are explained through feature correlation analysis.
From the perspective of topics, our model maps group opinions to social users and further analyzes users’ emotions on the basis of opinion mining. The model analyzes the users’ stances in public emergencies from two levels of opinion contents and emotional orientation. The model uses text clustering and abstract generation algorithms to extract representative opinions on the same topics. We select users who share representative opinions among all users for sentiment analysis.
Our model is verified on a real “COVID-19” dataset. We collect 51,853 tweets related to the “COVID-19” on Twitter from 1 May 2020 to 9 July 2020 and store them in the MongoDB database. By extracting specific opinions and establishing users’ portraits, our model effectively predicts users’ sentiments. We explain the results according to the actual “COVID-19” situation through the experimental results based on feature correlation analysis.
The rest of this article is organized as follows. We introduce the related work of machine learning, opinion mining, sentiment analysis, public opinion prediction, and user portraits in the second section. The sentiment prediction model based on the portraits of users sharing representative opinions is introduced in the third section. We present and analyze the experimental results in the fourth section. We conclude this article in the final section 5.
Related work
In recent years, machine learning algorithms have been widely applied in Cyber Physical System (CPS) and in Cyber Physical Social Systems (CPSS). Zhang et al. 1 used several ensemble methods such as Bagging, AdaBoost, and Snapshot as base classifiers to capture the cloud’s cross-semantic and structural features and trained Convolutional Neural Networks (CNN) and Residual Neural Networks (RNN). Zhang et al. 2 proposed a convolutional neural network model named CloudNet for accurate ground-based classification of meteorological clouds. To make up for the shortcomings of traditional physical sensors, Shi et al.3–6 used social networks as social sensors to optimize the briefing content in the meteorological domain and provided online services for weather monitoring platforms. Feng et al. 7 completed map matching in the latent space based on deep learning and enhanced the matching with the knowledge of mobile patterns. Yan et al. 8 proposed an algorithm based on stretching and shrinking distance (SSDBA) for link prediction in social networks. In our previous work, we evaluated the usefulness of risky permissions for malapp detection with SVM, Decision Trees, as well as Random Forests. 9 We proposed a hybrid model based on Deep Autoencoder and Convolutional Neural Network to improve the accuracy and efficiency of Android malware detection. 10 We detected vulnerabilities in smart contracts with machine learning techniques. 11 We also employed various machine learning methods for malware detection,12–19 or for anomaly detection.20–22
There has been much research on sentiment analysis in social networks. Traditionally, it mainly focuses on the polarity classification of the sentiment expressed in the text or the multi-classification of emotions such as disgust, anger, sadness, and happiness. Most models did not consider the diverse features of users. For example, Abbas et al. 23 used four classifiers of Naive Bayes, Decision Tree, Multi-Layer Perception and Logistic Regression to integrate a majority voting classifier to identify the negative or positive sentiment of tweets. Vashishtha and Susan 24 used one new unsupervised system based on nine fuzzy rules to calculate and classify the sentiment of social media posts. Considering the text’s long-term dependence, Ma et al. 25 used the Bi-directional Long Short-Term Memory (BiLSTM) network to propose a new context feature representation method, which improved the context information of the word embedding layer in the text sentiment classification. Based on the existing sentiment dictionaries, Jia and Li 26 calculated the sentiment intensities of different sentiment categories in Weibo by combining the sentiment dictionary and semantic rules to realize the sentiment classification effectively. Zhang et al. 27 proposed an emotion classification method based on SVM and latent semantic analysis. Exploring the influence of the four emotions such as happiness, hope, disgust, and anxiety on online reviews can effectively perform multi-emotion fine-grained calculations and improve the accuracy and computational efficiency of sentiment classification. Ahmad et al. 28 proposed an alternative method of deep neural networks (DNNs) by using probabilities to build weighted emotional vocabulary, then modified the vocabulary and calculated the best threshold for each category to improve the emotional classification accuracy. Ngoc et al. 29 proposed a model using the C4.5 algorithm to classify the semantic sentiment polarity of English documents according to different rules. Severyn and Moschitti 30 established a model for initializing the parameter weights of convolutional neural networks and proposed a deep learning method for sentiment analysis to predict the polarity of messages and phrases. Sun et al. 31 proposed a joint neural network model to predict the sentiment and stance of a text simultaneously.
In addition, existing opinion mining research mainly focuses on aspect-level sentiment or opinion intensity. Most models cannot extract specific opinions on the topics. Aspect-level sentiment classification aimed to predict the sentiment of text in different aspects.32,33 For example, in order to capture more accurate semantics and emotions, Fu et al. 34 proposed a word embedding learning method based on the topic word embedding model to express a word and appended the corresponding emotion vector to the word input vector. Wang et al. 35 proposed an aspect-level sentiment capsules model (AS-Capsules) that can simultaneously perform aspect detection and emotion classification in a joint manner. The model can consider the aspect-related words and emotional words corresponding to different aspects. To overcome the problem of similar expressions between opposite emotion vectors, the word embedding was improved by providing different vector expressions for different emotions. Rida-E-Fatima et al. 36 proposed a multi-layer dual attention model based on deep learning to mine the indirect relationship between opinion words. Köper et al. 37 extended lexicons of affective norms to predict opinion intensity in tweets. Goel et al. 38 predicted the intensity of the four emotions in the tweets, including anger, fear, joy, and sadness. Wang et al. 39 proposed an improved LSTM model to predict opinion intensity for text. Based on the sentiment dictionary, Gupta and Yang 40 developed a system to understand and predict the emotion intensity of tweets. Ibeke et al. 41 proposed a novel unified latent variable model (contraLDA) to extract sentences expressing comparative opinions and compare opinions’ intensity.
The sentiment analysis of public opinion is very similar to the traditional text sentiment classification, but merely using the text’s sentiment information cannot effectively mine the sentiment of social network users for a specific public emergency event. In the opinion analysis of public emergencies or significant events, it is indispensable to understand social network users’ attitude. Most existing work pays attention to the sentiment prediction of user groups and the sentiment trend analysis of the public. However, most of the current public opinion prediction targets are the average sentiment of the user groups, which cannot reflect the specific distributions of emotional tendencies, nor can it effectively predict the sentiment of individuals in the user groups. Therefore, it is hard to predict the sentiment tendency of each user in a targeted manner.
For instance, taking into account the relevant features of different users’ identities and time series, Li et al. 42 proposed a sufficient time and user dual attention mechanism model to analyze and predict public opinion information and effectively realized multi-document sentiment prediction. Yin et al. 43 established a M-SDI model based on the amount of public discussion, then used the real data of “COVID-19” public opinion obtained from China’s Weibo to perform data fitting to predict the trend of public opinion. Samuel et al. 44 used R statistical software and its sentiment analysis package to identify the public sentiment related to the “COVID-19” tweets to analyze people’s opinions on the event. Wu et al. 45 proposed a Chinese Weibo opinion summary method based on the Ortony-Clore-Collins (OCC) emotion model. The method provided a rule-based emotion output mechanism. Xu et al. 46 used a neural network model to integrate topic semantic information into the text representation and proposed a big data sentiment analysis method based on sensitive information topics. The sentiment analysis system established by Wang et al. 47 can instantly and continuously analyze the sentiment of the Twitter users about elections. Chen et al. 48 proposed a user-based collaborative filtering algorithm to analyze the principle of public opinion trend prediction based on collaborative filtering. They designed a framework structure for trend prediction of network public opinion.
Besides, users’ emotional tendencies are regularly affected by individual attributes such as social activity, and their interests. Users’ portraits are virtual representations built with real user information extracted from massive data based on users’ attributes and behaviors.49,50 Users’ portraits are widely used in intelligent recommendation, precision marketing, competitive product analysis, and risk control. In general, users’ portraits consist of dynamic data and static data. The so-called static data includes user information such as gender and age, which cannot be changed quickly. On the contrary, dynamic data related to the user’s short-term behaviors are more variable, such as purchasing power or activity status. Few existing studies consider users’ various features for public opinion prediction and sentiment analysis. Wang et al. 51 analyzed users’ age, gender, education, salary, and other attributes based on self-introduction, and automatically generated users’ portraits. Li 52 used text mining, Social Network Analysis (SNA), and clustering techniques to portray users in the knowledge innovation communities. Yao et al. 53 recommended movies to users based on their interest tags and browsing behavior. Yarushkina et al. 54 constructed users’ portraits for social network users by collecting tweets and analyzing the topics. In our previous work, we proposed emotional intelligence prediction models based on Weibo to analyze the users. 55 Nurgaliev et al. 56 proposed an algorithm to reveal user identities as a set of linked accounts from different social networks, using limited user profile data to match user identities. Most research related to user portraits only analyzes a few features of users. The comprehensiveness and accuracy of the user portraits is lacking.
Although there exists research related to sentiment analysis, the current research still has some problems. Existing opinion mining models cannot extract specific opinions. Sentiment analysis research rarely considers the diversified features of users. Public opinion prediction models analyze the sentiment of the public instead of individual users. We collect a large number of tweets about the “COVID-19,” dig out specific opinions on the “COVID-19” topics, and analyze the emotional tendencies of users sharing representative opinions based on users’ portraits.
An explainable sentiment prediction model based on the portraits of users sharing representative opinions
Our proposed explainable sentiment prediction model performs text clustering and abstract generation on tweets related to “COVID-19” on Twitter. According to the results, specific opinions of the user groups are obtained. We not only build portraits of users sharing representative opinions from three aspects—attribute features, interest features, and emotional features—but also use GBDT and other machine learning algorithms to predict users’ sentiments. Eventually, based on the methods mentioned above, the features that affect sentiment are obtained by performing the feature correlation analysis. Figure 1 shows the construction process of the explainable sentiment prediction model based on users’ portraits. The process includes five stages: acquiring and preprocessing Twitter data, extracting representative opinions, building users’ portraits, sentiment prediction based on users’ portraits, and feature correlation analysis. The specific research methods involved are as follows.

Model process diagram.
Extracting representative opinions
At present, most of research on opinions extraction is about comments on product-based aspects, such as hotel reviews on location, environment, price, service. Research on opinion extraction in social networks is mostly about aspect-level sentiment or opinion intensity. We use text clustering and abstract generation algorithms to extract representative opinions on the topics. First, we preprocess the tweets in the topics, such as case conversion, deleting stop words and special symbols. We then input the preprocessed tweets into the Affinity Propagation (AP) clustering algorithm.57–59 At the initial moment of clustering, each tweet can be regarded as an opinion, in which the responsibility and the availability between nodes are transferred. The responsibility
Step 1. At the beginning of the algorithm, initialize the responsibility matrix
Step 2. Update the responsibility matrix

Step 3. Update the availability matrix

Step 4. Attenuate the responsibility and the availability according to the attenuation coefficient


Repeat steps 2 to 4 until the matrix is stable or reaches the maximum number of iterations. Then the algorithm ends.
After sorting the clustering results according to the class sizes, the classes with users more than a certain number are selected. Multiple representative opinions on the topics can be obtained by using the TextRank algorithm to generate text summaries for the selected classes, respectively. The main steps are as follows.
Step 1. Construct a graph
Step 2. Construct an edge set
Step 3. Calculate the importance score of each tweet by updating the weight iteratively.
Step 4. Sort the calculated tweet scores and extract the most important tweets as representative opinions.
Building portraits of users sharing representative opinions
Our proposed model is based on a gradual and mutual mapping among topics, opinions, and users. Users sharing representative opinions present a user group and there are certain similarities among internal members. It is more reasonable to analyze the factors influencing emotional tendency of a specific user group instead of all users. Therefore, we selectively analyze users sharing representative opinions to make the feature correlation analysis experiments more credible. We build users’ portraits for those who share representative opinions on the topics. Users’ features mainly include the users’ attribute features, interest features, and emotional features. There are 24 dimensions of attribute features, some of which can be obtained from the tweets’ information, such as “Verified,”“Followers_count,”“Friends_count,” and “Location.” In addition, there are other features that need to be statistically sorted, such as “Activity,”“Max_length,” and “Zero_favorite.” The attribute features of users are shown in Table 1.
Users’ attribute features.
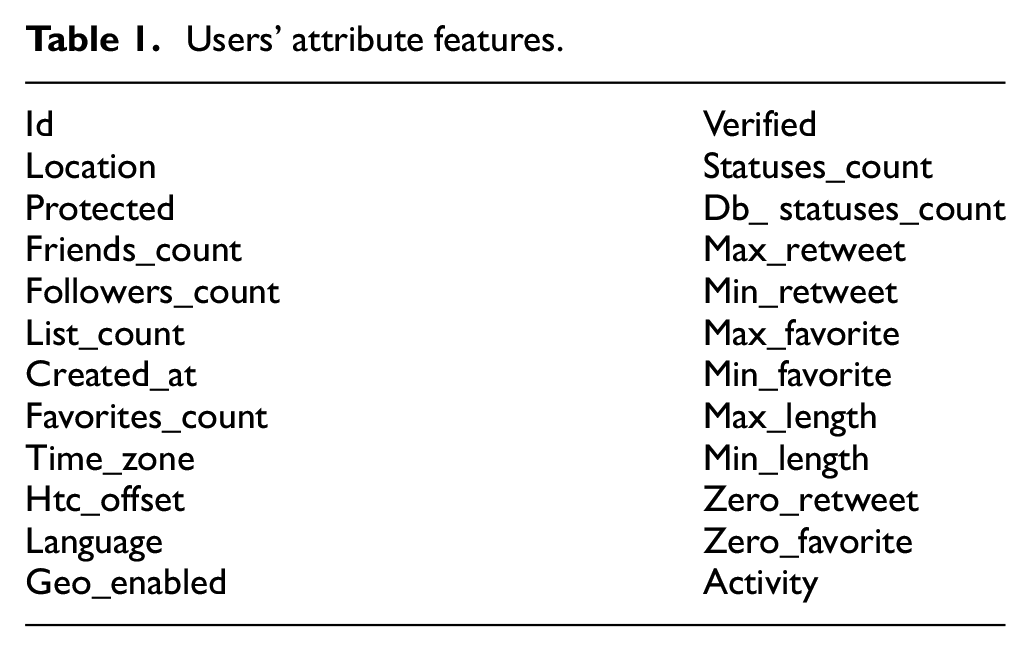
The meanings of attribute features in Table 1 are as follows. “Id” represents the user’s id number, which is used to identify the user uniquely. “Location” represents the geographic location of the user. “Protected” indicates whether the user’s account is protected. “Friends_count” represents the number of the user’s friends. “Followers_count” represents the number of the user’s fans. “List_count” indicates the number of public groups that the user belongs. “Created_at” represents the creation time of the user’s account. “Favorites_count” represents the number of the user’s likes. “Time_zone” represents the time zone of the user’s area. “Htc_offset” represents the time difference between the user’s time zone and UTC. “Language” represents the language used by the user. “Geo_enabled” indicates whether the user allows the Twitter platform to obtain geographic location. “Verified” indicates whether the user has completed the authentication. “Statues_count” represents the number of tweets posted by the user. “Db_statues_count” indicates the number of the user’ tweets stored in the database. “Max_retweet” indicates the maximum number of times that the user’s tweets are retweeted. “Min_retweet” indicates the minimum number of times that the user’s tweets are retweeted. “Max_favorite” represents the maximum number of likes that the user’s tweets have received. “Min_favorite” represents the minimum number of likes that the user’s tweets have received. “Max_length” indicates the maximum length of the user’s tweets. “Min_length” indicates the minimum length of the user’s tweets. “Zero_retweet” represents the proportion of zero-retweet tweets in the user’s tweets. “Zero_favorite” indicates the percentage of tweets that have received zero like among users’ tweets. “Activity” indicates the user’s activity, which is generally expressed by the number of times that the user participates in the discussion of topics.
Interest features are obtained based on keyword mining in users’ historical tweets, which effectively reflect the users’ interests. Before using the LDA model to extract interest features, we preprocess the tweets with regular expressions such as removing stop words, web page addresses, special symbols, and other meaningless words. Then the data are converted to the required format to build a corpus. The bag of words model is used to represent each word with a word vector. Finally, we input the data into the LDA model for training. It is convenient to get the topic distributions of each document and the word distributions of each topic. On the “COVID-19” dataset, the interest features are divided into eight aspects: people’s livelihood, economy, news, election, China, United States, entertainment, and politics. The keywords involved in different topics are different. The interest features of each user in the user groups can be obtained by analyzing the users’ tweets based on the LDA model. The top 10 keywords in the eight topics are shown in Table 2. Users’ interest features are diverse because they may be concerned about one or more of the above aspects.
Top 10 keywords in different topics.

To understand the attitude of social network users to public emergencies, we train the LSTM neural network to predict the sentiment of users sharing representative opinions. First, several tweets are randomly selected from the topics, split into a training dataset and a test dataset according to four to one. We manually label the tweets in the training dataset with a value interval of [−1,0,1], indicating negative, neutral, and positive. Since the labels’ accuracy will directly affect the quality of the model, we let multiple people label the data simultaneously and decide the final label of each tweet by voting. Second, the processed data are input into the untrained model. After the training process, we get the optimal model for sentiment prediction through multiple adjustments to the model parameters.
As a result, we have realized the building of users’ portraits by extracting multi-dimensional features in three aspects, including attribute features, interest features, and emotional features. Building users’ portraits facilitates the analysis of the correlation between users’ features and sentiments.
Sentiment prediction based on users’ portraits
To realize the explainable sentiment prediction model based on users’ portraits, we use six machine learning algorithms, including KNN, Naive Bayes, Logistic Regression, Random Forest, SVM, and GBDT, to conduct experiments separately. Taking the F1 value and accuracy as evaluation indicators, the GBDT algorithm is finally chosed by comparing the different algorithms’ performances.
The GBDT algorithm trains each classifier based on the previous classifier’s residual and each iteration generates a weak classifier. In general, weak classifiers are selected as classification and regression trees because the training process continuously improves the final classifier’s accuracy by reducing bias. Each classification and regression tree’s depth is not very deep because weak classifiers usually require simple enough, large bias, and low variance. After multiple rounds of iteration, the final total classifier is obtained by a weighted summation of the weak classifiers obtained in each training round. The steps of the GBDT algorithm are as follows.
Input:
Output: regression tree
i. Initialization
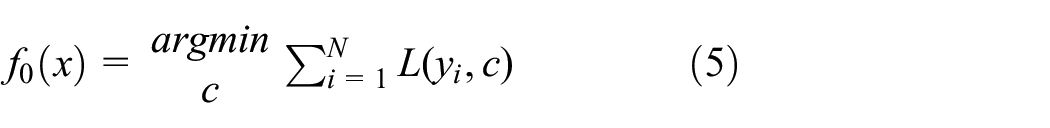
ii. Perform the following process, where
a. For the samples, calculate the negative gradient value of the loss function in the current model and use the value as an estimate of the residual. For the square loss function, the value is the residual. For the general loss function, the value is the residual approximate value (pseudo residual)

b. To get the leaf node area of the mth tree
c. Use linear search for
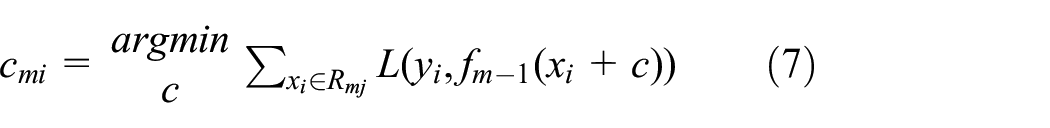
d. Update

Get the final regression tree

After preprocessing data and vectorizing words, the users’ attribute features and interest features, such as location, number of followers, activity, interests, and other information, are used as input. The emotional tendency predicted by the LSTM model is as output. The training data are input into six machine learning algorithms. Then we get the trained model after multiple parameter adjustments. The trained model can effectively predict users’ sentiments on public emergencies based on their various features of attributes and interests. Therefore, we associate users’ portraits with sentiments, which lays the foundation for analyzing the impacts of users’ features on sentiments and facilitates the mining of user groups with different emotional tendencies in public emergencies.
Feature correlation analysis
To further demonstrate the impacts of users’ features on sentiments, we implement feature correlation analysis. First of all, we perform data preprocessing to convert users’ features into vectors. For data with a fixed type such as authentication, one-hot encoding is used to convert feature data into word vectors. For data with quantitative features, the vectors are directly represented by numbers. However, if it is text data such as interest features, the data needs to be embedded first. We then use the corresponding embedding as vector representations.
Moreover, the Spearman correlation coefficient is used to present the influence of various features on emotional tendency. The Spearman correlation coefficient is positive or negative indicates that the feature is positively or negatively correlated with the sentiments. The absolute value of the Spearman correlation coefficient indicates the degree of correlation. The correlation coefficient is a random variable, usually calculated based on sample data. Whether there is such a relationship in the population, it is necessary to perform a statistical test on the correlation coefficient before the conclusion can be drawn. Consequently, we use a significance test to judge whether there is a correlation between two variables. If it exists, the closer the correlation coefficient’s absolute value is to 1, the stronger the correlation between the two variables. On the contrary, the closer the correlation is to 0, the weaker the correlation between them.
Experiments
Data and data preprocessing
We use Twitter as the research data source and select the “COVID-19” that the public and the society are more concerned about as the research event. We get 51,853 tweets on Twitter from 1 May 2020 to 9 July 2020. Figure 2 visually shows the number of tweets and users on the topic each week. We separately collect 1000 historical tweets of each user to extract interest features for those who share the representative opinions. We clean the tweets using regular expressions such as removing stop words, special symbols, and emoticons. We extract the comments, vectorize the cleaned data and use the TF-IDF algorithm for features processing.

Number of tweets and users.
Experiments and results
Our proposed model is aimed to analyze the sentiment of users sharing representative opinions on the same topics. We use text clustering and abstract generation algorithms to extract specific opinions on the topics. Since the opinions on the topics will change over time, we separately extract opinions on weekly tweets related to the topics. We count the number of group opinions with more than 50 supporters, and the results are shown in Figure 3. It can be clearly seen that the number of opinions meeting the conditions is the least in the fifth week, with only five opinions exceeding 50 supporters. Therefore, we use five as the threshold and select the top five opinions with the largest number of supporters as representative opinions every week. The opinions held by the supporters are similar to the representative opinions. Taking the experimental results of the week from 1 May 2020 to 7 May 2020 as an example, the top five representative opinions and the corresponding number of supporters are shown in Table 3.

Number of eligible opinions.
Extraction of representative opinions.

In addition, we establish portraits for those who share representative opinions through extracting features. We extracted features of 4891 users in the “COVID-19” topic, including attribute features, interest features, and emotional features. The 24-dimensional attribute features are shown in Table 1, extracted from the users’ field of the database or according to statistics on users’ tweets. Using the LDA topic model, the topic distributions corresponding to the documents and the keywords distributions corresponding to different topics can be obtained, which help us summarize the interest features of these users. Table 2 shows the top 10 topic words corresponding to the eight topics. We analyze the topic distribution of each user and select the topic with the highest probability as the topic that each user is most interested in. It is evident that the people’s livelihood issue is the most concerned, accounting for 22%, while entertainment is the least concerned, as shown in Figure 4. This is mainly because the outbreak of the “COVID-19” event makes users more concerned about their health, family, and medical care. The “COVID-19” makes many people unemployed, who have no extra energy, to pay less attention to entertainment events such as celebrities and reality shows.
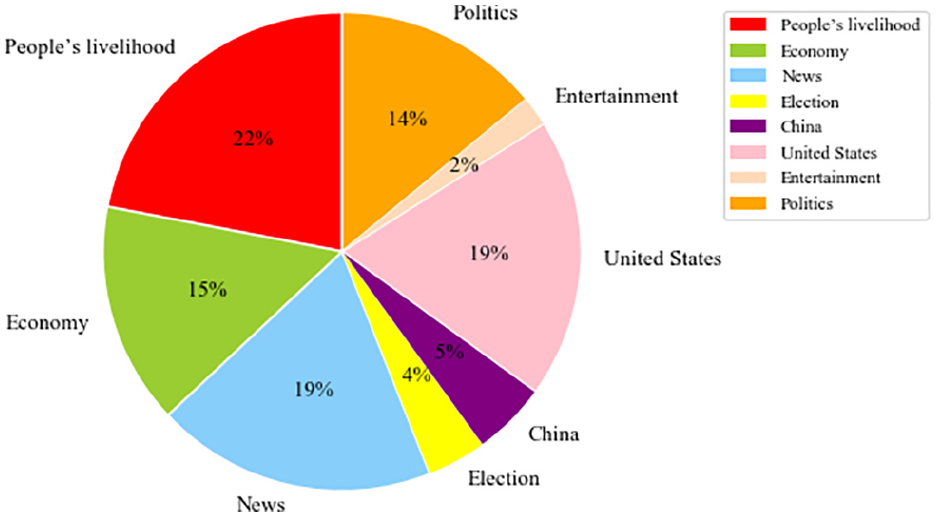
Proportion of topics most concerned by users.
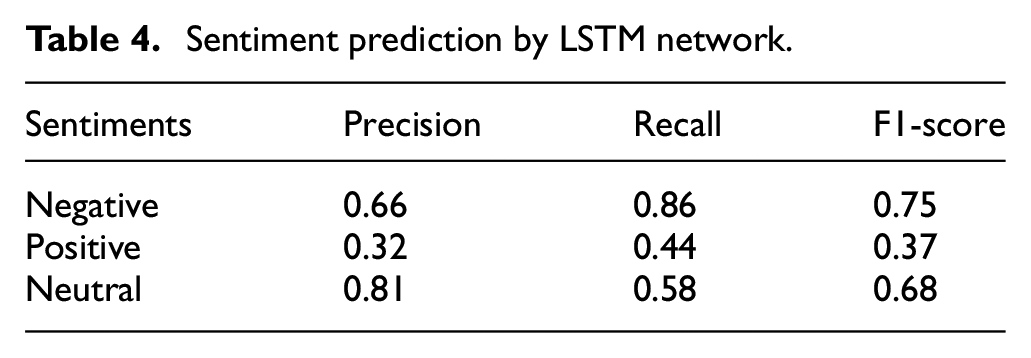
The extraction of emotional features that refer to the users’ attitude toward public emergencies is achieved by training the LSTM network. Since the quality of the labeled data will directly affect the accuracy of the model, we use a multi-person voting method to determine the final labels for the 4000 randomly selected tweets, of which 3200 tweets are used as the training set, and the remaining tweets are used as the test set. After parameter adjustments in the training process, the accuracy of the model has increased to 73.82%. Table 4 presents the results of the model’s accuracy, recall, and F1 value in sentiment classifications. The model performs best on the “negative” category and the worst on the “positive” category. The trained model is used to perform sentiment analysis on users sharing representative opinions.
Sentiment prediction by LSTM network.
We can observe the changes in the proportion of different sentiments over time, as shown in Figure 5. There are differences related to the public sentiment on the “COVID-19” event during different periods. On the whole, most users hold negative emotions, which is consistent with what we actually observe. If something worse happens, the proportion of user groups with negative emotions will increase for a period after the incident. As a result, we successfully extract the users’ emotional features, then combine the user’s features of attributes and interests to build users’ portraits. As shown in Figure 6, each user has three features: attribute features, interest features, and emotional features.
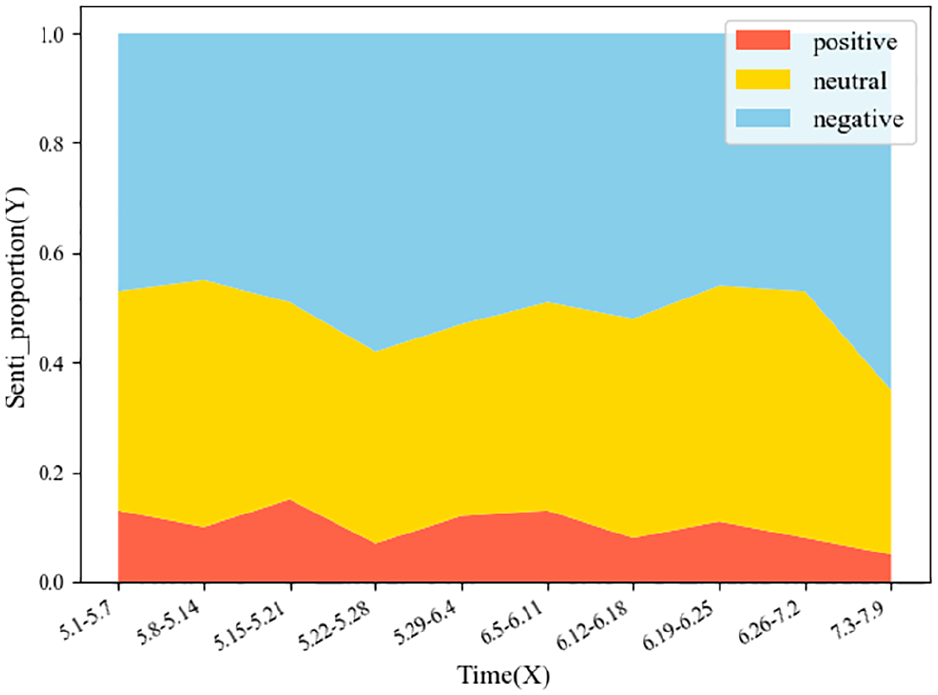
Proportion of public sentiment.

Users’ portraits.
Furthermore, machine learning algorithms are used to predict emotional tendencies based on users’ portraits to associate users’ features with sentiments. The neural networks can design the corresponding network structures according to the data pattern, then automatically extract high-level feature expressions effectively. The neural networks are suitable for analyzing data with obvious patterns. For example, CNN is designed for images, and RNN is designed for sequence data. In the tabular data, each feature represents an attribute, such as the extracted features of social network users. Generally, there is no obvious and common pattern between these users’ features. Compared with traditional machine learning methods, the most prominent advantage of neural networks lies in feature learning. In our model, users’ features are extracted by building users’ portraits, and a piece of vector data is used to represent the users’ features. Therefore, the neural network learning algorithms are not applicable to our data. We conduct experiments through six classification algorithms and compare the experimental results. A total of 4891 vectorized users’ features are used to train models, where attribute features and interest features are used as input, and the sentiment is used as predictive output. Table 5 visually presents the accuracy and F1 value of each classification algorithm, among which the GBDT algorithm performs best. The GBDT algorithm uses the negative gradient of the loss function instead of the residual to fit the next decision tree for regression analysis and modeling, and then obtains the public sentiment tendency prediction model based on the decision integration of multiple regression trees. From the results of experiments, it is clear that the classification performance of the classifier in the “positive” aspect is poor. This is mainly due to the small proportion of users with positive sentiments under the influence of the “COVID-19” and insufficient labeled sample data. The accuracy of the GBDT algorithm is only 64.88%, mainly because not all users’ features are strongly correlated with sentiments. If more abundant and deeper users’ features are extracted, the accuracy of the model will be improved. We provide a research idea for the analysis of emotional motivations in public emergencies.
Comparison of sentiment prediction results.

Finally, we implement feature correlation analysis and significance testing to analyze the influence of users’ features on sentiments. Generally, the
Table 6 shows the features that have a greater impact on sentiments and their Spearman correlation coefficients with the sentiments. For example, the positive correlation between “Activity” and sentiment means that if users are more active, they are more likely to hold positive emotions on the same topics. It can be seen from Table 6 that the features including “Followers_count,”“Friends_count,”“Favorites_count,”“Max_retweet,”“People’s livelihood,” and “Politics” are negatively correlated with the sentiments. The smaller the Spearman correlation coefficient, the stronger the correlation. On the contrary, “Zero_retweet” and “Activity” are positively correlated with the sentiment. The larger the Spearman correlation coefficient, the stronger the correlation. Users who pay more attention to people’s livelihood and political topics are more likely to hold negative emotions. Due to the adverse effect of the “COVID-19” on humans and society in many aspects, users have more negative emotions, who are more concerned about people’s livelihood and new measures taken by relevant departments in response to the “COVID-19.”
Correlation between features and sentiment.

To verify the results of the feature correlation analysis, we calculate and compare the average values of features for users with different sentiments, as shown in Table 7. The average values of features such as “Followers_count” and “Friends_count” can be calculated directly based on statistics. The average values of “People’s livelihood” and “Politics” are calculated according to the priority scores of the users’ interest features. It can be seen that the experimental results in Table 7 are consistent with the results of the feature correlation analysis in Table 6.
Average of users’ features.

To sum up, we use the explainable sentiment prediction model based on the portraits of users sharing representative opinions to research the “COVID-19” events with great attention and analyze the experimental results. We use text clustering and abstract generation algorithms to extract specific opinions. We build portraits for users sharing representative opinions from three aspects: attribute features, interest features, and emotional features. Then we conduct the sentiment prediction based on users’ portraits. We creatively associate users’ features with their sentiments and analyze the motivations of sentiments. It is also beneficial to predict the trend of public emergencies by analyzing the feature differences between user groups with different sentiments through feature correlation analysis.
Conclusion
In this work, we consider the various features of users, or of social sensors, in the sentiment analysis of social networks. Using Twitter as “sensor networks,” we propose an explainable sentiment prediction model based on the portraits of users sharing representative opinions. First, we preprocess the tweets related to the topics and extract specific opinions on the same topics through text clustering and abstract generation algorithms. Second, we train the LSTM network to predict users’ sentiment tendencies as emotional features. We then build portraits for users sharing representative opinions by extracting users’ attribute features and interest features. Six machine learning algorithms are employed to predict user’s sentiments based on the features of their attributes and interests. Finally, we apply our model to the “COVID-19” data. We collect tweets on Twitter from 1 May 2020 to 9 July 2020. We analyze and predict users’ sentiment and test the model. The analysis of the results shows that users’ sentiment is affected by their features. Due to the differences in the relationship between users’ features and sentiments in different public emergencies, the experimental results of our model are closely related to the “COVID-19” events. In future work, we plan to improve the experimental results by acquiring richer users’ features. A real-time demo system based on our model is being developed for sentiment analysis of social sensors.
Footnotes
Handling Editor: Lyudmila Mihaylova
Declaration of conflicting interests
The author(s) declared no potential conflicts of interest with respect to the research, authorship, and/or publication of this article.
Funding
The author(s) disclosed receipt of the following financial support for the research, authorship, and/or publication of this article: This work was supported in part by the National Key R&D Program of China under Grant 2017YFB0802805, and in part by 2020 Industrial Internet Innovation and Development Project.