
Abstract
Aiming at the problems of complex factors affecting the rate of deception probability of networked of radar nets, the large amount of calculation by Monte Carlo simulation and the inability to quantitatively analyze the influence of various factors on the deception probability of networked, a calculation method of deception probability of networked is proposed. First, according to the homology measurement method based on the Mahalanobis distance, the probability density model of the deception probability of networked is calculated. Its probability density model obeys the non-central chi-square distribution. Then, a hypothesis test model is established to calculate the deception probability of networked mathematical expression. The simulation results show that the error between the calculation method of the deception probability of networked and the calculation result of 1000 times Monte Carlo is less than 2%. The method in this article can analyze the quantitative effect of false target position, interference distance interval, radar position, true target position, and other factors on the deception probability of networked, instead of Monte Carlo simulation, to provide a trade-off between the true target recognition rate and the deception probability of networked theoretical basis.
Keywords
Introduction
With the rapid development of modern electronic warfare, active deceptive jamming has great advantages in pertinence, cost-effectiveness, combat flexibility, and so on, so it is widely used. In particular, the emergence of Digital Radio Frequency Memory (DRFM) enables the active deceptive jamming system1,2 to quickly copy the received radar signal, generating multiple false targets distributed around the real target, consuming radar system resources, cause the radar system to be overloaded, and even make the radar misjudge the interference as the real target, 3 so the identification of deceptive false targets is of great significance.4–8
A large number of research achievements have been made in the field of anti-spoofing of range false targets. Multiple input multiple output (MIMO) radar of the Frequency Diversified Array (FDA)9,10 can resist mainlobe jamming because it provides controllable degrees of freedom in both the range and angle domains. Netted radars have the advantages of different systems and different frequency bands in clustering. Usually, the information of the network radar station will not be fully known by the enemy, so it is difficult for the forward jammer to generate active false target jamming with consistent position information and speed information for each radar node, thus forming collaborative deception. In other words, the false target has no spatial correlation, while the true target is relatively concentrated after the unified coordinates in all radar measurements, that is, it has spatial correlation. Based on the above physical phenomena, a false target elimination method based on homologous measurement and inspection fusion was proposed in the literature11–16 to reduce the probability of being spoofed by netted radar. The homology detection in the above literatures all adopts central chi-square test, which has a good detection performance in the detection of linear and non-linear signals in Gaussian white noise.17,18 Existing literatures have established mathematical models of the accuracy of true target recognition. However, the probability of netted radar being spoofed is obtained through Monte Carlo experiment statistics. Monte Carlo simulation calculation is heavy, and it is impossible to quantitatively describe the influence of different factors on the probability of netted radar being spoofed. The mathematical model of spoofing probability of netted radar is not given in the existing literature.
In response to the above problems, this paper proposes a method for calculating the probability of being deceived by a deceptive networked radar based on a non-central chi-square distribution, and establishes a probability density model for the deception probability of a non-central chi-square distribution of a networked radar, and derives the deception probability. The mathematical expression of the probability of deception. Through simulation verification, it can be concluded that the calculation method proposed in this article is consistent with the Monte Carlo simulation results and can replace Monte Carlo simulation.
The organizational structure of this article is as follows. In section “System model,” the system model of netted radar against spoofing is established. In section “Probability of being deceived by networked radar,” a method for calculating the spoofing probability of netted radar based on non-central chi-square distribution is proposed. In section “Simulation analysis,” the validity of the method is verified by numerical simulation. Finally, section “Concluding remarks” concludes this article.
System model
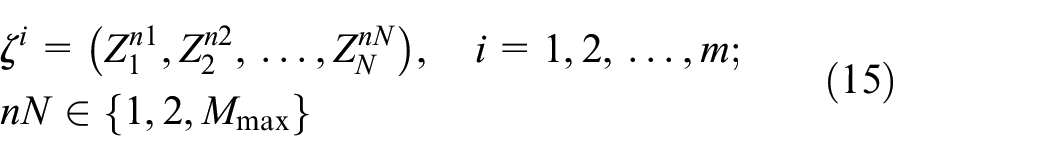
For the convenience of discussion, suppose that the networked radar is composed of two three-coordinate radars, and the geographic coordinates of the ith node radar are

Among them,
Suppose the coordinates of the target in the radar i polar coordinate system are

where
In the earth-centered, earth-fixed (ECEF) coordinate system, the coordinates of the target


The measured noise covariance under the ECEF coordinate system is

Among them


The distance multi-false target jamming is in the same straight line as the radar and the jammer, so the space position of the false target is related to the geographic coordinates of the radar station. When the radar station is different, the position of the false target is also different, and the real target and the radar station are mutual. Independent, the location of the real target has nothing to do with the geographic location of the radar station. Therefore, when processing data in the radar network information processing center, false targets can be identified based on the location of different radar stations.
After coordinate transformation and unbiased processing, target measurement in ECEF coordinate system is

Because

In formula (13),
In order to study the degree of difference in radar measurements, the easiest way is to construct the distance between the three measurements. Although Euclidean distance is useful, its obvious disadvantage is that it does not consider the covariance of the measured coordinates. For this reason, the Mahalanobis distance of the measurement point is selected as the statistic, which overcomes the adverse effect of the covariance of the measurement error on the statistic. Set statistics

This statistic obeys the chi-square distribution with 3 degrees of freedom (DOFs).
Therefore, according to the radar network data association criterion based on statistical judgment, the data association problem from different radars can be analyzed and judged with the following assumptions:
H0: if
H1: if
Among them,
Significance levels of chi-square test with different degrees of freedom.

It should be noted that the premise of the above test is that the detection probability of the two radars to the true target is 1. For the case that only one radar detects the true target, and there is no corresponding true target plot matching with it in the other radar, the true target probability will be eliminated as false target.
For the network of N radars, the measured values of N radars are correlated
in which
Probability of being deceived by networked radar
According to the previous analysis, when


Among them

Its mean value and variance are, respectively


The xyz axis of VECEF is not independent, so it is impossible to directly calculate the mean formula of each degree, according to the mean and covariance relationship formula


Then

Substituting into the covariance matrix, we get

Get

Substituting formula (24) and

where
Equation (26) is the deception probability value of node radars 1 and 2 taking one measurement value, respectively. Considering multiple real targets and multiple false targets, the comprehensive deception probability is calculated. It is assumed that there are NT true targets in the observed airspace, NT true targets and NF1 false targets in radar 1 measurement plot, and NT true targets and NF2 false targets in radar 2 measurement point trace. The (NT + NFL) and (NT + NF2) measurement pairs were formed by pairwise combination. There are NT groups for true true true measurement pairs, ntnf2 pairs for true false measurement pairs, nf1nt pairs for false true measurement pairs, and nf1nf2 pairs for false false measurement pairs. If one pair of measurement pairs is taken each time, the points in the measurement pairs passing the chi-square test will not participate in the chi-square test. The deception probability of false target comes from the probability of true false true and false false measurement pairs passing chi-square test. The total deception probability is the weighted average of the above three cases. In the case of N radar networks, the measurement values in the correlation measurement sequence are combined in pairs, and the two measurements in each combination are carried out by chi-square test, only if all combinations pass the hypothesis test, the measurement sequence is considered to be corresponding to the true target, and the associated measurement sequence that fails the hypothesis test is eliminated.
Simulation analysis
In order to verify the validity of the calculation of the false target deception probability model, the probability model simulation and 1000 Monte Carlo simulations in this article are carried out, respectively. The information of the two-node radar is shown in Table 2.
Radar parameter table of each node.

It is assumed that the number of real targets in the air is three (including one jammer), and the jammer is self-defense jamming. The remaining two true targets are around the jammer. The jammer generates 10 equally spaced distance deception false targets on its connection with node radars 1 and 2, among which five are in front of the jammer and five are behind the jammer. Let the longitude and latitude of jammer change within a certain range, with latitude coordinates from 30.6° to 31.5° and longitude coordinates from 25.8° to 27.4°. The significant level is
Figure 1 is a graph showing the variation of radar deception probability of radar 1 and radar 2 networks when the distance deception value is 300 m. It can be seen from Figure 1(a) and (b) that for targets in different regions, the calculated results in this article are close to the Monte Carlo simulation results of 1000 times, and the statistical error between the two calculated results is less than 2%, the average error is 0.00026983, and the standard deviation of error is 0.0042.

Deception probability of networked radar with distance deception interval of 300 m: (a) 1000 Monte Carlo experiments, (b) the calculation results of this article, and (c) the difference between the two calculation results.
Figure 2 is a graph showing the variation of radar deception probability of radar 1 and radar 2 networks when the distance deception value is 500 m. It can be seen from Figure 2(a) and (b) that for targets in different regions, the calculated results in this article are close to the Monte Carlo simulation results of 1000 times, and the statistical error between the two calculated results is less than 2%, with an average error of 0.00019628 and an error standard deviation of 0.0044.

Deception probability of networked radar with distance deception interval of 500 m: (a) 1000 Monte Carlo experiments, (b) the calculation results of this article, and (c) the difference between the two calculation results.
It can be seen from Figures 1 and 2 that the farther the false target is from the node radar, the greater the probability that the networked radar will be deceived. Comparing Figure 1 with Figure 2, it can be seen that the smaller the distance deception interval, that is, the denser the false targets, the greater the probability of deception of netted radar.
Figure 3(a) shows the probability density of the test statistics composed of the false targets released by the jammer in the area far from the node radar and the false targets released by radar 2. The probability density of the true target test statistic is a chi-square distribution with 3 DOFs. Figure 3(b) shows the probability density of the test statistics composed of the false targets released by the jammer in the area close to the node radar and the false targets released by radar B. The detection threshold is
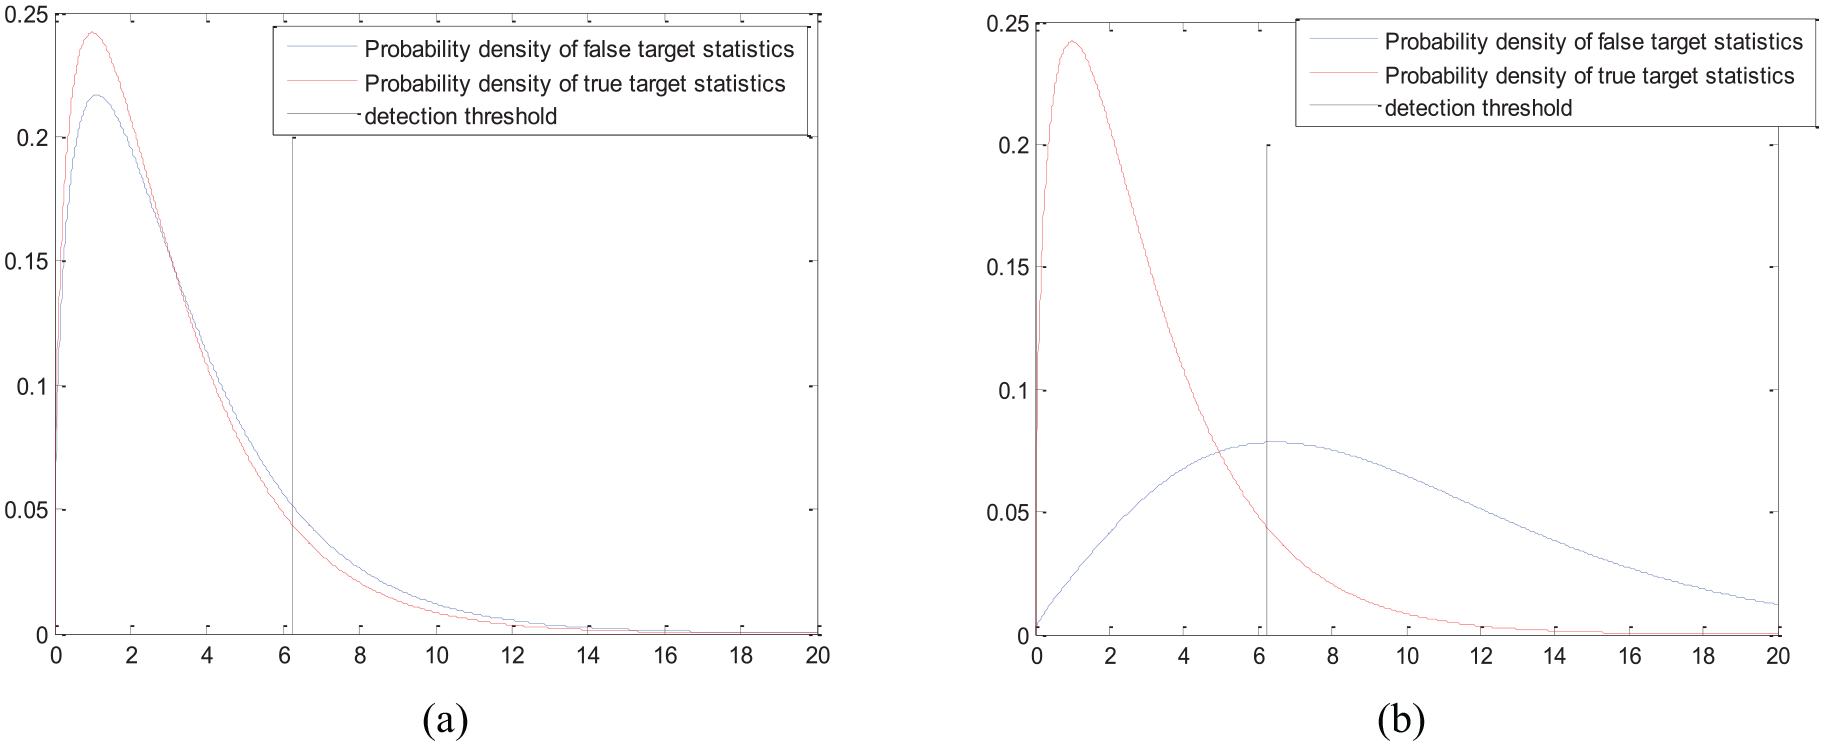
Probability density of false target and true target test statistics under different positions of the jammer: (a) far away from the nodal radar and (b) close to the node radar.
The true target recognition probability is the chi-square distribution in
The calculation method of deception probability of netted radar based on non-central chi-square distribution proposed in this article still needs some improvement. First, the calculation method in this article does not consider the detection probability of node radars, and the calculation premise is that the detection probability of each node radar to the real target is 1. Second, this article gives the probability density model of netted radar with non-central chi-square distribution. According to the probability model, the test threshold is not set adaptively to improve the overall anti-jamming performance of networked radar. The above work will be carried out in the follow-up study.
Concluding remarks
This article presents a method for calculating the probability of being deceived by a netted radar. Based on the homologous measurement method of the Mahalanobis distance, a probability density model of the probability of being deceived by the networked radar is established. Through theoretical analysis and simulation experiments, it can be seen that the mathematical model of networked radar deception probability established in this article is consistent with the 1000 Monte Carlo simulation calculation results, and the error of the two calculation results is less than 2%. It provides theoretical value for weighing the true target recognition rate and the probability of being deceived by the networked radar. How to adaptively set the test threshold according to the non-central chi-square distribution probability density model is the focus of the next research.
Footnotes
Handling Editor: Lyudmila Mihaylova
Declaration of conflicting interests
The author(s) declared no potential conflicts of interest with respect to the research, authorship, and/or publication of this article.
Funding
The author(s) received no financial support for the research, authorship, and/or publication of this article.