
Abstract
Aiming at the problems of node redundancy and network cost increase in heterogeneous wireless sensor networks, this article proposes an improved whale optimization algorithm coverage optimization method. First, establish a mathematical model that balances node utilization, coverage, and energy consumption. Second, use the sine–cosine algorithm to improve the whale optimization algorithm and change the convergence factor of the original algorithm. The linear decrease is changed to the nonlinear decrease of the cosine form, which balances the global search and local search capabilities, and adds the inertial weight of the synchronous cosine form to improve the optimization accuracy and speed up the search speed. The improved whale optimization algorithm solves the heterogeneous wireless sensor network coverage optimization model and obtains the optimal coverage scheme. Simulation experiments show that the proposed method can effectively improve the network coverage effect, as well as the utilization rate of nodes, and reduce network cost consumption.
Keywords
Introduction
Heterogeneous wireless sensor networks (HWSNs) are a network technology that integrates wireless communication, sensors, embedded computing, and distributed information processing. It is widely used due to its flexible deployment and low cost.1,2 Usually, wireless sensor networks (WSNs) are composed of a large number of tiny sensor nodes, and these nodes may have some different characteristics. Even the same kind of sensor nodes may show different characteristics due to hardware failure problems. Therefore, the object of this article is the partial coverage of heterogeneous WSNs. 3 In heterogeneous WSNs, sensor nodes have different sensing and communication ranges. The purpose of deploying HWSNs in the monitoring area is to monitor abnormal conditions in the target area, such as forest fire detection. This requires the monitoring area to be covered by nodes or to meet the coverage requirements of the monitoring area. If there is a coverage hole area or the coverage requirement cannot be met, the abnormal situation may be missed. 4 Coverage requirements refer to different application environments and different requirements for the coverage area of the monitoring area. Because some applications do not require 100% coverage (full coverage), only partial coverage is required, that is, partial coverage control has always been an important issue for HWSNs, which reflects the detection and tracking status of a wireless sensor network area. Coverage control can reasonably allocate network resources, thereby optimizing network coverage performance. 5
In a heterogeneous sensor network, a single node has simple functions and limited energy supply. It is necessary to optimize the network deployment for tasks and sensor characteristics. 6 The purpose of network coverage distribution research is how to effectively distribute sensors so that all points in the area are located within the sensing range of the sensor network. Traditional methods are still innovating, such as the energy efficiency and coordination mechanism of k-fold coverage hole detection in sensor networks, and the sleep mechanism of network nodes based on learning. 7 At the same time, emerging algorithms based on biological heuristics and evolutionary algorithms have received a lot of research, and a series of results have been achieved. Such as artificial bee colony algorithm based on the Voronoi diagram, artificial fish swarm algorithm, firefly optimization algorithm, particle swarm optimization (PSO) algorithm, genetic algorithm, and other methods of heterogeneous wireless sensor coverage deployment strategies. 8 Based on this, a coverage optimization algorithm based on an improved whale optimization algorithm (WOA) for HWSNs is proposed in this article, increases the coverage of the network, reduces the network energy consumption, and prolongs the lifetime of the network.
Related work
At present, there are many methods to solve the coverage optimization problem of HWSNs, and the more classic one is to use virtual force to optimize it. Combined with the Voronoi diagram model, research and propose a new algorithm that can be applied to the optimization of sensor network coverage. This article first proposes a sensor network coverage optimization algorithm based on the outer neighboring polygon of the Voronoi diagram. After setting up the virtual sensor node set at the periphery of the area according to the agreed rules, the Voronoi diagram is used to divide the real sensor nodes in the area and the virtual sensor nodes at the periphery of the area together, and define the outer neighboring envelope polygon. Aiming at efficiently shutting off redundant sensors and enhancing coverage ratio, the authors present a virtual centripetal force–based coverage-enhancing algorithm for wireless multimedia sensor networks (WMSNs). 9 These holes are obtained using a Voronoi diagram for the case of sensors with the same sensing ranges, and a multiplicatively weighted Voronoi (MW-Voronoi) diagram for the case of sensors with different sensing ranges. 10 In order to improve the coverage effect of wireless sensor networks, a network coverage algorithm based on evidence theory is proposed in Wang and Guo. 11 In order to effectively improve the coverage of a wireless sensor network in the monitoring area, a coverage optimization algorithm for wireless sensor networks with a Virtual Force-Lévy-embedded Grey Wolf Optimization (VFLGWO) algorithm is proposed in Karimi-Bidhendi et al. 12
The swarm intelligence algorithm proposes new ideas to solve the coverage optimization problem of HWSNs. In recent years, a large number of scholars have applied swarm intelligence algorithms to the coverage control of HWSNs and studied its performance. Alia and Al-Ajouri 13 proposed the introduction of a harmony search algorithm in wireless sensor networks to optimize nodes. Although the algorithm has strong parallel search capabilities, it converges slowly near the optimal solution, which makes it difficult to meet the real-time requirements of dynamic nodes. Du et al. 14 proposed a PSO-based wireless sensor network coverage optimization algorithm, which can effectively achieve wireless sensor network coverage optimization. The disadvantage is that the PSO algorithm is easy to fall into local extreme points, which limits the search range of particles. Feng et al. 15 proposed to combine K-means clustering with artificial fish school algorithm (AFSA) to improve the coverage of the network. This method can effectively avoid the algorithm from falling into premature and accelerate the convergence of the algorithm, but there are insufficient considerations for the random deployment of nodes, the perception blind zone, and the overlap zone. Duan et al. 16 proposed to apply the improved ant colony algorithm to network node coverage optimization. Although it increases the algorithm’s strong local search ability, it does not consider actual environmental factors to a certain extent, which affects the real-time performance of network coverage optimization.
There are also some other solutions to the coverage problem of heterogeneous sensor networks, such as the research studies.17–20 When there are still problems such as high computational complexity, poor real-time performance, and slower convergence speed of the algorithm. In response to this problem, the Sine and Cosine Algorithm (SCA) is used to improve the WOA. Change the convergence factor of the original algorithm from linear decline to nonlinear decline in the form of cosines, balance the capabilities of global search and local search, and add inertial weights in the form of synchronous cosines to improve optimization accuracy and speed up search speed. A coverage optimization algorithm for HWSNs based on Sine–Cosine Algorithm Optimization Whale Algorithm (SCA-WOA) is proposed. The improved WOA solves the HWSNs coverage optimization model to obtain the optimal coverage plan and improve the network coverage.
Mathematical model
Assuming that the monitoring area is a limited two-dimensional plane, an appropriate number of sensor nodes is placed in the area to achieve the complete coverage of the area. In practical applications, the complete coverage of the monitoring area does not need to be achieved, and the deployment of a large number of nodes will impose unnecessary costs. Generally, only incomplete area coverage and a limited coverage rate are required for a specific area. Under the minimum cost, an appropriate number of nodes are deployed to achieve the coverage control of the network. Alternatively, under a certain cost mechanism, a limited number of nodes are deployed to achieve the optimal network coverage.
In this research, the probability-aware model is used to calculate the coverage rate of the network. Each sensor node in the HWSN takes itself as the sensing coverage center, and has a circular area with a fixed communication radius. Therefore, it is difficult for all the sensor nodes to solve the total coverage of the monitoring area via mathematical equations. To simplify the coverage problem in WSNs, the area to be monitored can be discretized into m × n pixels. Assuming that x pixels are covered by WSN, the coverage can be expressed as x/(m × n).
Suppose that the measurement radius r of each sensor node in a WSN is the same as the communication radius rs, and the coverage area of each sensor node is a circular area with radius r. In this work, it is assumed that the measured area of the sensor network is a two-dimensional plane M, which is discretized into m × n pixels. There are N sensor nodes in the WSNs. The set of sensor nodes in the measured area is G = {g1, g2, …, gN}, and the position of the ith sensor node gi is (xi, yi). Assuming that the coordinates of the pixel H are (xH, yH), then the distance between the pixel and the sensor node of gi is as follows

Using a two-dimensional perception model, the probability of the sensor node gi sensing pixel H is

Assuming that any one sensor node can be sensed by multiple sensor nodes at the same time, the joint probability that the sensor node at pixel H is sensed by the node set G of wireless sensor network is

The coverage rate λ of all the sensor nodes to be detected is

In addition, assuming that the network nodes work efficiently
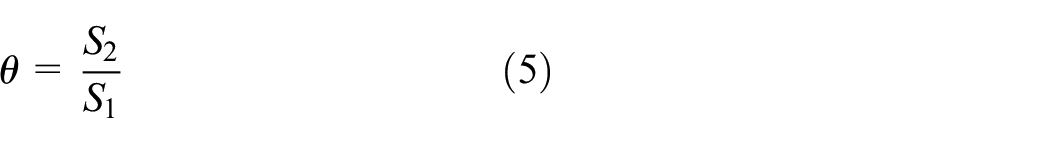
In equation (5), the parameter S1 is the total number of sensor nodes, and the parameter S2 is the number of effective working sensor nodes.
Taking into account the energy balance of the network, the definition of energy balance coefficient η is introduced, specifically, the parameter Ei represents the remaining energy of the node i, and the parameter k represents the number of the active nodes

The parameter η reflects the equilibrium degree of the network energy consumption. The larger the value, the more uneven the energy consumption. On the contrary, the more uniform the energy consumption.
Since the coverage of WSNs is optimized to integrate the number of the working nodes, the coverage rate, and the energy balance, on the basis of making the network coverage rate meet the actual application requirements, as many redundant nodes as possible go to sleep state, thereby saving the energy consumption. Therefore, the coverage optimization objective mathematical model f of WSNs is

In equation (7), the parameters ω1, ω2, and ω3 are the weight coefficients, ω1+ω2+ω3 = 1.
The optimization goal of the network coverage model of HWSNs is the maximum value of the coverage function in equation (7).
Improved WOA
WOA
The WOA simulates the hunting behavior of humpback whales. Each solution to the problem is regarded as a whale, and each whale uses a random exploration mechanism to search for prey when hunting. 21 After the prey is found, it uses contraction envelopment and spiral bubble net attack to launch an attack. In the WOA algorithm, inspired by bionics, the iconic hunting methods of whales are modeled as the processes of encirclement, predation, and random search. 22
Encirclement process
In the process of optimizing the function of the algorithm, the position of each individual represents a solution searched by the algorithm in space. When performing optimization tasks, in order to accurately find the location of the optimal solution, each individual generated in the algorithm begins to explore the area near the initial location. 23 Assuming that the individual with the smallest fitness value in the current population is the target prey, other whales update their positions according to this position. The mathematical model at this stage is as follows 24


wherein, the parameter X(t) represents the position of each individual at the tth generation, X*(t) represents the global optimal position at the tth generation, and the parameter t represents the current iteration number, where the parameters A and C are as follows


Among them, the parameters r1 and r2 represent the random numbers that obey the distribution of [0, 1], and the parameter a represents an adjustment parameter that decreases from 2 to 0 as the number of iterations increases. 25 During the predation process, the humpback whale bubble net predation method is to narrow the encircling circle while spiraling. In the mathematical modeling, the shrinking orbiting mechanism of a school of whales is simulated by changing the parameter a. The value range of the parameter A in the algorithm is between [−a, a]. When the value of A is between [−1, 1], the position X(t+1) of each individual at generation t+1 is the position X(t) and tth generation when they are in the tth generation. Based on this idea, the goal of surrounding prey is achieved between the global optimal position X*(t) in the generation time. The mathematical model is expressed as

In formula (13),
When each individual whale swims toward the target, it adopts two strategies: shrinking the encircling circle and spiraling forward. In order to make these two methods go on at the same time, the probability of choosing two travel methods when performing optimization tasks is set in the modeling is 50%, and the mathematical model is expressed as

In formula (14), the parameter p is a random number and obeys the distribution of [0, 1].
Prey search process
In the process of searching for the optimal solution, when the value of the parameter A in the algorithm is |A| ≥ 1, the position update of each individual is realized by relying on each other’s position. This update strategy makes it possible for each individual to stay away from the location of the current optimal solution. If the algorithm falls into the local optimal solution, this method improves the probability of the algorithm jumping out of the local optimal area to a certain extent. 27 The mathematical model is as follows


wherein, the parameter Xrand represents the random individual position in the population at the tth generation.
Improved WOA
Compared with other intelligent algorithms, the whale algorithm has many advantages, but the basic whale algorithm has problems such as slow convergence speed and local optimal solutions when dealing with high-dimensional complex problems. Therefore, some improved whale algorithms are proposed in the field of algorithm optimization. In this article, an improved whale algorithm is applied to solve the optimal coverage problem of HWSNs. The convergence factor a in the whale algorithm shows a linear convergence trend in the iterative process, which does not conform to the actual iterative search process of whales. The algorithm needs to avoid the emergence of premature problems when dealing with high-dimensional complex problems. In order to balance the global search and local search capabilities, this article uses the cosine form of decreasing method, the specific expression is as follows

Among them, the parameter t is the current iteration number, and the parameter Tmax is the maximum iteration number. When the inertia weight value is large, the global search ability is strong, and the inertia weight value is small, the local search ability is strong. Therefore, this article draws on the cosine change of the previous convergence factor a and applies a new nonlinear inertia weight. As the number of iterations increases, it dynamically adjusts the global search and local search capabilities while accelerating the algorithm’s convergence speed and improving the accuracy of the algorithm’s optimization

The expression of the weight ω(t) is

The initial t value of the number of iterations is small, the weight ω is large, and the adjustment step of the algorithm is also large. The whale can search for the optimal solution in a large space. As the number of iterations t increases, the weight ω becomes smaller and smaller, and the algorithm adjustment step size also becomes smaller. At this time, the whale performs a fine search in the optimal solution neighborhood space. The parameter ω changes adaptively as the number of iterations of the current whale group changes, which improves the convergence accuracy of the whale algorithm and speeds up the convergence speed.
Application of SCA-WOA algorithm in optimal coverage of HWSNs
This article designs the coverage optimization objective of HWSNs based on the improved SCA-WOA algorithm. That is, the maximum value of the objective function of the coverage optimization of the HWSN is solved, based on the coverage rate optimized by the SCA-WOA algorithm, and the distribution position of all the sensor nodes in the area to be tested after the optimized deployment is obtained. 28
The coverage optimization steps of HWSNs are as follows:
Step 1. Initialize the heterogeneous sensor network coverage optimization system, randomly generate N sensor initial positions and initial energy, the population size of the whale algorithm is n, and set other parameter vectors A and C, the convergence factor a, and the maximum number of iterations Tmax. And the vector of the whale’s moving position.
Step 2. Calculate the fitness values of all whales according to the fitness function, keep the positions of the whales with high fitness values, and search for the whales with low fitness values in the direction of their prey. The objective function is the fitness function. The objective function in this article is the maximum coverage of HWSNs.
Step 3. Calculate the fitness of each whale from the objective function f(x), and save the optimal value.
Step 4. Update the location information of the whales by searching, encircling, and attacking their prey, so that the whales are approaching to prey in the direction of the maximum power point.
Step 5. Generate uniformly distributed WOA and other parameters through equation (13), update parameters a, A, and C at the same time, and update parameters through equation (14).
Step 6. Compare the size of A, compare the probability factor value with 0.5, and select the corresponding location update formula. Update the current position according to the spiral mechanism of equation (16).
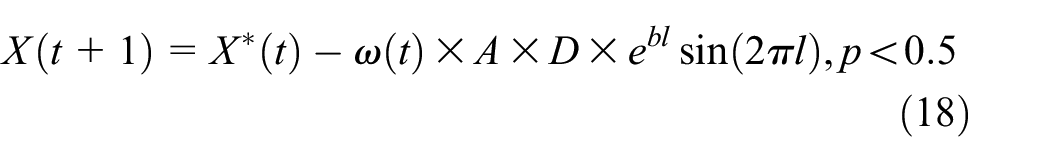
Step 7. Update the saved optimal position X* according to formulas (18) and (19). Combining the sine and cosine algorithm with the WOA to screen the position of the leader, to a certain extent, avoids the defect that the algorithm is prone to premature maturity. This method retains the superiority of the WOA, while balancing the algorithm’s global detection and local optimization capabilities. Decide whether to update the global optimal position. 29
Step 8. Determine whether the algorithm satisfies the stop loop condition. If it does, it will jump out of the main loop and output the target position and the optimal fitness function value. Otherwise, return to Step 3 to recalculate.
The flowchart of HWSNs coverage optimization based on SCA-WOA algorithm is shown in Figure 1.

Flowchart of coverage optimization based on SCA-WOA algorithm.
Comparison and analysis of algorithm simulation
Based on the MATLAB 2017a simulation environment, this article solves the proposed HWSNs heterogeneous node deployment and coverage optimization problem based on the SCA-WOA. Performance comparisons are made with particle swarm PSO algorithm, AFSA, and basic WOA. The four algorithms are tested on HWSNs’ coverage effect, coverage rate, node remaining energy, and algorithm simulation time-consuming indicators. The population size is set to 50, and the maximum number of iterations is set to 50.
Function objective optimization
In order to reflect the superior performance of the SCA-WOA algorithm proposed in this section, mainly, from the two aspects of the algorithm’s convergence speed and optimization accuracy, we give five test functions for algorithm experiment comparison. The mathematical formula, dimension, and boundary range of the standard test function are shown in Table 1.
Basic information of the test function.

The four algorithms of PSO, AFSA, WOA, and SCA-WOA are used to test and compare the functions. The five test functions are all very classic and commonly used functions in the performance test of the swarm intelligence optimization algorithm. The experimental results are shown in Table 2.
Test function experiment results.
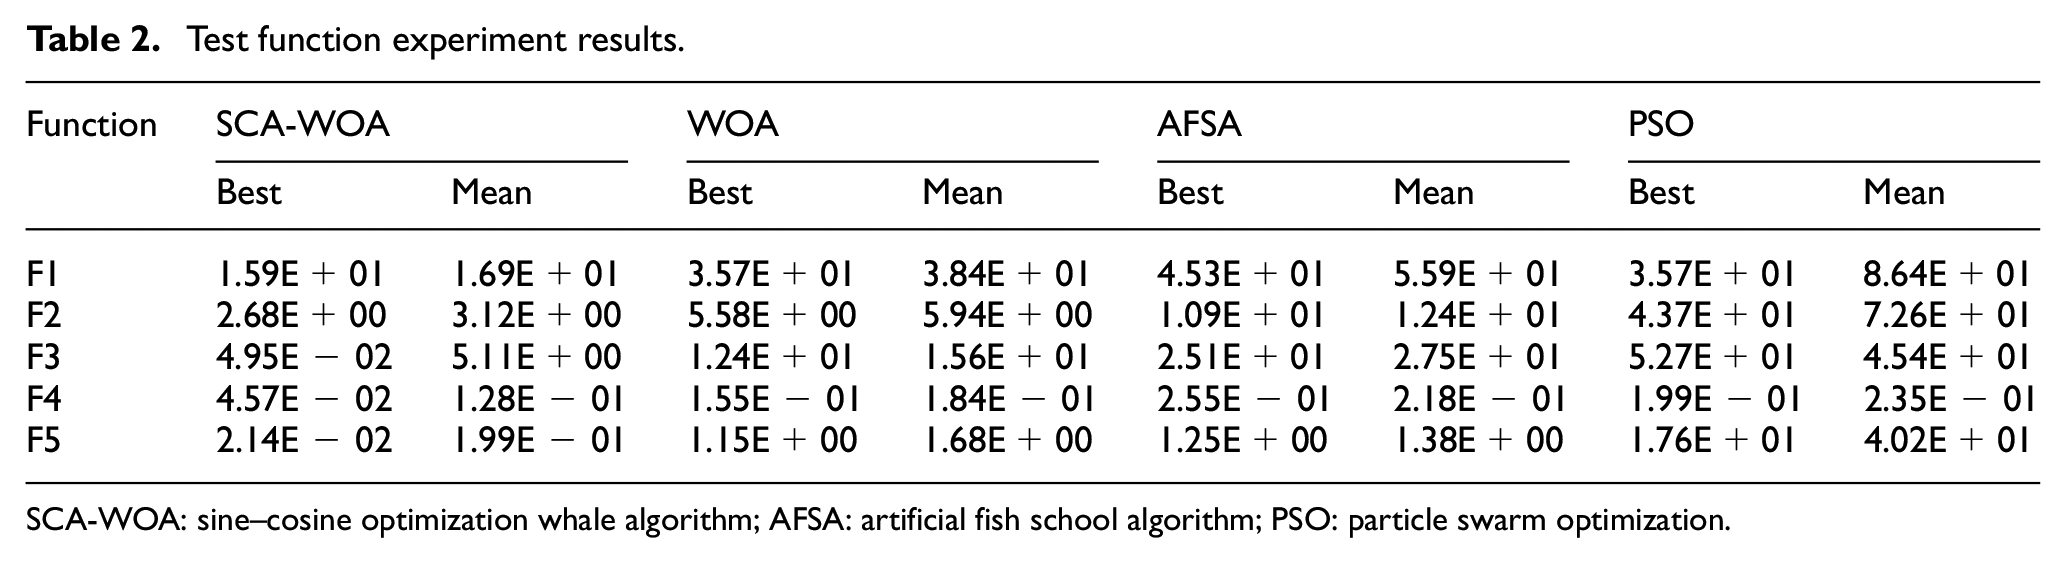
SCA-WOA: sine–cosine optimization whale algorithm; AFSA: artificial fish school algorithm; PSO: particle swarm optimization.
It can be seen from the results of the function of the four algorithms to solve the optimal value (seeking the minimum value of the function) that the accuracy of the order of magnitude of the function optimal solution of the four algorithms is different. On the whole, the PSO algorithm has the lowest accuracy, the AFSA algorithm has a lower accuracy, and the WOA algorithm has a higher accuracy. The algorithm proposed in this article has the highest accuracy of the minimum value of the solution function. Taking the test function F5 as an example, the improved SCA-WOA algorithm is two orders of magnitude higher than the algorithm calculated by the basic WOA algorithm. From the overall test results, the optimization effect of the PSO optimization algorithm is the worst. It can be seen that the performance of the improved SCA-WOA algorithm has obvious competitive advantages.
Coverage effect comparison
First, in the monitoring environment, assume that the area of the environmental area that needs to be monitored is 100 × 100 m2, and 50 sensor nodes are randomly deployed here. Including heterogeneous nodes with different perception radius, the perception radius range is [5,20], which are some random numbers. The initial energy of the node is 1 J, and the energy of the heterogeneous node is 3 J. The simulation software uses MATLAB R2017a.
Comparison of coverage effects
In order to compare the coverage performance of the four coverage algorithms of PSO, AFSA, WOA, and the algorithm proposed in this article, the average results of 50 experiments were performed under the same simulation conditions. First, randomly generate the position of the sensor node in the monitoring area. In the figure, a square frame represents the covered monitoring area, “•” represents the location of the sensor node, and the circle represents the coverage area of different sizes of heterogeneous sensor nodes. Figures 2–5, respectively, show the final position of the sensor node after the four algorithm optimizations of PSO, AFSA, WOA, and SCA-WOA.

The coverage effect of PSO algorithm: (a) 50, (b) 100, (c) 500, and (d) 1000.

The coverage effect of AFSA algorithm: (a) 50, (b) 100, (c) 500, and (d) 1000.

The coverage effect of WOA algorithm: (a) 50, (b) 100, (c) 500, and (d) 1000.

Covering effect of SCA-WOA algorithm: (a) 50, (b) 100, (c) 500, and (d) 1000.
When the sensor nodes of HWSNs are randomly deployed, the four different algorithms are from 50, 100, 500, and 1000 iterations, the number of iterations increases sequentially, and the network coverage rate increases significantly. When the number of iterations increases, the network coverage rate has been greatly improved. Taken together, the proposed SCA-WOA algorithm has improved coverage compared with PSO, AFSA, and WOA algorithms. From the perspective of the overlay effect of the heterogeneous sensor nodes, the nodes of the PSO algorithm are very obvious in the 50 iterations, and a large area is not covered, and the effect is very poor. At 1000 iterations, there are still some overlays and blank areas, and the coverage effect of the PSO algorithm is not ideal. The AFSA algorithm has a small amount of overlay and a small amount of blank areas when deployed at 50 iterations. At 1000 iterations, the final coverage effect is relatively good. However, there are many overlapping areas of coverage between heterogeneous nodes, causing some waste of coverage nodes. The basic WOA algorithm also has large coverage overlap and large coverage gaps in heterogeneous nodes in 50 iterations. After 1000 iterations, the final coverage effect still has some areas that are not covered, and the coverage overlap between nodes still exists. But overall, the coverage effect is better than the performance of the previous two algorithms. The SCA-WOA algorithm proposed in this article has obvious node aggregation at 50 iterations, but the network coverage blank area is the smallest. At 1000 iterations, the final coverage effect is the best, and the coverage redundancy area between heterogeneous nodes is the smallest. The coverage of white space in the network is also the smallest. On the whole, the algorithm proposed in this article has the best coverage and the fastest algorithm convergence speed.
Comparison of coverage rate
Network coverage is a key indicator considered by HWSNs. As the number of iterations increases, the HWSNs’ coverage comparison between the basic PSO, AFSA, WOA, and the proposed SCA-WOA algorithm is shown in Figure 6.
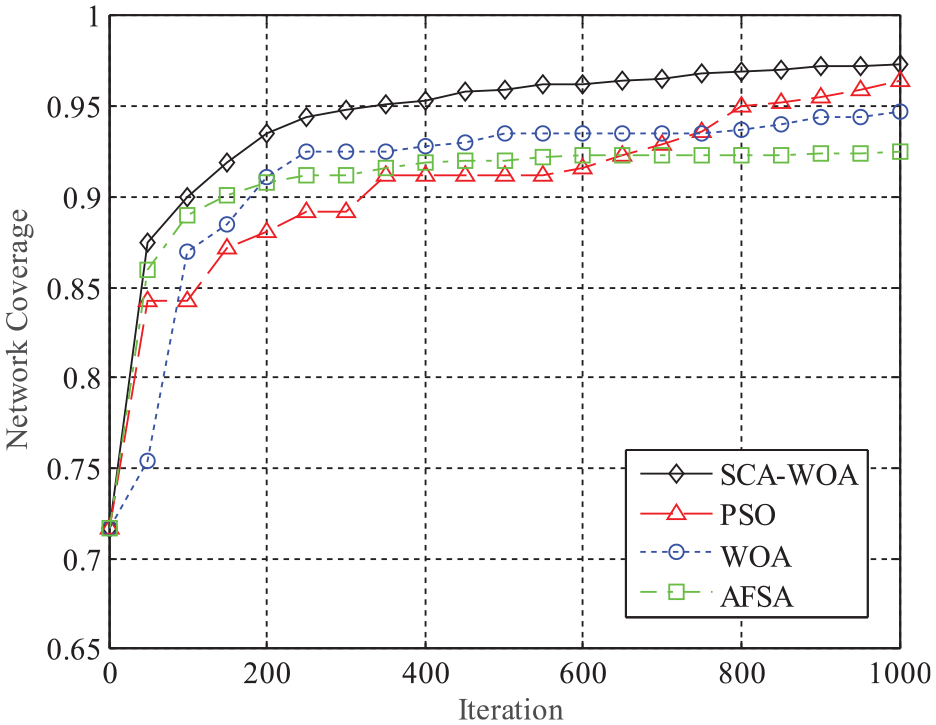
Comparison of coverage effects of the four algorithms.
The network coverage of the four algorithms is gradually increasing with the increase in the number of iterations. Especially when the first 1–100 iterations are calculated, the coverage of the four algorithms increases the most. From the 100–400 iterations, the coverage rate of the four algorithms is gradually increasing, slowly rising. When the iteration reaches 500 times, the PSO algorithm basically reaches the maximum value and does not increase, the basic AFSA algorithm is still slowly improving, the WOA algorithm is basically unchanged, and the algorithm mentioned in this section has the largest increase. When iterated to 1000 times, the coverage rate of the SCA-WOA algorithm proposed in this article reached 96.8%, the WOA algorithm reached 94%, the AFSA algorithm reached 93%, and the PSO algorithm only reached 91%. On the whole, the proposed algorithm has the highest coverage and the best performance.
Comparison of network coverage under different number of nodes
In order to increase the superior performance of the proposed SCA-WOA algorithm, we have increased the comparison of the network coverage effect under different number of nodes. The coverage rates of the four algorithms are compared as shown in Figure 7.
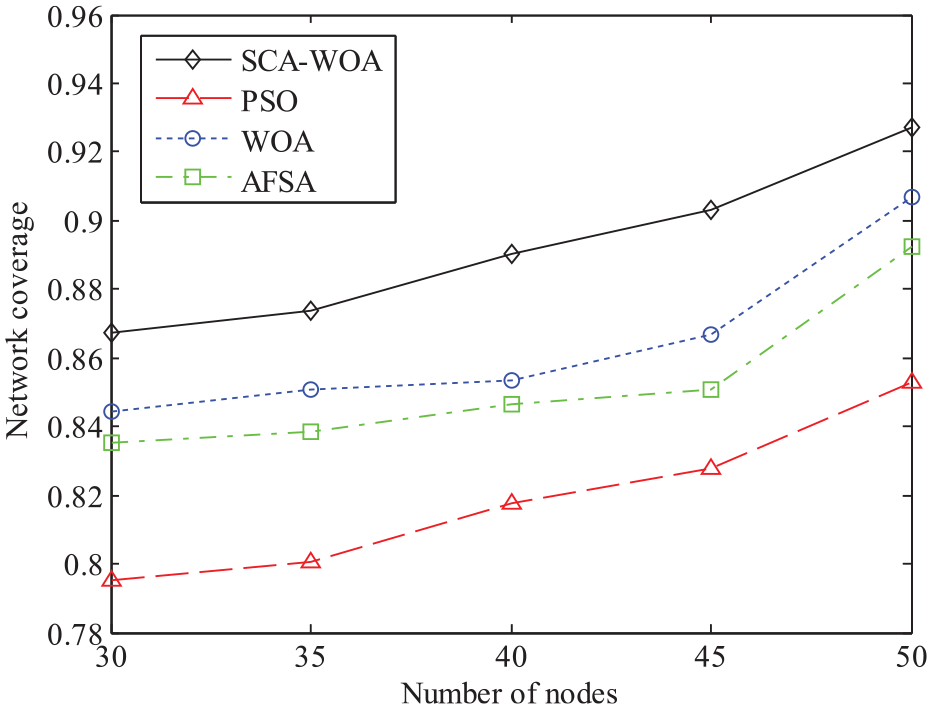
Comparison of network coverage under different number of nodes.
It can be seen from Figure 7 that when the number of heterogeneous sensor nodes is increased, the coverage of each algorithm is significantly improved. On the whole, the SCA-WOA algorithm proposed in this article has the highest coverage. The basic WOA algorithm has a higher network coverage rate, the AFSA algorithm has a lower network coverage rate, and the basic PSO algorithm has the lowest network coverage rate. Comparing the growth rates of the four algorithms respectively, the algorithm proposed in this article has the fastest growth rate, the WOA algorithm has a faster growth rate, the AFSA algorithm has a slower growth rate, and the PSO algorithm has the slowest growth rate.
Comparison of network connectivity
The network connectivity of HWSNs is generally measured by the network connectivity rate, and the calculation of the connectivity rate is more complicated. We all know that the data transmission of heterogeneous sensor nodes is a multi-hop self-organization method. Our connection rate is calculated by the number of hops of data transmission, the number of hops from the source node to the destination node is counted, and the connection rate is calculated by the data of heterogeneous nodes. It is obtained by transmission traversal method. Taking the data transmission from the heterogeneous sensor node of the source node to the destination node as an example, the data from the source node are transmitted to the destination node in order to find its one-hop, two-hop, and three-hop neighbor heterogeneous nodes, and the multi-hop transmission continues. Until the number of connections to the original source node does not increase. The comparison of the calculation results of the HWSNs connection rate of the four algorithms is shown in Figure 8.

Comparison of network connectivity rates.
The comparison of the connectivity performance of the four HWSNs fusion algorithms in Figure 8 shows that the network connectivity of the four algorithms gradually decreases with the increase in the number of simulation polls. This is mainly due to the remaining energy of the network as the simulation progresses. Gradually decline, resulting in a gradual decline in network connectivity. From the comparison of the network connectivity performance of the four algorithms, the PSO algorithm has the worst network connectivity, with an average connectivity rate of only about 0.3. The connectivity rate of the AFSA algorithm is about 0.5, the connectivity rate of the basic WOA algorithm is about 0.65, and the average coverage rate of the SCA-WOA algorithm proposed in this article is about 0.78. On the whole, the SCA-WOA coverage optimization algorithm proposed in this article has the highest network connectivity rate and is relatively stable. In the 40th round, the connectivity rate value is still 0.79, and the network connectivity performance is better.
Conclusion
This article analyzes the basic principles and shortcomings of the WOA algorithm, and proposes an improved SCA-WOA algorithm on this basis. The algorithm introduces the sine and cosine algorithm to avoid falling into the local optimum and strengthen the global search ability. At the same time, combined with the fitness value, an adaptive location adjustment strategy is proposed to speed up the convergence speed of the algorithm, and the SCA-WOA algorithm is applied to the node deployment problem of HWSNs. Experimental results show that the SCA-WOA algorithm effectively avoids falling into local optimality and speeds up the convergence speed. Compared with the basic WOA algorithm, the SCA-WOA algorithm improves the coverage rate of HWSNs by 8% after optimization, and its application adaptability strong.
Therefore, the SCA-WOA algorithm designed in this article improves the coverage performance of the HWSNs network to a certain extent, but in the application process, some regional nodes are too clustered. Future research directions should make HWSNs cover more evenly and reduce the area where nodes gather.
Footnotes
Handling Editor: Yanjiao Chen
Declaration of conflicting interests
The author(s) declared no potential conflicts of interest with respect to the research, authorship, and/or publication of this article.
Funding
The author(s) disclosed receipt of the following financial support for the research, authorship, and/or publication of this article: This work was supported in part by the Natural Science Foundation of Hubei Province under Grant 2020CFB304, the Talent Introduction Project of Oujiang College of Wenzhou University, in part by the Science and Technology Program of Sichuan, China (2020YFH0124), the Guangdong Natural Science Foundation of China (2114050002219), the Zigong Key Science and Technology Project of China (2020YGJC01), and the Huzhou Science and Technology Plan Project (2020GG33).