
Abstract
Today, the most serious threat to global health is the continuous outbreak of respiratory diseases, which is called Coronavirus Disease 2019 (COVID-19). The outbreak of COVID-19 has brought severe challenges to public health and has attracted great attention from the research and medical communities. Most patients infected with COVID-19 will have fever. Therefore, the monitoring of body temperature has become one of the most important basis for pandemic prevention and testing. Among them, the measurement of body temperature is the most direct through the Forehead Thermometer, but the measurement speed is relatively slow. The cost of fast-checking body temperature measurement equipment, such as infrared body temperature detection and face recognition temperature machine, is too high, and it is difficult to build Disease Surveillance System (DSS). To solve the above-mentioned problems, the Intelligent pandemic prevention Temperature Measurement System (ITMS) and Pandemic Prevention situation Analysis System (PPAS) are proposed in this study. ITMS is used to detect body temperature. However, PPAS uses big data analysis techniques to prevent pandemics. In this study, the campus field is used as an example, in which ITMS and PPAS are used. In the research, Proof of Concept (PoC), Proof of Service (PoS), and Proof of Business (PoB) were carried out for the use of ITMS and PPAS in the campus area. From the verification, it can be seen that ITMS and PPAS can be successfully used in campus fields and are widely recognized by users. Through the verification of this research, it can be determined that ITMS and PPAS are indeed feasible and capable of dissemination. The ITMS and PPAS are expected to give full play to their functions during the spread of pandemics. All in all, the results of this research will provide a wide range of applied thinking for people who are committed to the development of science and technology.
Keywords
Introduction
World Health Organization (WHO) received the first Novel Coronavirus (COVID-19) alert on December 31, 2019. COVID-19 can cause mild to moderate respiratory diseases, and it is more infectious for patients with long-term cardiovascular diseases, diabetes, and chronic respiratory diseases. There is no specific vaccine or treatment at present. 1 Therefore, comprehensive monitoring of infected individuals and the development of the Disease Surveillance System 2 are particularly important during the outbreak phase.
Additionally, the Health Monitoring Systems built with the Internet of Things (IoT) technology, cloud computing, and big data analyses can be provided to the Centers for Disease Control and Prevention (CDC) to prevent, predict, and monitor new infectious diseases. 3
Research by Zhu et al. 4 showed that today a large number of people around the world own smartphones with communication functions, enabling them to interact with the Internet anytime, anywhere. Therefore, integrating smartphones with the Internet of Things (IoT) and creating a monitoring system suitable for pandemic prevention, medical treatment, and health care will be very helpful for self-care and infectious disease outbreaks.
With the constant decline in the price of IoT devices and the increasing functionality of IoT devices, the application of IoT combined with wireless communication has been successfully implemented in all areas of life. For example, health care sectors in various countries often use remote health monitoring systems as a reference for disease prevention, infection prediction, and emergency decision-making on infectious diseases. 5 Through Information and Communications Technology (ICT), the operational efficiency of the health care sector can be improved6,7 and a large number of sensors and IoT devices can be integrated to collect and analyze a large amount of data. In doing so, more applications for pandemic prevention and remote care can be created.8,9
As of August 1, 2020, the number of cases of COVID-19 infection worldwide is still increasing. How information technology can accurately predict infection threats in real time is of particular importance at the current stage of prevention. Results from Tuli et al. 10 have showed that infection control through machine learning and cloud computing can be used to predict pandemics and provide pandemic prevention decisions for infection control, which will prevent the spread of infection.
In order to measure the body temperature required for COVID-19 detection, this study proposed the IoT Intelligent pandemic prevention temperature measurement system (ITMS) and Pandemic prevention situation analysis system (PPAS). The systems will address problems faced by COVID-19, such as the lack of measurement equipment, high costs, difficulty in identification, power consumption, equipment maintenance, inability to overcome difficult environments, and poor software integration services.
The rest of this article is arranged as follows. In “Related work” section, the literature is reviewed. “The proposed systems” section discusses the concepts of this study and ITMS and PPAS are proposed. “Features and advantages of ITMS and PPAS” section discusses the features and advantages of the ITMS and PPAS. Finally, “Conclusion” section presents the conclusions.
Related work
In this section, COVID-19, IoT, and cloud computing will be discussed separately.
COVID-19
The coronavirus belongs to the suborder Coronaviridae of the order Reticulovirus, and its genera is divided into four types: α, β, γ, and δ. Under the electron microscope, it appears spherical or elliptical, with cystic collagen fibrous processes on it, hence the name Crown. The coronavirus was first discovered in poultry in 1960. There are about 30 types of coronaviruses currently known, of which seven are known types of human coronaviruses. 11
Coronavirus is a common flu virus in the biological world. Its main symptoms include fever, cough, swelling of the throat, and inflammation of the upper and lower respiratory tract. An outbreak of severe acute respiratory syndrome (SARS) in China in 2003 was caused by a novel coronavirus that spread across 37 countries, killing more than 8,000 people globally, with a mortality rate of 9.6%; The Middle East Respiratory Syndrome (MARS) broke out in the Middle East in 2012. Its transmission route is from camels to humans. It is less infectious than SARS but has a higher fatality rate. 12 Obviously, the emergence of the new viruses seems to threaten global public health. 13
The emerging coronavirus infection that broke out at the end of 2019 was the first to find multiple cases of unexplained virus pneumonia in Wuhan, China. In January 2020, the WHO confirmed its virus as a new type of coronavirus, and officially named it severe acute respiratory syndrome coronavirus 2 (SARS-CoV-2). It belongs to the B-Coronavirus genus of the Coronavirus family, which is a branch of the SARS virus species. Like SARS and MARS, it is a cross-species infection of mammals and poultry to humans. According to studies, the incubation period for viral infections is mostly 14 days, with estimated basal regeneration rates of around 5.7, well above SARS 2 and MARS 0.8–1.3. Infection was confirmed in Japan, Thailand, South Korea, and the United States on January 21, 2020. WHO issued the global pandemic as an “international public health emergency” on that day. As of July 2020, more than 17 million people worldwide were infected and nearly 700,000 deceased.14,15 To effectively prevent the spread of new diseases (such as the new coronavirus disease COVID-19), researchers and practitioners around the world are seeking relevant technologies to ascertain greater control and prevention of the pandemic from spreading worldwide.
From the perspective of proliferation prevention, contact tracing is of great importance to the battle against COVID-19. Earlier methods, either manual or semi-manual, were time-consuming, expensive, and inefficient. Current methods make use of smart devices combined with proximity measurement technologies (e.g. GPS, Bluetooth Wi-Fi) for contact tracing. Although the method is effective, there is the controversy of privacy protection. 16 In addition, the collection and analysis of various physiological information data is also very important. For example, body temperature monitoring can be applied to early detection strategy for infected people.17,18
Internet of Things (IoT)
The term Internet of Things was first proposed by Kevin Ashton in 1999 and was used by Germany as the basis for the development of Industry 4.0 (also known as the Fourth Industrial Revolution) in 2011, with the aim of improving the digitalization and intelligence of traditional manufacturing. 19 This vision was to become a smart factory through the combination of high technology such as artificial intelligence, big data, and ergonomics. With this idea as a starting point, smart home appliances, smart medicine, smart agriculture, smart city, and so on were introduced. By unifying everything in the world under a common infrastructure through the Internet of Things, one can always keep an eye on the changes and understand the current state of things, 20 thus communication and dialogue can be achieved. For example, communication between things, communication between people and things, and dialogue between people.
Tsai et al. 21 proposed IoT architecture consists of four layers, which include application layer, cloud computational resource layer, middleware layer, and perception layer. The four-layer framework of the IoT is shown in Figure 1. The application layer provides a variety of network applications and services. Common applications include medical, transportation, agriculture, industry, culture, food, and other industries. Cloud Computing Resource Layer provides the resources needed for services, and scheduling for Demand and Task. It effectively allocates resources and combines big data analysis and other technologies to analyze the data to generate prediction results or decisions, and then push the results to the application layer to achieve service or management functions. The middleware layer’s main tasks are to perform information transfer, data processing, and authentication. The sensing layer is mainly responsible for data collection and transmission, and it is mainly divided into sensing technology and identification technology. Sensing technology connects objects through sensors, has the ability to detect changes in the environment or objects; recognition technology is a wireless communication technology that identifies specific targets through radio signals to read and write related data.

Four-layer framework of IoT. 21
The 2019 COVID-19 resulted in the Internet of Things (IoT) being the pivot infrastructure of smart cities and the important technology to fight COVID-19. Many countries have conducted much development and research on monitoring and alerting pandemic cases. 22 One development is the thermal sensors for tracking pandemic cases and spread mitigation. The infrared camera is the most commonly used but has high costs and privacy issues. 23 High-cost problems could be solved through technology research and development. However, to effectively fight against global pandemics, the IoT data that are collected and shared require social recognition and security to obtain high-quality data for efficient control and monitoring. 24
Cloud computing
For technology companies, the cost of building a standalone server to serve customers is extremely high, and thus cloud computing rental services for emerging technology industries have been developed. If the cloud data center is built centrally to manage power, heat dissipation, and application function services, it can reduce the cost of construction and maintenance, and improve computing services, scalability, and accessibility.25–27
Cloud computing is not a new technology in the scientific and technological circles, but an academic concept. It is an Internet-based computing method that provides application services required by terminal equipment by sharing resources such as software and hardware. This concept was first proposed by Amazon for the online shopping platform. Google, Microsoft, Alibaba, and so on, which are also online service providers, followed suit. 28 With the rapid development of technology, Internet bandwidth and Internet speed are widespread. Not only can cloud computing be used for search engines and email that were developed in the early stage of the Internet, but also can be use in all-round application services such as artificial intelligence and satellite navigation. 29
With the advent of cloud computing and the improvement of hardware and software, Internet service providers have divided their services into three categories:
Software as a Service (SaaS): Providers provide software services to users by lease. Users can share data, applications, or collaborate on projects with teams from cloud hosts without having to install software on end devices.
Platform as a Service (PaaS): Providers provide a cloud environment that includes applications such as operating systems, programming languages, libraries, and databases. Users do not need to manage hardware, networks, and other cloud hardware facilities. They only need to develop, manage, and maintain application services on the application layer.
Infrastructure as a Service (IaaS): Providers provide cloud computing units, storage units, network components, and other cloud-based resources. Users have almost complete control over cloud host resources.
Cloud deployment can be broadly divided into three types: public, private, and hybrid. Public cloud builds an open cloud service platform for third-party cloud providers. Users can use the application services through the Internet at a relatively low cost. This deployment is the SaaS type deployed by a third-party cloud provider. The private cloud is the opposite of the public cloud operating architecture. It provides a single enterprise or personal service, and a cloud computing architecture that can be built and managed by an individual or enterprise administrator. It only provides services for users with corresponding permissions. Therefore, private clouds have higher security, scalability, and stability. Relatively, the cost of building is higher than that of public clouds. Hybrid cloud, as its name implies, contains the characteristics of public cloud and private cloud. It transfers non-sensitive information to the public cloud for calculation and returns the result to the private cloud. Therefore, it can prevent the private cloud from exceeding its computing performance.30,31
The proposed systems
In this section, we will discuss in detail the proposed system, the concept of the COVID-19 IoT ITMS and PPAS).
The dilemma of body temperature measurement during the pandemic prevention stage
The outbreak of COVID-19 in 2019 caused chaos in global pandemic prevention. There is shortage in ear thermometers, forehead thermometers, and infrared body temperature measuring devices. In addition, pandemic prevention procedures established by agencies of various countries lacked ability for personal identifications, instant notifications, control of mobility, and analysis of high-risk groups. As a result, the spread of pandemic becomes rampant and there is panic of city lockups. Therefore, this research proposed a pandemic prevention system to improve body temperature measurement hardware systems and to develop a pandemic prevention tracking software systems. The following describes the system concept proposed in this research.
The concept of the proposed systems
This study uses IoT and cloud computing technologies to develop ITMS and PPAS systems, and uses the school as the site of the experiment. In the process of system development, this research used ITMS and PPAS system planning and development through the technical architecture design and prototype implementation in Proof of Concept (PoC). For the ITMS part, this research used the service model designed in Proof of Service (PoS). The design of the system flow aims at convenience and simple operation. In the PPAS part, the system is developed and designed for the purposes of data collection, statistical chart presentation, risk control, and cloud system architecture. Finally, based on the business model design in proof of business (PoB), the operation feasibility analysis was carried out, and a service solution for monitoring pandemic infectious diseases was developed. See Figure 2 for the developed solution.

The integration of ITMS and PPAS.
This research aims to improve the problems faced by traditional body temperature measurement equipment in the pandemic prevention stage. An ITMS prototype system is developed with personal identification and self-measurement through IoT components. Its main functions include reading of radio frequency identification (RFID) cards, scanning of QR-Code, measuring body temperature, warning lights reminder, and data transmission. Feasible verification of PoC and PoS are conducted. The results proved that ITMS is indeed feasible in designing technical concepts and, various hardware functions and services. Therefore, the development and construction of the physical structure of ITMS were carried out. The PPAS is a software system developed to respond to functions such as real-time notification of pandemic prevention, control of mobility, and analysis of high-risk groups. It includes two major modules: pandemic prevention app and pandemic prevention battlement analysis. The pandemic prevention app module allows users to perform identity verification on mobile devices, show temperature safety passes, view personal temperature records, and receive warning notifications for high-risk areas. Users are allowed to obtain more pandemic prevention information and to avoid exposure to high-risk areas causing cluster infections. The pandemic prevention battlement situation analysis module is conducive to the pandemic prevention center personnel to control the pandemic information in a timely manner, and to make pandemic prevention analysis and crisis management decisions. In this research, the two major modules of PPAS are carried out, namely, the PoS feasibility verification, and the stability and accurate ITMS communication transmission, identity verification and early warning notification.
Finally, this research carried out PoB commercial verification for the proposed system. Experimental tests for ITMS and PPAS were conducted at a University of Science and Technology in Taiwan. Suggestions were collected from relevant personnel at the institution for pandemic prevention to improve the systems and to confirm the feasibility of ITMS and PPAS subsequent introduction to other institutions. The two modules, ITMS and PPAS, will be introduced in the following sections.
Intelligent pandemic prevention temperature measurement system (ITMS)
To construct an ITMS based on COVID-19, the first task is to understand the components of the system and fully understand the characteristics of each component. Therefore, in this study, we disassembled the traditional forehead temperature gun to study the details of the component function and configuration, and actually tested the function of each component, such as infrared distance sensor, RFID Reader, body temperature sensor, and power supply. During the actual test, it was found that infrared distance sensors may produce interference and false positives if there is sunlight. Some cards may be unreadable due to the various specifications of IoT RFID Reader components. The specifications of the body temperature sensor include short, medium, and long distances, and the sensing range is fan-shaped. A collar must be installed to control the sensing range. The power supply part needs to be considered for cost, and it cannot be replaced by a mobile power supply. The LED display is replaced by a seven-segment display. After repeated tests, the IoT components used in this study are shown in Figure 3.
IoT components.
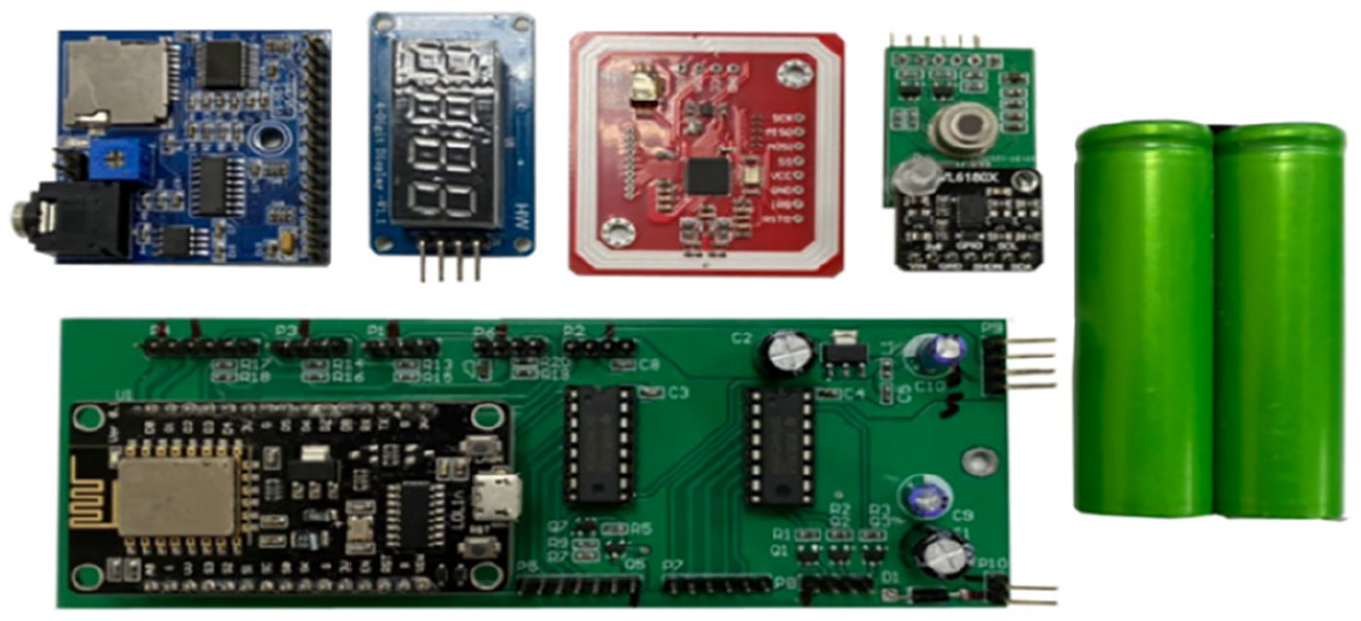
Figure 4 is the IoT component and self-modularized circuit board used in this study. They include the voice module, seven-segment display, RFID Reader, laser distance sensor, body temperature sensor, microcontroller unit (MCU), and power supply. Each sensor needs to be modularized through a self-planned circuit board. The advantage is to reduce the system size and improve the stability of the system. The printed circuit board (PCB) plan and the integration of various components are shown in Figure 4.

PCB, IoT components, and circuit diagram.
Figure 4 is the integrated result of the circuit diagram, PCB and all IoT components designed by the study. To solve the two problems of insufficient GPIO output pins of MCU and the main power supply above 12 V, PCB was specifically designed to include two 74HC595 integrated circuits and stabilizing circuits to meet ITMS requirements and avoid system instability caused by insufficient voltage. The MCU used by ITMS is Node MCU, mainly because the MCU has integrated the ESP8266 Wi-Fi module, so that edge computing and data analysis can be performed on this control version, and the data can be sent to the cloud platform through ESP8266. The ITMS prototype system is shown in Figure 5.
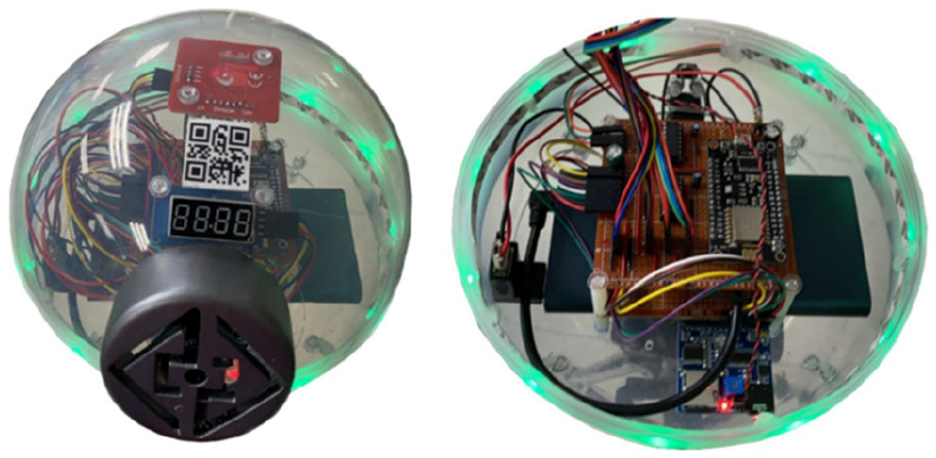
ITMS prototype system.
Figure 5 is the ITMS prototype system designed for this study. The prototype system integrates all the IoT components used, and the equipped RFID Reader allows students, teachers, and staff to identify themselves with identification cards. The QR-code on ITMS can be identified by scanning the QR-code with the mobile app when the identification card is not available. The front protrusion is a laser distance sensor and a body temperature sensor. Users can measure their forehead temperature by placing their forehead close to this place by about 3 to 5 centimeters. The seven-segment display above will display the personal temperature in real-time, and the whole process will be guided by the voice module. The measured body temperature will be compared with the system threshold. The surrounding LED light bars are in red, green, and yellow colors to show whether the measured body temperature is too high, normal, or too low. Finally, the data will be pushed to the cloud system via the Message Queuing Telemetry Transport (MQTT) protocol via the ESP8266 Wi-Fi module mounted on the Node MCU. Figures 6 and 7 illustrate two scenarios in the process of measuring body temperature.

ITMS measurement method 1.

ITMS measurement method 2.
Figure 6 is the temperature measurement of scenario 1 in this study. It is mainly used for school students, teachers, and staff to verify their identity with identification cards. The Node MCU of ITMS will first determine the correctness of the RFID card number and start the temperature measurement program. The team will guide the user to measure the forehead temperature, the system’s body temperature threshold will be interpreted on the Node MCU, and the LED light bar will be controlled by GPIO to display the body temperature status. The ESP8266 Wi-Fi module is used to transmit the user identification card number, the unique onboard device UUID identification code of ITMS, and the measured temperature. After receiving the data pushed by ITMS, the MQTT Server on the cloud will perform a second verification of the user identification card number. When the verification is correct, it will access the cloud database through Web API (in-house code) to complete the measurement process of the entire scenario 1.
Figure 7 is the second scenario for measuring body temperature in this study. The scenario 2 differs from scenario 1 in that the procedure before the forehead temperature is measured. This scenario is mainly aimed at identifying the identity of school students, teachers, and staff who forgot to bring their identification cards. ITMS provides users with real-time display of all measurement information through the mobile app. After the mobile app obtains the UUID identification code, it will push the data of MQTT. After receiving the user identification code and UUID identification code pushed by the app, the MQTT Server will push the identification code to the designated UUID device a second time. The identification of ITMS and the subsequent forehead temperature measurement process are the same as in scenario 1. The actual field distribution of ITMS is shown in Figure 8.
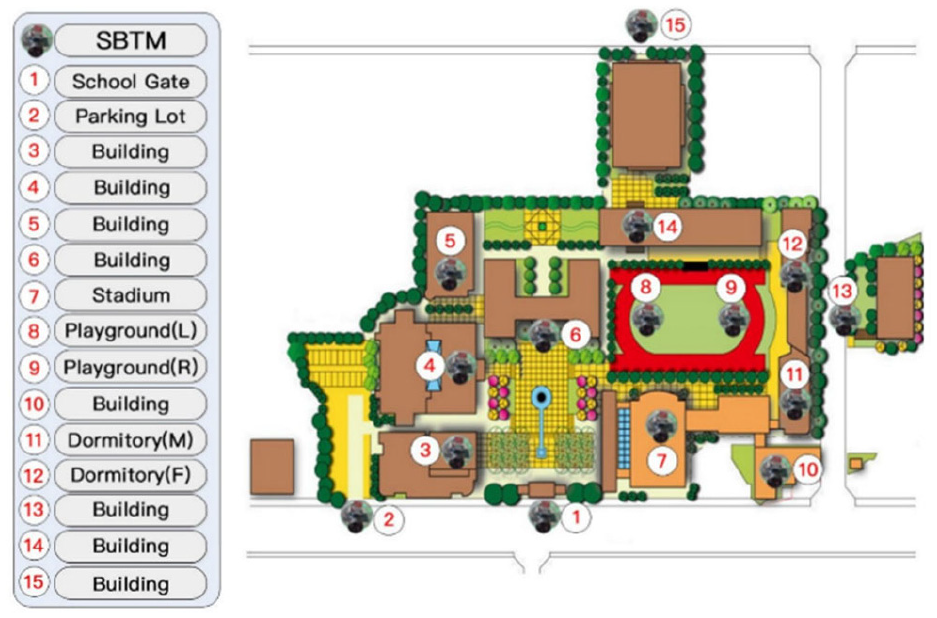
ITMS field map.
This study selected National Taichung University of Science and Technology as the ITMS laboratory area. In response to the outbreak of COVID-19 on campus, guards are assigned to the four main entrances and exits of the campus without ITMS, and infrared thermal imaging temperature sensors are used to measure body temperature. The biggest problems encountered in school vaccination include the high cost of infrared thermal image temperature sensors, people cannot be identified during the second phase of the pandemic prevention phase, check points are distributed only at the four main entrances, the inability to control the flow of people, and the deployment of guards consumes a lot of manpower. The distribution of this lab area is shown in Figure 8. Fifteen ITMS are distributed across all entrances and exits of the campus. All personnel are required to measure their own body temperature when entering and exits. The measured data will be sent to the cloud system for storage. Each data will also record the ITMS UUID code of the measurement point. The campus app can display the personal measurement data in real time. The campus app will show whether the personal measurement data is normal with icons and colors. When the icon is abnormal or expires, the measurer can take a second body temperature measurement for pandemic prevention at various measurement points on the campus. This experiment has indeed solved the problems faced by the current pandemic prevention process, and carried out a large-scale analysis of the stored data. The data analysis can be presented in the back-end management system as the main reference for the pandemic situation center. The campus pandemic prevention app and the pandemic situation center chart will be explained in the next chapter.
Pandemic prevention situation analysis system (PPAS)
Since ITMS is responsible for collecting body temperature data for pandemic prevention, for the COVID-19 pandemic prevention center, collecting data alone is not enough to achieve the purpose of pandemic prevention. The pandemic prevention center wants to understand how to correctly find a case when the temperature of a case in the group changes. As far as the school is concerned, each department and institution may want to know the rate of student attendance, and the class instructor may need to know the temperature change of the classmates and the number of classes attended. Therefore, this study proposes the PPAS, which analyzes the data collected by ITMS and presents it in the form of charts. This will help the pandemic prevention center to control the overall pandemic prevention situation and make timely pandemic prevention decisions. The overall system structure of PPAS is divided into two parts as shown in Figure 9, namely the cloud system and the user interface system. Next, the two systems and the overall software architecture will be explained:
i. Cloud System: This cloud system is divided into four major modules, followed by MQTT module, AP module, web and web API modules, as well as database modules. The following will introduce this part in detail.
i.i. MQTT Module: The module is mainly responsible for ITMS MQTT access service. Since external applications cannot directly contact the back-end AP module, website service module, and database module, they can only send information through the MQTT protocol. This module takes into account the security access settings. Any MQTT information push on ITMS must pass the security verification of this module.
i.ii. AP Module: AP Server is equipped with the MQTT service application, which listens for all ITMS push information on the MQTT module. All access to the database module must be performed by the web API provided on the web Server, which is responsible for linking all information streams.
i.iii. Web and Web API Module: The web server will mount the chart service required by the pandemic situation center. Users can browse the charts through mobile phones and web pages. Data access to the database and the results of data analysis will be performed using RESTful API.
i.iv. Database module: This module will store all ITMS collected vaccinal temperature data. For data integration and interface of other systems, the module will provide an additional cascading interface. Since vaccination data are dynamic and data volume is large, the database host will provide a load balancing and shunting mechanisms to avoid system latency problems caused by host overload.
ii. User interface system: The user interface system distinguishes two major modules, namely the pandemic prevention app module and the epidemiological analysis module. These two modules are introduced in detail.
ii.i. Pandemic Prevention App Module: This study provides personal pandemic prevention apps, mainly showing personal history of thermometer, and exclusive access to pandemic prevention certificate, through which you can freely enter and exit the campus. The certificate is valid for 4 h, after which it will show a pattern indicating an expired certificate. User will have to re-measure through ITMS to obtain a new certificate. The use of pass-through certificate can effectively reduce the problem of frequent measurement of incoming and outgoing and avoid the burden of manpower; this pandemic prevention app must be registered and logged in to perform identity authentication. For this reason, the system includes a person privilege feature. For example, if the user is a teacher, he can start to monitor the personnel data of his class. In addition to grasping the temperature information of the students in the class, he can also track the attendance rate of the students and provide the necessary care for the students in a timely manner. Another important feature is the ability to scan and take pictures of ITMS QR-code through the camera shooting function when you forget to wear an ID card. For ITMS identification purposes, please refer to Figure 10 for a complete presentation of the anti-pandemic app system module function.
ii.ii. Epidemiological Analysis Module: Another important software feature in this study is the pandemic prevention analysis chart, which can be presented on a large screen or kiosk. System chart features include: real-time body temperature distribution chart, personal temperature change chart, campus staff movement chart, pandemic warning chart, high-risk infection group analysis chart, and so on. The following describes each chart function individually:
Real Time Temperature Distribution Chart: This chart shows the temperature distribution of the personnel of each department on campus (see Figure 11). Histogram is used to display normal body temperature, above threshold, and below threshold conditions, which can be accessed through the stratification to track what you want to watch.
Chart of Personal Temperature Change: When a case of hyperthermia is found, this chart (see Figure 12 for details) uses a line chart to present historical data that can be traced to the case, and the changes in body temperature can be clearly seen.
Campus Person Movement Distribution Chart: This chart represents the movement of people, calculated on an hourly basis and presented using Scatter Diagram (see Figure 13). Managers can clearly understand the flow of people and accurately grasp the location of crowds. In case of emergency evacuation, it can be used as a reference for evacuation decision-making.
Pandemic Alert Analysis Chart: The system uses big data to identify people who may cause excessive body temperature. The system uses pie chart to present the temperature interval distribution of the number of people (see Figure 14). Relevant personnel information can be consulted for the interval to be tracked. This chart provides managers with real-time control of the early warning objects and timely early warning decisions.
Analysis chart of high-risk infection groups: When a confirmed case of COVID-19 occurs, the system uses big data analysis to find the path of the confirmed case, and screen out high-risk infection groups. The scatter diagram is used to show the area where the high-risk infected person is currently located, and the relevant information of the person can be obtained through the aggregation function (see Figure 15 for details).
iii. Software System Architecture: Figure 16 is the software framework diagram of the user interface system. It includes the pandemic prevention app module and the pandemic prevention analysis module. This system uses web pages for compilation and responsive web design (RWD) as the design mode. Therefore, it can be adapted to any display interface, whether it is a mobile phone, a large screen, or a kiosk. The functions of the pandemic prevention app module include User Register, User Login, Account Info, Body Temperature, History, Passcode, and QR-code Scan. Pandemic prevention analysis module includes chart functions such as Personnel temperature distribution, Personal temperature trends, Personnel flow distribution, Early warning analysis, and Infection analysis.

PPAS system structure.
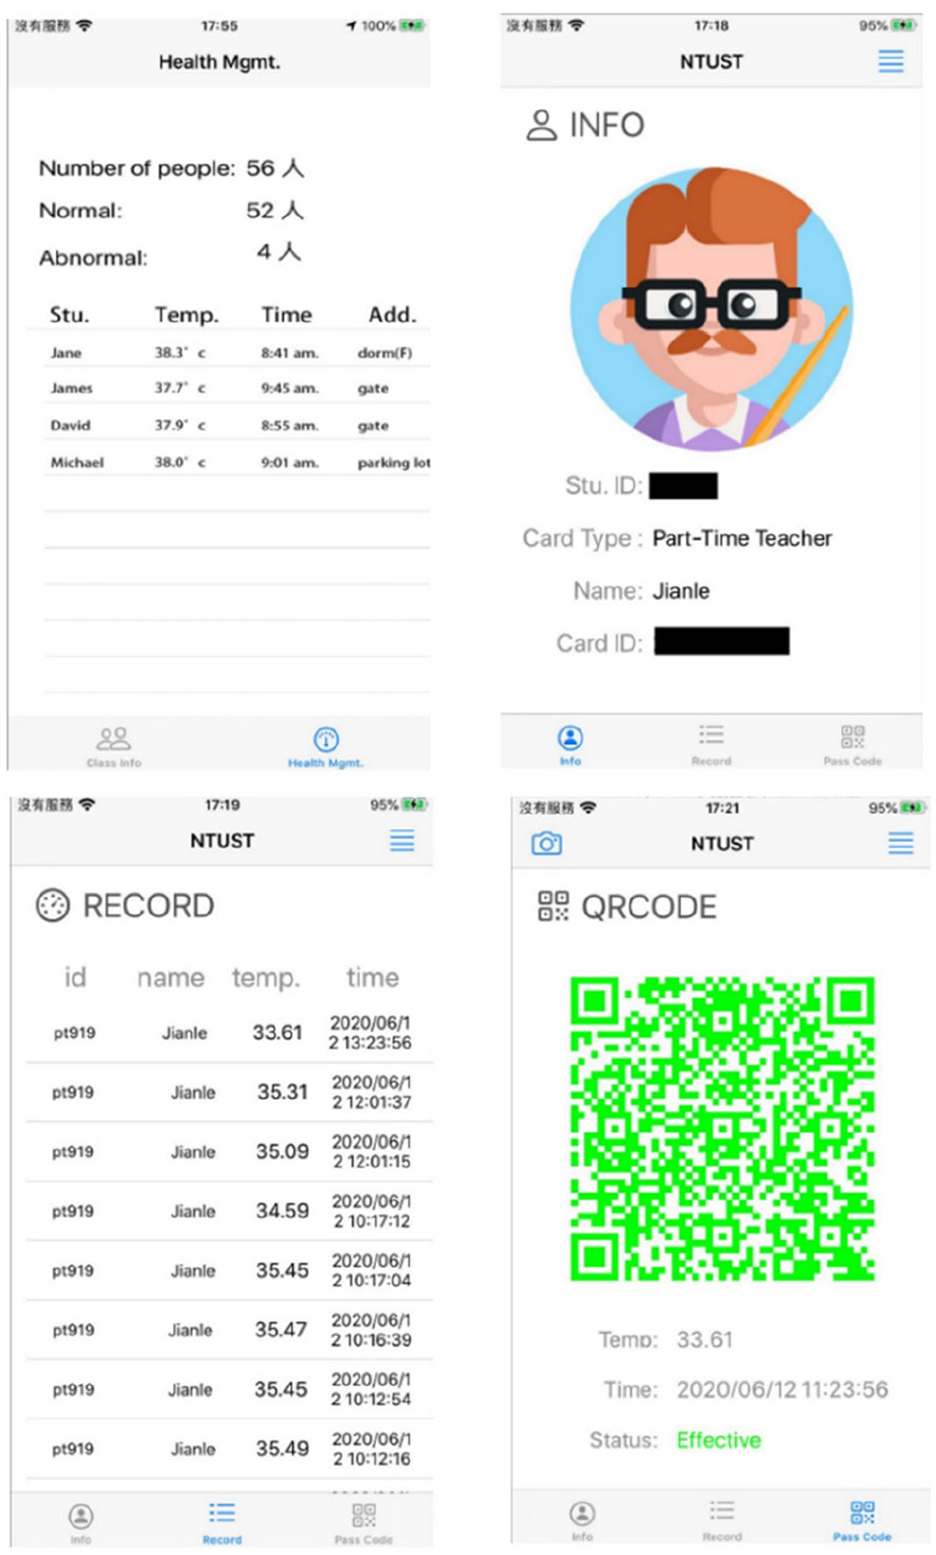
Pandemic prevention app module.

Personnel temperature distribution.

Personal temperature trends.

Personnel flow distribution.

Early warning analysis.

Infection analysis.

Software system architecture.
Features and advantages of ITMS and PPAS
The traditional forehead thermometer is the fastest and most convenient option for body temperature testing under normal circumstances. However, if it encounters a large number of personnel testing or large-scale inspections during the pandemic prevention period, it will not be able to quickly cope with the flow of people, and it takes a lot of manpower to carry out the measurement, which is not only labor-consuming but also time-consuming. If it is changed to an infrared body temperature sensor or a face recognition body temperature monitoring system, the cost will be relatively higher, and the construction procedures will be more complicated, which may not be affordable for ordinary people or private enterprises. In response to the above problems, this study integrated and analyzed IoT components including: RFID Reader, QR-code, laser distance sensor, voice module, body temperature sensor, seven-segment display, microcontroller Unit (MCU), and power controller. The ITMS and PPAS developed through PoC, PoS, PoB and other plans are not only low-cost, and can achieve the purpose of identification and rapid measurement without consuming too much manpower for management. In addition, the body temperature measurement data are presented via web technology, so that end users and administrators can always access the latest analysis information. The following describes the characteristics and advantages of the ITMS and PPAS in this study:
Human labor: The measurement equipment adopts a distributed arrangement where users can self-measure their own body temperature and the pandemic prevention app will issue a pass to facilitate entry and exit of other units. During the pandemic prevention period, the labor costs of measuring body temperature can be greatly reduced.
Costs: IoT components are used in development and construction to maintain accurate body temperature measurements and lower costs.
Power supply: The equipment is powered by battery, mobile power or USB, and adaptable to different environmental needs.
Maintenance cost: IoT components are generally low in cost and are therefore used in the construction. Damaged components can also be easily replaced.
Space constraints: The equipment can be placed on a table or standalone with a tripod stand, taking up very little space.
Instant warning: When temperature is taken, the result will be displayed with a LED light. If the temperature is too high, the system will issue an immediate warning to notify the pandemic prevention personnel.
vii. Traceability: The system will record the body temperature of each person, which can be queried in the pandemic prevention app and back-end management terminal. This is convenient for follow-up tracking during a pandemic for high prevention.
Remote monitoring: The back-end pandemic center system can view the data measured by all equipment, which is conducive to the data analysis of pandemic prevention.
Self-checking: The measuring device includes a self-checking function, and a problem can be automatically reported to the manager, saving a lot of manpower for device maintenance.
Identification: Users can use the RFID card or QR-Code for identification, which is conducive to the analysis of personal temperature data.
Protocol: Using MQTT as the communication transmission protocol requires a small network bandwidth and low cost hardware resources, which is very suitable for use in environments with low power consumption and limited network bandwidth.
System connection: The measurement device sends data to the MCU’s data output pin for integration with other external devices. The back-end pandemic center system also provides RESTful API for other systems to interface.
Conclusion
This study proposes an ITMS for COVID-19. The use of IoT technology combined with RFID and QR-code service process design enables ITMS to perform functions such as identity recognition, autonomous detection, voice guidance, and remote supervision. It has the characteristics of low cost, small space occupation, independent measurement, labor-saving, and good external communication interface. By combining it with the PPAS, users and managers can achieve historical data traceability, monitor large amounts of data, pre-warning analysis, and post-infection analysis. With the above advantages, it can replace the traditional forehead thermometer. Compared with the construction cost of infrared body temperature detection and face recognition temperature machine, the construction cost of ITMS and PPAS is less than US$300, which can solve the problem encountered in body temperature measurements. It can successfully overcome the problems of high manpower, high cost, and inability to identify identities faced by traditional measuring instruments in pandemic prevention. Moreover, pandemic prevention app module does not require a user’s GPS, Bluetooth, Wi-Fi and other permissions, which reduces the privacy protection disputes. In addition, the use of ITMS and PPAS is not only limited to the COVID-19 pandemic prevention period. The PPAS proposed by this system can not only analyze the body temperature measurement data of various departments and institutes in the school, but also provide administrators with functions such as the analysis of student arrival rates, the flow of personnel, and the self-management of personal temperature. When encountering the spread of other pandemic infections, ITMS and PPAS can quickly analyze the high-risk groups. In general, the ITMS and PPAS proposed in this research can be applied to governments, enterprises, schools, or general groups to measure body temperature for pandemic prevention and analyze and control big data. It can also be provided to partners or units who are interested in participating in IoT technology research and development as a reference to promote public health and inspire more applications.
Footnotes
Handling Editor: Francesc Pozo
Declaration of conflicting interests
The author(s) declared no potential conflicts of interest with respect to the research, authorship, and/or publication of this article.
Funding
The author(s) received no financial support for the research, authorship, and/or publication of this article.