
Abstract
As the support of wireless sensor networks expands to various application scenarios, the communication environments and the performance requirements of different application scenarios vary a lot. To cope with different communication environments and performance requirements, both data transmission ability and medium access ability are equivalently important. In this article, a joint analytical model is proposed to fully and precisely estimate networks’ communication performance, energy efficiency, and scalability. In the proposed model, both the physical layer’s and medium access control layer’s key parameters are taken into consideration. By comparing with OPNET-based simulation model, the rationality of the proposed analytical model is first validated under a wide range of network scenarios. Then, a series of simulations under general network scenarios and metering network scenarios are conducted. With these simulations, the performance of adjusting both layers’ parameters in improving communication performance and energy efficiency was proved superior to single-layer’s parameter optimizations. Finally, by comparing the available range of different key parameters’ optimal value under different network scenarios, the maximum backoff numbers and the minimum backoff exponent are considered to be the most effective parameters for metering network optimization.
Keywords
Introduction
Wireless sensor networks (WSNs) have penetrated many kinds of applications, from habitat monitoring to industrial control, for its advantages of low deployment costs, easier to installation, maintenance and reconfiguration, as well as inherent intelligent-processing capability over traditional wired devices. 1 For example, as one of the emerging applications of WSNs, new smart meters have superseded the traditional counterpart–wired electricity, water, and gas meters. 2 While, as the support of WSNs expands to various applications, the network configurations and performance requirements diverse a lot. In general IEEE 802.15.4-based metering networks, the scale of network usually ranges from tens to thousands of meters. 3 And the data acquisition interval ranges from milliseconds to days. 1 Salam and Khan 4 list some critical issues that can degrade overall network efficiency for WSNs, which include energy efficiency, reliability, latency, climate, dynamic network, and security. Since sensor nodes are battery-powered while WSNs are generally designed to support applications in long-term deployments, the object of high energy efficiency usually contradicts with high reliable and real-time communication. These contradictions become more outstanding in metering networks. In metering network, maintaining high reliability and low latency communication is indispensable. However, the performance of communication in WSNs usually fluctuates over time and space. And the harsh environment that metering networks exist makes communication links even more unreliable. For example, the multipath effect, frequency selective fading, and data delay often occur in the underwater acoustic communication due to the low transmission rate (generally ≤100 kbps). 5 Besides, the metering network may have to accommodate more and more devices, which demands the network with good scalability. To deal with these challenges, single-layer’s analysis is not sufficient anymore. Hence, this article takes the key parameters of the physical layer and medium access control (MAC) layer into consideration and constructs an overall analytical model to investigate the joint impact of these parameters on networks’ reliability, time efficiency, energy efficiency, and scalability.
The contributions of this article are as follows:
Without directly assuming the distribution of network traffic as previous works do, in this article, the network traffic on each channel is mathematically approximated as a Poisson’s process by characterizing the generation process of network traffic with a series of transformations among different stochastic processes.
An accurate and comprehensive analytical model for the analysis of IEEE 802.15.4 is proposed. The characteristic of sensor nodes is based on the TelosB mote Module. 6 On the physical layer, we take both modulation way and handshake mechanisms into consideration. On the MAC layer, by leveraging the properties of Poisson’s process, a simple but accurate formula of calculating the probability of successful channel access is obtained.
The effect of adjusting different layer’s parameters on improving networks’ communication performance and energy efficiency is simulated and analyzed in both general networks and metering networks.
According to the optimal value of key parameters under different network scenarios, we find out that the maximum backoff numbers and the minimum backoff exponent are the most effective parameters for metering network optimization.
The remainder of the article is organized as follows: related work is given in section “Related works.” Section “System model” presents the WSN network traffic analysis, the analytical model, and critical issues. In section “Critical issues,” three critical issues concerning data transport performance and energy efficiency are proposed and analytically characterized. In section “Simulation and analysis,” rational analysis and performance evaluation of the proposed analytical model and critical issue optimizations are presented. Section “Conclusion” provides our concluding remarks and discussions of the results.
Related works
IEEE 802.15.4 has been thoroughly investigated and many models together with optimization approaches have been proposed in the literature.7–27 Most of the proposed analytical models focus on either the physical layer or on the MAC layer. While in fact, the performance of communication is affected by both layers.
On the physical layer, in the quest for more accurate wireless channel characteristics, most analytical models adopt empirical data–based channel models.8–19 While the assumption of transmission features and corresponding energy dissipation characteristics differs a lot. The models in the literature8,9 assume the transmission power to be fixed. The models in the literature10–12 assume the transmission power can be adjusted continuously within a predefined range. While in the literature,13,14 they adopt discrete transmission power levels which are based on the characteristics of real sensor motes, such as Mica2 motes. Besides, within these studies, few of them consider the two-way handshaking mechanism completely. Although the model in the literature 15 considers the energy dissipation of both data packet and ACK packet transmission, it ignores the failure probability of ACK transmission. Inspired by Kurt et al., 16 many analytical models of physical layer start to take both successful probability and energy dissipation of two-way handshaking mechanism into consideration.17–19 Similarly, in this article, we model the physical layer according to the characteristics of the MICAz mote and take both modulation way and handshake mechanism into consideration.
Inspired by Bianchi’s 20 work, many models of the IEEE 802.15.4 MAC layer have been proposed in the literature.7,21–27 The majority of them are the Markov chain based.21–27 Park et al. 21 propose a general Markov chain model for the analysis of the IEEE 802.15.4 MAC layer. They took the retransmission limit and handshaking mechanism into consideration. However, the model in Park et al. 21 assumed a saturated traffic input which is not suitable for the majority appliances where the network does not always have packets to send. Jung et al. 22 propose an analytical Markov chain model under unsaturated traffic conditions. In their proposed model, they considered superframe structure, retransmission limit, and handshaking operation, which is better reflected the characteristics of the IEEE 802.15.4 MAC layer. However, since the Markov chain model adopts states to characterize the status and behaviors of wireless sensor nodes, a large number of states will be defined for a precise model. In some applications like industrial metering, the network may envisage a relatively large node population. The adoption of Markov chain model would render the whole model more complicated. Besides, another detail of Jung et al. 22 that needs to be reconsidered is the assumption of each node’s data frame arrival rate. For many metering networks, nodes usually generate data periodically. Hence, successive data packets from the same node are always strongly correlated with each other, which is inadequate to model as a Poisson’s process.
To avoid the high computational complexity that the Markov chain model brings about in dense WSNs, the model in Elshabrawy et al. 7 assumes the traffic of a WSN with thousands of metering devices follows the Poisson’s distribution. And the arrival rate of clear channel assessment (CCA) attempts is analytically derived as a Poisson’s process. The report success probability is finally evaluated according to the aggregate CCA attempts rate. However, the relationship between aggregate CCA arrival rate and the report success probability in Elshabrawy et al. 7 cannot be formulated, which will definitely take additional calculations in simulations. Inspired by Elshabrawy et al. 7 and Kurt et al., 16 we propose a more comprehensive and scalable analytical model for the analysis of IEEE 802.15.4. Instead of directly assuming the distribution of network traffic as Elshabrawy et al. 7 and Jung et al. 22 do, we provide a series of rigorous deductions on it. The MAC layer model in this article furtherly uses the properties of Poisson’s process and obtains a more detailed analytical model but with lower computation complexity than the model in Elshabrawy et al. 7 Besides, in addition to evaluating the throughput and energy consumption issue, this article explicitly analyzes and formulates three critical issues for WSNs, that is, reliability, time efficiency, and energy efficiency. Finally, a typical metering network is analyzed objectively and comprehensively under different network scales and traffic loads.
System model
Overview
We consider a WSN working in the beacon-enabled mode with star topology. One base station at the center and multiple sensor nodes are uniformly deployed around the base station within carrier sensing range. On the physical layer, we assume the transmission of a data packet is confirmed with handshaking mechanism (i.e. each successful transmission is replied with an ACK packet by the receiver). The characteristics of sensor nodes in this research take the TelosB mote Module as a reference, to simulate the actual situation as possible. On the MAC layer, we only consider the contention access period (CAP) in the active period. Beacon period and contention-free period (CFP) in the active period, as well as the inactive period, are beyond the consideration.
Network traffic analysis
Each sensor node is assumed to send a data packet to the base station in every T seconds, which consists of

For each sensor node, its successive data packets usually have a very strong correlation since each node usually reports to the base station periodically. However, for one channel shared by several sensor nodes, the correlation between its two successive data packets is much weaker. Since successive data packets that arriving at one channel always come from different sensor nodes, which may be completely irrelevant no matter in terms of external surroundings or application objects. Hence, it is more adequate to approximate the case that

According to equation (1), for a given report period T, as the duration of each time slot decreases, the value of

As

Let the product of

In the slotted CSMA/CA algorithm, the duration of one unit backoff slot is 320 μs. While for a sensor node in the network, the time interval between its two successive data packets is always counted by seconds. The value of
Device mode analysis
A wireless sensor node is always composed of several modules, including sensors, radio module, antenna, microcontroller unit (MCU), and so on. Radio module, antenna, and MCU are three main components in charge of data transmission. In the following analyses, we only consider the operation modes and energy consumption of the radio module and MCU, since these two modules are major modules in terms of both device function and energy consumption. TelosB mote takes the Chipcon CC2420 28 as its radio module and adopts the TI-MSP430 microprocessor 29 as its MCU module. The Chipcon CC2420 radio module has four operation modes: transmit, receive, idle, and sleep. Different operation modes correspond to different power consumptions. The TI-MSP430 microprocessor has six operation modes: one active mode and five low-power modes, that is, from LPM0 to LPM4. 29
According to the IEEE 802.15.4 standard, a node can be in one of the following four states: transmit, receive, idle, and sleep. A sensor node enters in transmit state as long as it is sending data packet. When in transmit state, the radio module stays in transmit mode and the MCU module stays in active mode for the procession of data packet. A node stays in the receive state as long as it is receiving a packet or performing CCA. And then, its radio module turns to receive mode and the MCU module stays in active mode to process received data or to identify whether the channel is clear or not. If there is no packet to be transmitted while the node is still in the active period or it stays at the backoff period, the node is in idle state. And then, the radio module is in receive mode and the MCU module is assumed to be in LPM3. Because in LPM3, the main clock source and the timer oscillator should be enabled in the MCU module to support for scheduled wake-ups. When a node is in the inactive period, it stays in sleep state with its radio module in sleep mode and its MCU module is assumed to be in LPM4, that is, the deepest sleep mode. Hence, the power consumption of the mentioned modes is shown in Table 1.
Power consumption of CC2420 and ATmega128L in different states.

Analytical model
The occurrence of a successful packet reception can be attributed to a series of layers. The proposed model is targeted to theoretically analyze the impact of physical layer and MAC layer on successful communication. For the physical layer and the MAC layer, packets are successfully received due to two reasons: successful channel access and successful packet transmission. In this analytical model, the key parameters of both the physical layer and the MAC layer that concerning the channel access operations and packet transmission are taken into consideration, as is shown in Figure 1. It should be noticed that the proposed model does not take the correlation and interaction between two layers into consideration. Since the impact of each layer on communication is independent. With the successful handshaking probability and the successful CCA probability, network performance metrics including network reliability, time efficiency, and energy efficiency can be estimated easily.

Frame diagram of proposed analytical model.
According to the datasheet of the Chipcon CC2420 radio module, the radio module provides eight transmission power levels, which is listed in Table 2 together with corresponding output power and power consumption.
Transmission power levels with output powers and power consumptions. 28

Considering a data packet is transmitted at power level

where

where

To cope with bit errors caused by noise, in digital communication, signals are always been modulated before transmission. To present the effect of modulation in improving the reliability of communication, we tried to transmit a signal in two different ways: one is to transmit it with offset-quadrature phase-shift keying (O-QPSK) modulation and the other way is to transmit it directly without any modulation. In Figure 2, it can be found that the transmitted signal with modulation can always obtain lower bit error rate (BER) than without modulation, especially when the SNR is high.

BER performance comparison between O-QPSK modulation and without modulation.
The BER of binary phase-shift keying (BPSK) modulation can be simply expressed with Q-function as

where the Q-function is defined as

For the O-QPSK modulation scheme, it consists of two BPSK modulations on in-phase and quadrature components of the signal. Hence, its BER can also be expressed as

where
Hence, the probability of a successful packet reception of a

And the corresponding failure probability is

Based on the above analysis, the packet reception probability relies on the transmission power level, the communication distance, and the length of packet. Since all communications are assumed of adopting handshaking mechanism, successful communication is the combination of successful data packet reception and successful ACK packet reception. Hence, the probability of a successful handshake occurs when a

And the probability of a failed handshake should be

On the MAC layer, sensor nodes start to perform CCA attempt as a new data packet arrives. Let

Since the packet arrival rate at one channel is assumed to follow a Poisson’s distribution, the CCA attempt rate of a channel
As is shown in Figure 3, according to whether the time interval between two successive CCAs on one channel is larger than one complete handshaking duration or not, the probability of successful CCA can be classified into two cases. According to case 1, if the time interval between the current CCA attempt and previous CCA attempt on one channel is larger than one complete handshaking duration, the current CCA will succeed for the length of time interval is enough for handshaking. In this notation, the backoff period is included in the time interval for the first CCA of a new data packet. According to the theory of Poisson’s distribution, 33 the distribution of time interval between two consecutive CCA attempts follows the exponential distribution. Therefore, the probability of case 1 can be expressed as


Two kinds of time interval between successive CCA.
A complete operation of handshaking includes the time of transmitting data packet, the time of waiting for ACK packet, and the time of receiving ACK packet. Accordingly, the time of one complete handshaking operation

where
As is shown by case 2 in Figure 3, if the time interval between current CCA attempt and previous CCA attempt on this channel is no larger than one complete handshaking duration, the sensor node of performing current CCA attempt can take its previous backoff period as a reference to do the primary evaluation. Supposing that all nodes are staying at the same backoff stage
where

Critical issues
Reliability
Reliability is denoted as the probability of successful packet reception

Time efficiency
Time efficiency is denoted as the excepted time interval for a successfully received packet from ready to be transmitted, until the transmission is successful and the ACK is received, that is, expected transmission latency
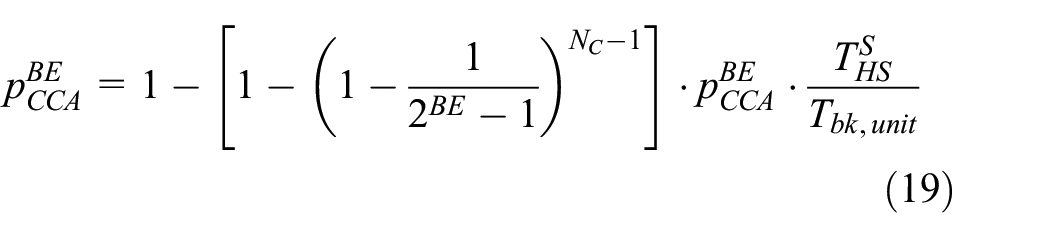
The expected delay caused by successful handshaking is given in equation (18). The expected delay caused by failed handshaking includes two parts, that is, the transmission time of data packet

where the maximum duration of waiting for acknowledgment
Hence, the expected transmission latency with the retransmission times as

Energy efficiency
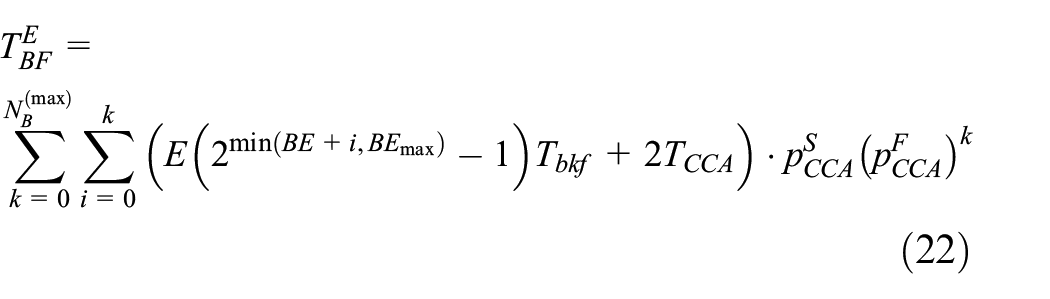
The operation of transmitting a packet is composed of performing CCA, backoff, data packet transmission, and ACK packet reception, which have been carried out earlier in the node’s behavior analysis. And the energy consumption of each operation can be estimated as the product of its duration and its power. With the expected latency of successful handshaking and failed handshaking, the expected energy consumption of handshaking operations can be derived similarly


The expected energy consumption caused by backoff operations can be expressed as

Hence, the expected energy consumption of successful transmitting a packet is

In the following section, the energy efficiency is measured by energy per megabits (EPMs), the energy consumed by sending 1 MB of data with the unit as mJ

Simulation and analysis
Simulation setup
In the following simulations, WSN devices are uniformly distributed within an area of 100 m × 100 m and operate in the 2.4-GHz industrial, scientific and medical (ISM) radio band with 16 workable channels. We borrow one of the path loss models from Kilic and Gungor
34
as
Key parameters of simulation.

The value of the time interval between the end of data packet transmission and the beginning of acknowledgment packet reception
Rational validation
To validate whether the proposed analytical model is rational or not, a simulation model based on the OPNET simulator is taken as a reference. 36 The validation is carried out from two perspectives: different network scales and different traffic loads.
Figure 4(a)–(c) presents the result of validation from the traffic load perspective. From this perspective, 100 nodes are deployed within the square area with each node’s packet arrival rate

Performance comparisons between analytical models and simulated model under different traffic loads and different network scales.
As is shown in Figure 4(a) and (d), the reliability decreases slowly at first and then sharply as the number of devices increases and the packet arrival rate gets higher. Similarly, Figure 4(b) and (e) shows network with a larger scale and higher packet arrival rate will have a higher value of average delay. Figure 4(c) and (f) further compares the performance of two models in terms of power consumption. This could be explained in conjunction with the behavior of the physical layer and the MAC layer. A large number of nodes in dense networks will experience more serious fading on the link due to heavier interference and longer average transmission distance. A higher arrival rate of data packet brings a higher network load, which promotes more intensive CCA attempts and longer backoff duration, which then aggregate the competition of channel access and finally lead to substantial transmission failure.
As is shown in Figure 4, the proposed analytical model fits the simulation model well in terms of reliability, transmission latency, and EPM with small network scale and low packet arrival rate. Even though significant gaps appear as the number of nodes and the packet arrival rate increases, the analytical model always behaves as an upper bound of the simulation model in reliability and as a lower bound in transmission latency and EPM. From equation (1), we can find out large network scale and frequent data packet arrival bring each channel with higher value of
Numerical analysis
The following simulation is performed under a typical scenario of 100 nodes deployed in the 100 m × 100 m area. To test the performance of both layer’s parameter optimization, default parameter setting according to IEEE 802.15.4, physical layer–focused parameter optimization and MAC layer–focused parameter optimization are also presented.
General network
In this part of analyses, the default parameter settings are taken as a baseline setting to compare with. And the comparison is elaborated from two perspectives, that is, communication performance and energy effectiveness. In communication performance comparison, we take the energy efficiency of default parameter settings as the upper bound
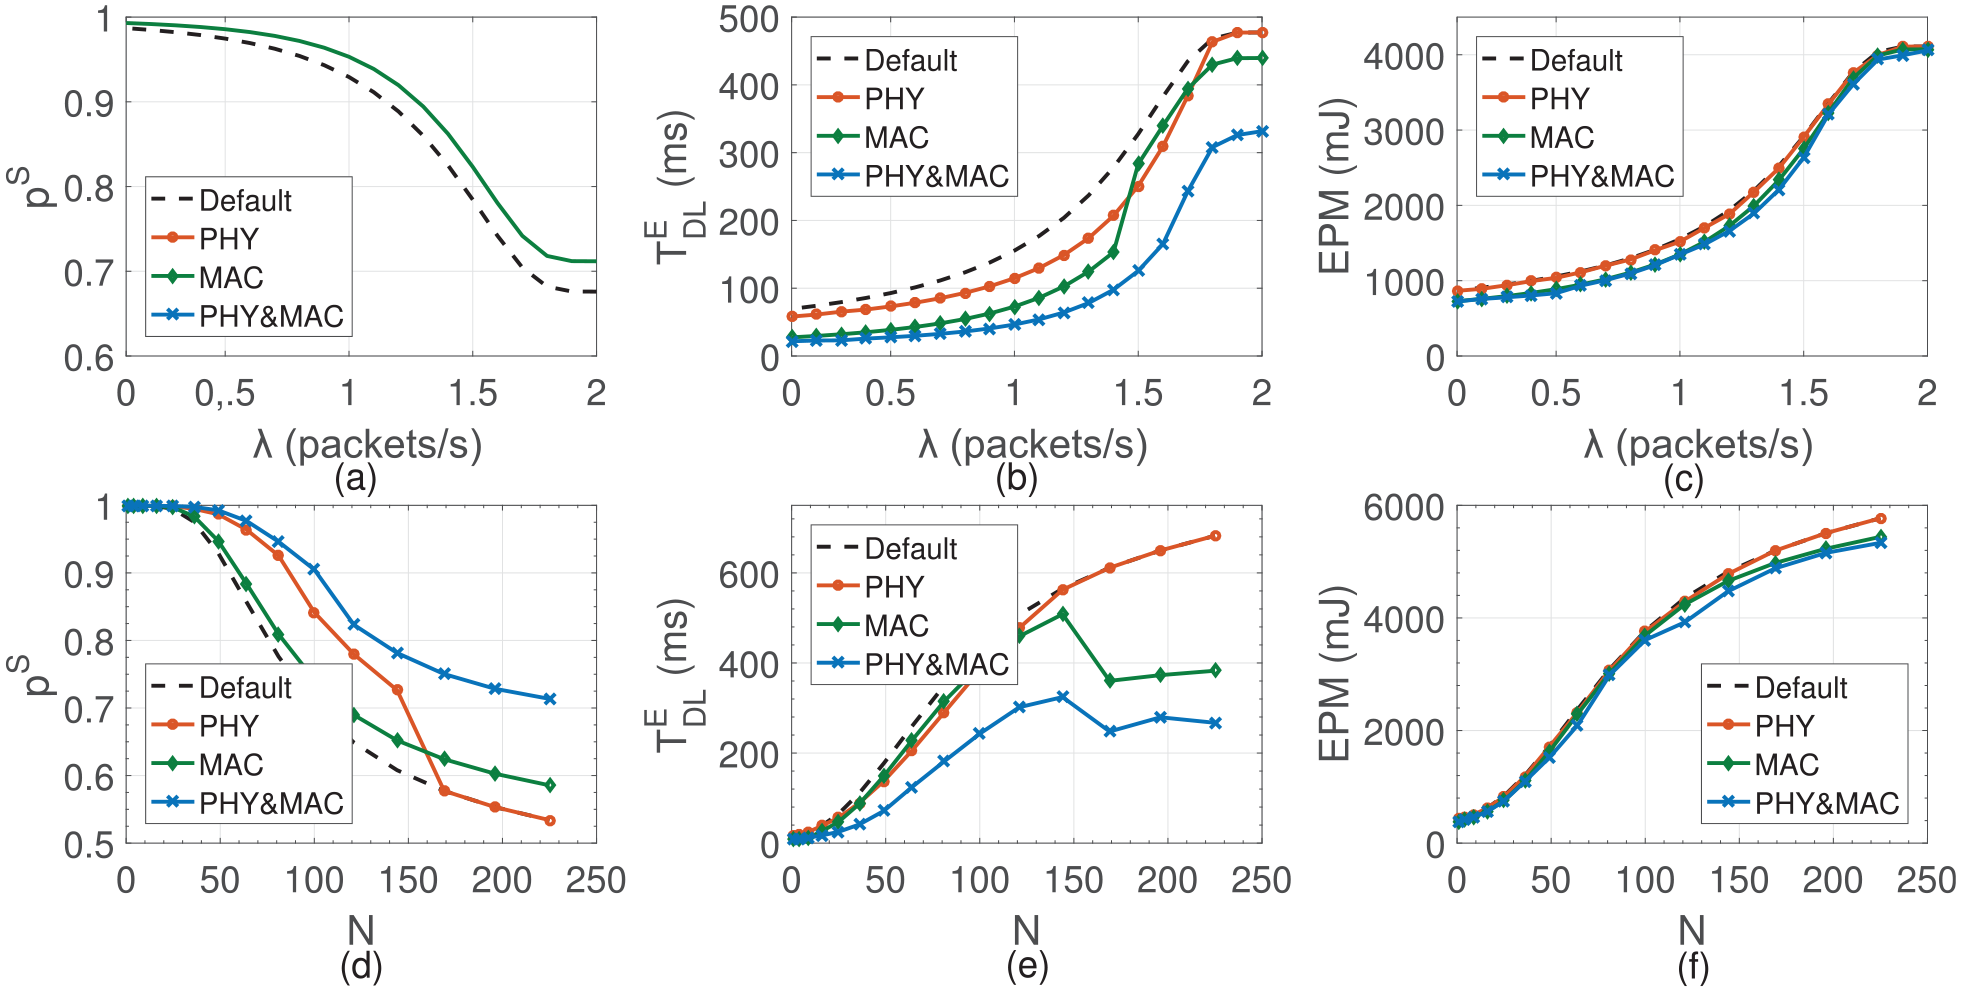
Data transport performance comparisons among different optimization methods under different traffic loads and different network scales.
In energy effectiveness comparison, we present the best energy effectiveness of three optimization methods with their communication performance no worse than default parameter settings. As is shown in Figure 6, three optimized parameter sets are all managed to meet the data transport performance constraints defined by default setting with higher energy efficiency. It should be noticed that the advantage of optimization considering both layers is more obvious in networks with more than 100 nodes and packet arrival rate more than 1.8. Hence, the optimization considering both layers outperforms the rest optimizations in terms of both data transport performance and energy efficiency under different network scales and traffic loads, especially in large-scale networks with heavy traffic loads.
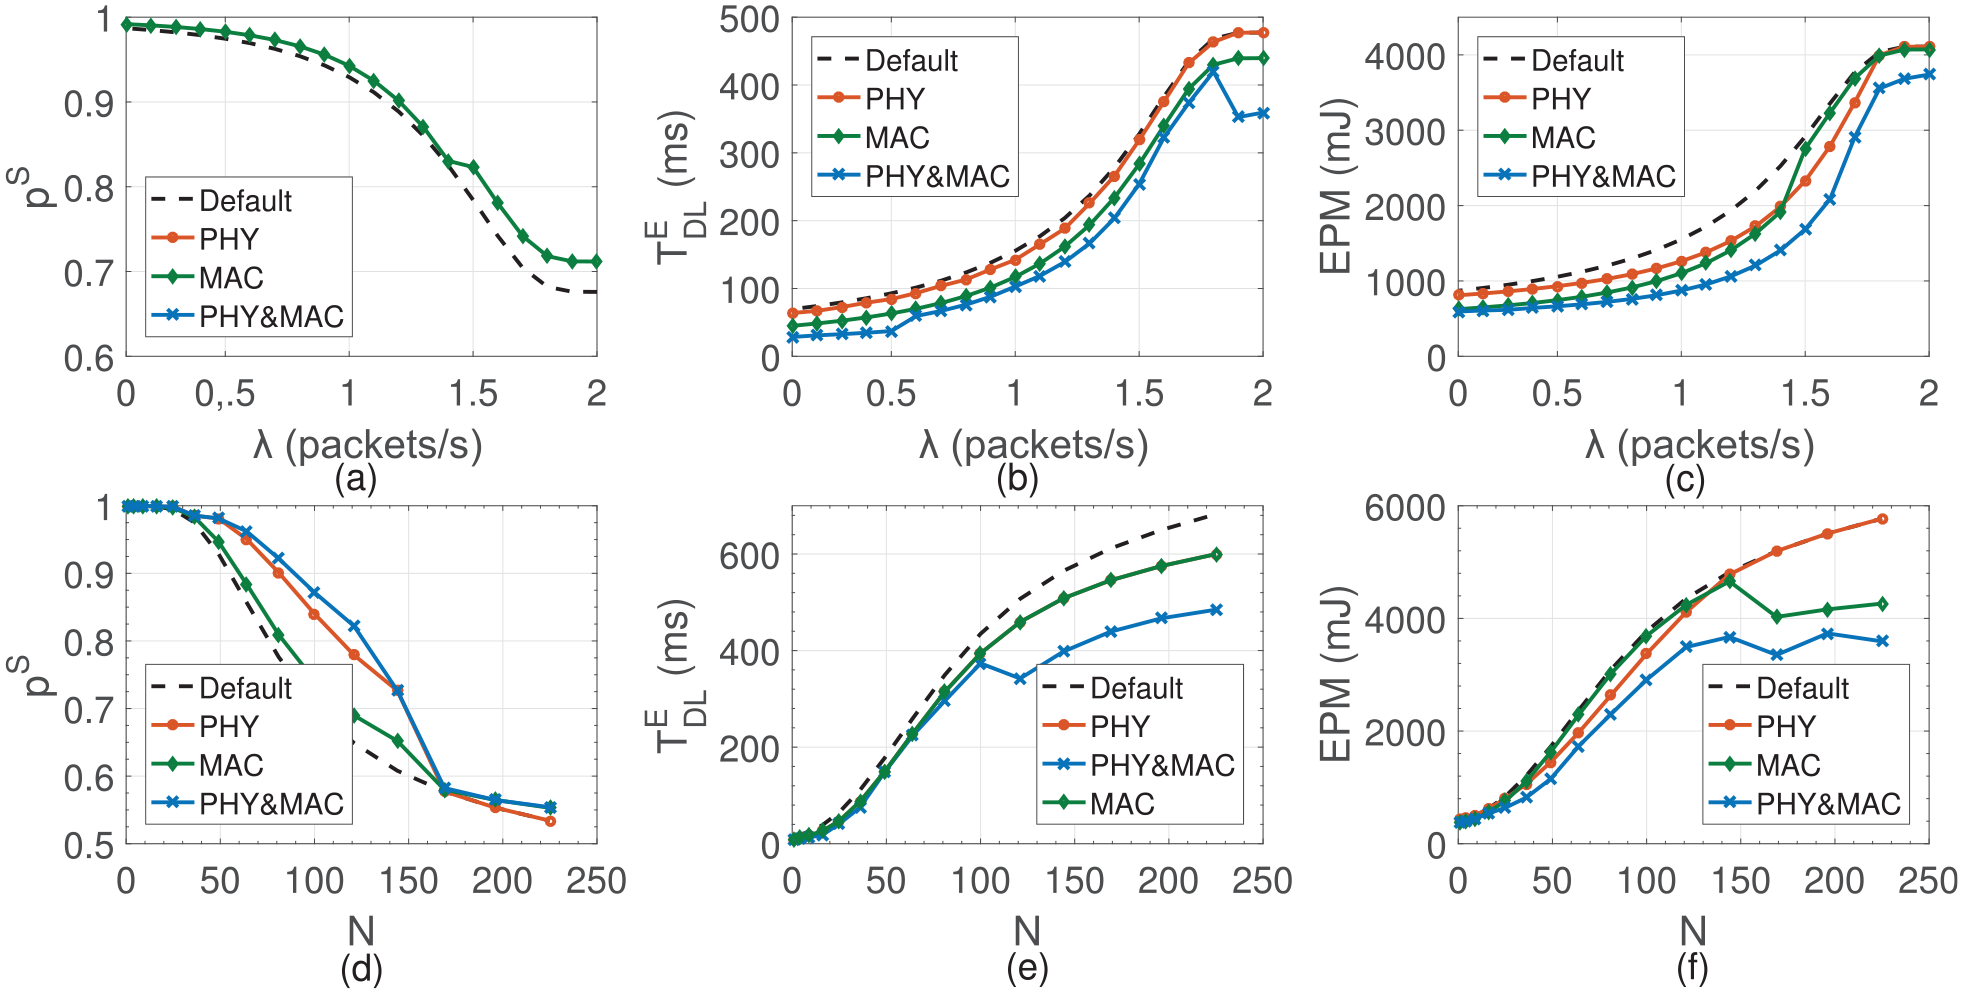
Energy effectiveness comparisons among different optimization methods under different traffic loads and different network scales.
Metering network
Different from general networks, the metering network has stricter requirements on both network reliability and transmission latency. In this part of optimization, we set the constraint of successful packet reception probability
Figure 7 gives a comparison between different optimization methods. With the requirements of successful packet reception probability no less than 90% and transmission latency no more than 500 ms, adequate results are presented in Figure 7 with corresponding energy consumption. By comparing Figure 7(d) with Figure 7(a)–(c), we can find out that with the assistance of joint layer parameter optimization, sensor nodes can meet the requirements of data transport performance but with lower energy consumption than other optimizations. Besides, joint layer parameter optimization enables the best network scalability than other optimizations since it guarantees sensor nodes working in denser networks with heavier traffic loads while still meets the network performance constraints, which is impossible with the assistance of other optimizations.

Comparison between different optimization methods targeting industrial metering networks: (a) default parameter settings, (b) physical layer parameter optimization, (c) MAC layer parameter optimization, and (d) joint layer parameter optimization.
The optimal parameter settings derived by joint layer parameter optimization is shown in Figure 8. Nodes in small-scale networks with low traffic load can send larger packets with lower transmission power, more backoff times, and small backoff exponent. While as the network scale and traffic load increase, nodes should send smaller packets with higher transmission power, fewer backoff times, and large backoff exponent. It should be noticed that although Figure 8(a) indicates the size of data packet can be adjusted widely, it will be affected by the requirement of metering applications, such as the precision of sampling. From Figure 8(c), we can find that the available range of transmission power’s optimal value is limited. However, Figure 8(b) and (d) indicates that both the maximum number of backoffs and minimum backoff exponent can be adjusted within a large range. Therefore, the maximum number of backoffs and the minimum backoff exponent should be adjusted prior to other parameters in metering network optimizations.

Optimal parameter settings with different network scales and traffic loads targeting metering networks: (a) data packet size, (b) maximum number of backoffs, (c) transmission power, and (d) minimum backoff exponent.
Besides, in Figure 8(d), the optimal value of minimum backoff exponent changes with network scale and traffic load, which is different from the result shown in Elshabrawy et al.
7
In networks with the traffic approximates to Poisson’s distribution, prolonging the duration of backoff has a limited contribution to successful packet reception probability. Since one of the basic properties of Poisson’s process is each event is stochastically independent of all the other events in the process.
33
On the contrary, larger value of backoff exponent brings higher average end-to-end delay, which will increase the probability of exceeding the transmission latency constraint
Conclusion
To cope with different application characteristics, both communication link states, which may subject to path loss and interference, as well as the competition for medium access, which becomes inevitable with a large number of devices, should be equally considered. In this article, a joint analytical model considering both the physical layer and the MAC layer was proposed at first. On the physical layer, the model referred to the actual working modes of the TelosB mote Module and formulated the relationship among transmission power level, transmission distance, data packet size, modulation way, and successful handshaking probability. On the MAC layer, based on the approximation of Poisson’s distributed traffic on each channel, a formula to calculate the probability of successful channel access was obtained. Simulation results suggested that the proposed analytical model can precisely estimate networks’ communication performance and energy efficiency of different network scales as well as traffic loads. Then, we compared the effect of adjusting different layer’s parameters on improving networks’ communication performance and energy efficiency. The results showed that adjusting both layers’ parameters can provide better reliability, time efficiency, and energy efficiency than only focusing on a single layer’s parameters. Finally, to fulfill the communication requirement of metering applications, key parameters’ optimal value under different network scales and traffic loads were presented. By comparing the available range of different key parameters’ optimal value, the maximum number of backoffs and the minimum backoff exponent are considered to be more suitable for the optimization of the metering network.
In the following research, several aspects of the proposed model will be improved. First and foremost, the proposed model should be compatible with more kinds of modulation schemes. Based on the improvement, the impact of different modulation schemes on improving the performance of communication should be tested. Second, the key parameters and key features of network layer should be considered. More than physical layer and MAC layer, the impact of routing on the network layer will also be analyzed. Finally, more WSN-based network applications should be analyzed. The analytical model can be modified according to the network scales, traffic patterns, and communication performance requirements of different application scenarios, so as to comprehensively and accurately estimate the communication performance, energy efficiency, and scalability of the network.
Footnotes
Handling Editor: Yanjiao Chen
Author contributions
Y.W. and W.Y. contributed to the conceptualization of this study. Y.W. and W.Y. contributed to the methodology of this study. Y.W. R.H., and T.W. contributed to the software. Y.W., T.W., and H.Z. contributed to the validation. Y.W. contributed to the writing—original draft preparation. R.H., W.Y., and H.Z. contributed to the writing—review and editing. W.Y. contributed to the funding acquisition.
Declaration of conflicting interests
The author(s) declared no potential conflicts of interest with respect to the research, authorship, and/or publication of this article.
Funding
The author(s) disclosed receipt of the following financial support for the research, authorship, and/or publication of this article: This work was supported by the Natural Science Foundation of China under grant (51874299), the National Science and Technology Pillar Program of China (2013BAK06B03), and the Fundamental Research Funds for the Central Universities (2018YJS004).