
Abstract
This article presents a new protection device using aluminum foam to enhance the impact resistance of bridge columns. First, the protection device is designed according to the characteristics of aluminum foam material. The geometric configuration and structure of the device are described. Second, the impact performance of bridge column is analyzed, including impact force analysis, damage analysis, and the influence of axial load. Third, three-dimensional solid element models of columns with and without the protection device are developed in order to verify the effect of the protection device. By comparing dynamic responses of vehicle impact on columns with and without the protection device, it is considered that the protection device has certain protection effect: after installing the protective device, the peak value of impact force reduces by 37.5%, the maximum displacement of column top reduces by 23.7%, the maximum stress at column bottom reduces by 51.6%, the maximum stress at column bottom reduces by 51.6%, the maximum acceleration of the vehicle reduces by 40.6%, and 86.84% of the impact energy is absorbed by the protection device. Finally, the devices with different foam thicknesses and porosities are comparatively analyzed to investigate the influence of these design parameters on impact performance. The results show that the increase in the thickness of aluminum foam has positive effects on the protection capability. The protection capability improves with aluminum foam porosity increasing when the porosity is less than 60%.
Introduction
The accidents of vehicles impacting bridge columns occur frequently. More than 60% of the overpasses bridges in the United States have been hit by vehicles, and there are more than 160 accidents of vehicles hitting the bridge each year. 1 About 50% of the overpasses in Beijing had been hit by vehicles from 2000 to 2006. 2 It can be seen that the collision between vehicle and bridge is a frequent occurrence. The accidents will cause serious consequences such as bridge damage, casualties, and traffic jams. Thus, the need is evident for developing an effective protection device for bridge columns.
A variety of studies have focused on vehicle–bridge collision. The existing research methods include calculation model method, experimental research method, and finite element simulation method. In the research of calculation model, many scholars have proposed calculation model and method for vehicle impacting on bridge columns. On the basis of the test and calculation analysis of the vehicle impacting the column, Fujikake et al. 3 carried out experimental research on reinforced concrete beams. On this basis, a two-degree-of-freedom (2-DOF) mass spring-damper system was proposed to simulate the dynamic response of reinforced concrete beams under impact load. El-Tawil et al. 4 carried out a numerical study of vehicle impact on columns and the results showed that the peak impact force has a linear relationship with the impact velocity. Bouafia et al. 5 proposed a model for monitoring the behavior of non-linear elasticity of concrete in both compression and tension until the break. Those models and theories can help to analyze the collision process of vehicles impacting on columns and monitor the behavior of nonlinear elasticity of concrete in both compression and tension until the break. In addition, the experimental research can help to analyze the dynamic response of the vehicle impacting the column in more detail and intuitively. In terms of experimental research, Lia et al.6,7 presented experimental works for investigating the collision process, damage and failure mode, dynamic behavior, and impact resistance evaluation method of reinforced concrete (RC) columns under lateral impact loading. The experimental research can get the result which is more consistent with the actual engineering, but it is expensive and difficult to carry out. Compared with experimental research, finite element simulation has the advantages of low cost and easy to carry out. Zhang et al. 8 used the research method of combination of finite element simulation and test to study the dynamic response of columns. Xiao et al.9,10 introduced a new method for the dynamic monitoring of a bridge using fiber Bragg grating (FBG) tiltmeters. Thilakarathna and colleagues11–15 used the finite element analysis method to study the whole process of vehicle impacting the column. Xu et al. 12 established the scale model and finite element model of truck impacting on bridge superstructure. The results obtained by scale model test and element model simulation were compared, and it showed that the main failure mode for the steel plate and RC T-beam girders, while global failure is found to be the main failure mode for the steel box girder bridge model. Cai et al. 13 used the finite element method to study the influence of impact weight and impact velocity on the dynamic response and failure mechanism of reinforced concrete columns. Sharma et al. 14 proposed a frame model to estimate the shear capacity of bridge columns under vehicle impact based on finite element analysis. Based on the finite element analysis, Gholipour et al. 15 studied the damage behavior and nonlinear failure mode of the bridge column under ship impact. The results showed that the model used in this article can effectively estimate the dynamic response of column under impact. Three different damage indices were proposed to classify the damage grade of bridge columns, and an effective damage index method is determined.
On the research of protection device of bridge column, aluminum foam is a functional material with unique structure and excellent properties. It has been increasingly applied and has extensive prospect. It is made by adding additives into pure aluminum or aluminum alloy. 16 The porous structure of aluminum foam enables it to absorb a lot of compressive energy by its elastic–plastic deformation when subjected to compressive load. By quasi-static test, Wu et al. 16 studied the effect of aluminum foam density on energy absorption. The results showed that the energy absorption capacity of aluminum foam increases with the increase in density at low stress level. Wang et al. 17 designed a composite sandwich protection device using aluminum foam to reduce the impact of debris flow on the column. The static ballast test was used to analyze the results. The results showed that the double-layer aluminum foam sandwich structure without vertical steel plate is the optimal structural form. Li et al. 18 studied the crushing behavior of aluminum foam carbon fiber composite pipe under transverse loading by quasi-static compression test. Through experiments and numerical simulations, the interaction between aluminum foam and aluminum carbon fiber composite pipes was discussed. Li et al. 19 designed an aluminum foam sandwich panel with double V-shaped face plate as a protection device in explosion. The performance of the device was explored based on the finite element simulation. Therefore, aluminum foam becomes an energy absorbing material with great potential. It has broad application prospects in engineering structure protection. However, the dynamic responses of columns with aluminum foam protection device need further study.
Based on the model test of the existing vehicle impact on the column, this article establishes a three-dimensional solid element model of reinforced concrete column with aluminum foam protection device. The dynamic response of the column under the vehicle impact is analyzed. In order to protect the column and vehicle, the protection device is proposed. The aluminum foam protection device is supposed to reduce the impact force and displacement of the column, and absorb the energy during the collision process between vehicle and column. By comparing the time history responses of impact force, displacement, stress, and acceleration with or without the protection device, the dynamic response of each object in the impact system is analyzed quantitatively. After comparing the dynamic responses, the effect of protection device is evaluated. On this basis, the influence of the thickness of the protection device on the effect is analyzed.
Model establishment and validation
Analysis model
In the study of the collision between vehicles and columns, researchers often use the scale model to carry out the experimental study of the collision problem. Based on the reinforced concrete column of a real bridge, Zhong 20 designed and manufactured a column model with a scale ratio of 1:5, and proposed a horizontal collision model between vehicle and column. The time history curves of the impact force and displacement of the column are obtained. Based on the test, the finite element model of vehicle impact column is established in this article, and the anti-collision performance of the column with aluminum foam protection device is analyzed.
The column model is obtained from structural plans of existing bridges. The column is a reinforced concrete cylinder column that has a 340-mm diameter cross section and is 2000 mm high. The column is reinforced with 10 HRB335 bars (14 mm diameter) and R235 (14 mm diameter) round hoops. Yield strength of steel is taken as 400 MPa.
The influence of vehicle deformation on the collision process is ignored in reference test. According to the size of the column model, a rigid mass of 1.3 m × 0.6 m × 0.2 m in length, width, and height is used to simulate the impact vehicle. According to the general code AASHTO, 21 the limit value of vehicle impact force is 1800 kN and the height of impact point should be taken as 1.2 m above-ground. Because this article establishes a scaled model (which scale ratio is 1:5), the height of impact point should be adjusted. According to scale ratio, the height of impact point is adjusted to 0.24 m. The velocity of vehicle is set as 2.5 m/s and the mass of vehicle is 1.2 t.
The proposed aluminum foam protection device is a hollow cylinder. The aluminum foam protection device is set around the column. In practical engineering, the relevant code 21 stipulates that the impact height is 1.2 m above the ground. In this test, a 1:5 scale model is used, and the height of the vehicle impact point is taken as 0.24 m. The height of the protection device should be higher than the impact point of the vehicle, so the height of the protection device is taken as 0.5 m in this model. The thickness of aluminum foam protection device is taken as 200 mm. The position of protection device on the column is shown in Figure 1.

Diagram of the protection device.
Model establishment
In this article, solid elements are used to represent the column, vehicle, and aluminum foam protection device. Link elements are used to model the reinforcement bars.
The concrete material model adopts Johnson Holmquist Concrete (JHC) model.22,23 In 1993, Holmquist and Johnson 22 proposed the JHC damage constitutive model to describe the nonlinear deformation and fracture characteristics of concrete. The model can well simulate the mechanical behavior of concrete under large strain, high strain rate, and high confining pressure. JHC model includes yield surface equation, damage evolution equation, and state equation. The yield surface equation of JHC model is as follows

where
The damage accumulation of materials is expressed by damage degree D (0 ≤ D ≤ 1.0). The effects of equivalent plastic strain, plastic volume strain, and hydrostatic pressure are considered. The damage evolution equation is expressed as

where

where
The relationship between concrete pressure and strain in HJC model is described by piecewise state equation. In the elastic stage, the relationship between hydrostatic volume pressure and volumetric strain is linear. In the plastic deformation transition stage, the cavity in the concrete material is gradually compressed, and the concrete structure is damaged, resulting in plastic deformation. In the later stages, the concrete is completely crushed. In the process of compression, the internal pores of concrete are constantly destroyed and collapsed, which leads to the loss of cohesive strength. Therefore, in most cases, the damage of concrete is mainly caused by plastic volume strain. The parameters in HJC model can be calculated according to the formula provided in the literature. 24
The reinforcement bars are simulated by the plastic follow-up strengthening model. In LS-DYNA calculation, it is allowed to define the relatively rigid part of the model as a rigid body. Since the deformation of the vehicle during the collision process is not considered, rigid body is used as material models for the vehicle.
Tables 1–3 show, respectively, the material parameters of concrete reinforcement bars and vehicle.
Concrete’s material parameters.

Reinforcement bars’ material parameters.
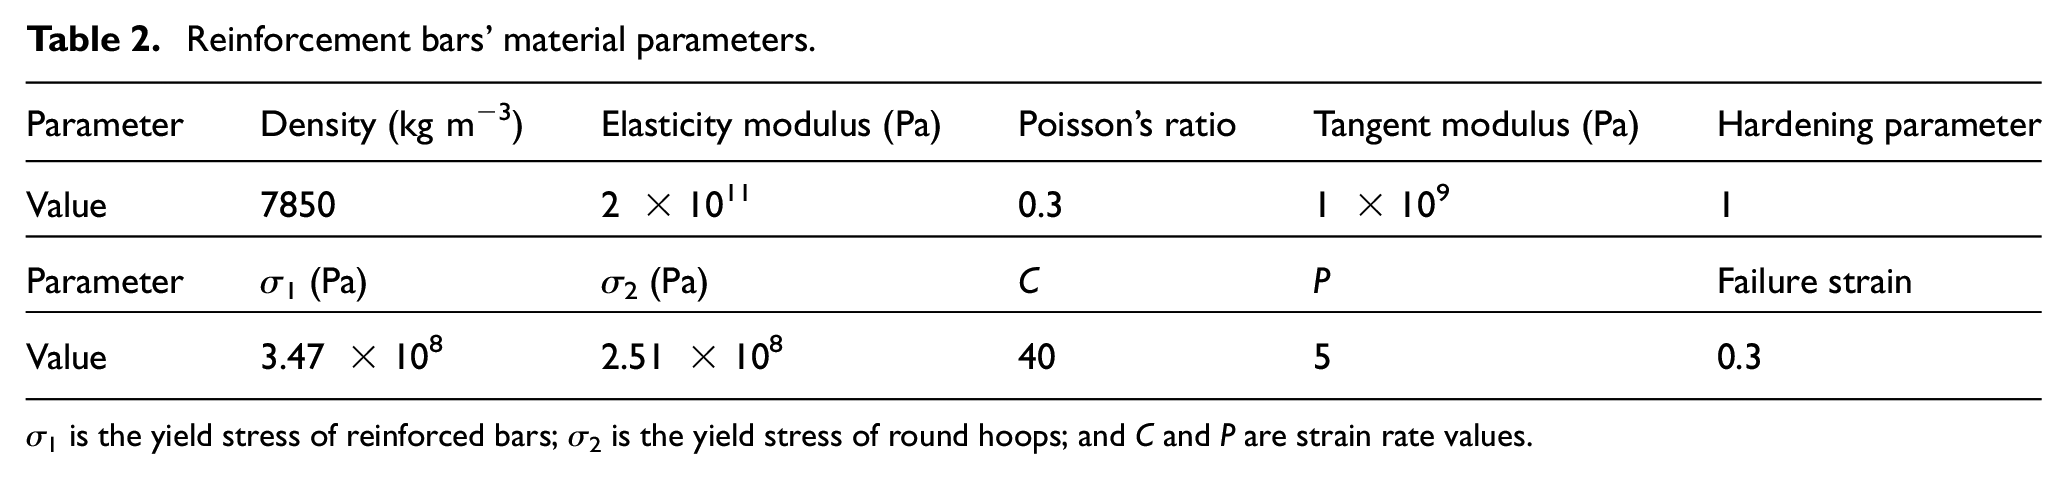
σ 1 is the yield stress of reinforced bars; σ2 is the yield stress of round hoops; and C and P are strain rate values.
Vehicle’s material parameters.

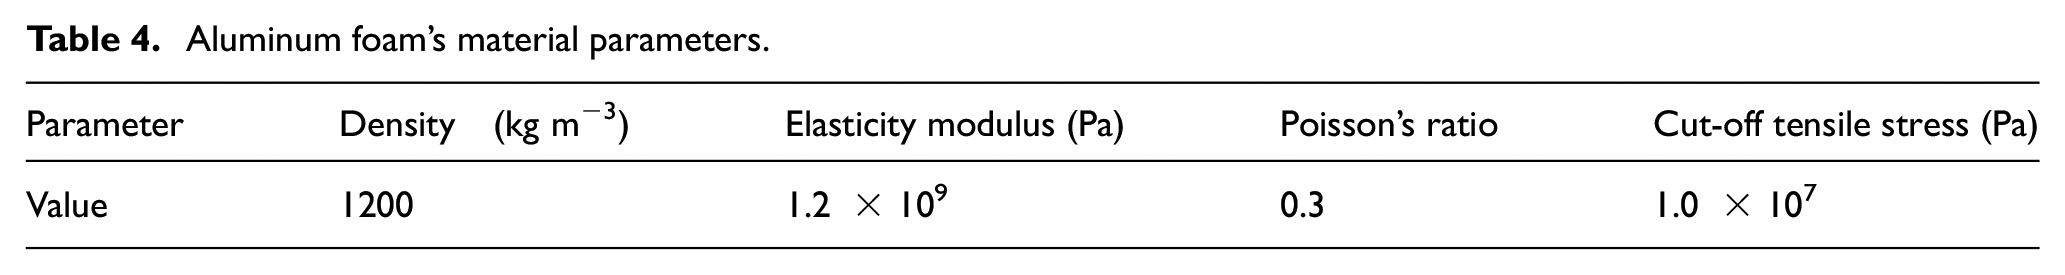
Wang et al. 25 described the material parameters of aluminum foam in detail in the experiment of aluminum foam. In this article, the same parameters were used to model the foam aluminum. The porosity of aluminum foam is 55%. The aluminum foam is modeled using MAT063 (compressible foam) constitutive model. This material model needs to input stress–strain relationship of aluminum foam. Figure 2 shows the aluminum foam’s stress–strain relationship. Table 4 shows the parameters of aluminum foam.

Stress–strain relationship of aluminum foam.
Aluminum foam’s material parameters.
Due to the regular geometry of the model in this article, the mapping partition method is adopted in the finite element modeling, and the hexahedral shape grid is selected to mesh the model by controlling the mesh size. The mesh size of column is 20 mm; the mesh size of longitudinal reinforcement and stirrup is 20 mm; the mesh size of rigid trolley is 30 mm. There are 23,920 column concrete units, 800 longitudinal reinforcement units, 1794 stirrup units, 5400 vehicle units, and 6160 protection device units. Figure 3 shows the proposed finite element model.

Finite element model.
For the column model, the bottom surface of the column is selected as the constraint surface. The fixed end constraint is adopted at the column bottom, that is, the freedom in six directions is constrained. The top surface of the column is selected as the loading surface, and the axial load is 250 kN (the axial compression ratio is 0.08). The axial displacement of column top is limited. For the vehicle model, only the displacement and rotation of the vehicle on the running surface is allowed, and the rotation and displacement outside the surface is limited.
This article mainly defines the contact between the vehicle and column, steel bar and column. The keyword file * CONTACT INTERFACE is edited in LS-DYNA preprocessing: The automatic face-to-face contact type of ASTS is selected to define the contact. The vehicle, longitudinal reinforcement and stirrup are taken as the contact surface components, and the concrete is taken as the contact target surface component. The static friction coefficient is taken as 0.3, 20 and values for other parameters are taken as the default. In addition, since the separate modeling is adopted to simulate reinforcement and concrete, the reinforcement and concrete should work together by sharing nodes, that is, LAGRANGE IN SOLID needs to be defined in K file * constrained interface.
Model validation
The finite element simulation model based on the existing scale test needs to be verified. The finite element model which is identical with the reference test condition is established to verify the column model in this article. The impact force time history and column displacement time history can be obtained by finite element calculation. The calculation results of this article have been compared with the existing data. 20
Figure 4 shows the impact force comparison between the test results of the existing scale test and this article. The time history curve of impact force in this article has the same trend as the existing data. The peak value of the impact force calculated in this article is 32.5 kN, which is 7.14% error compared with the result of 35.0 kN in the existing test. The calculation result is similar.
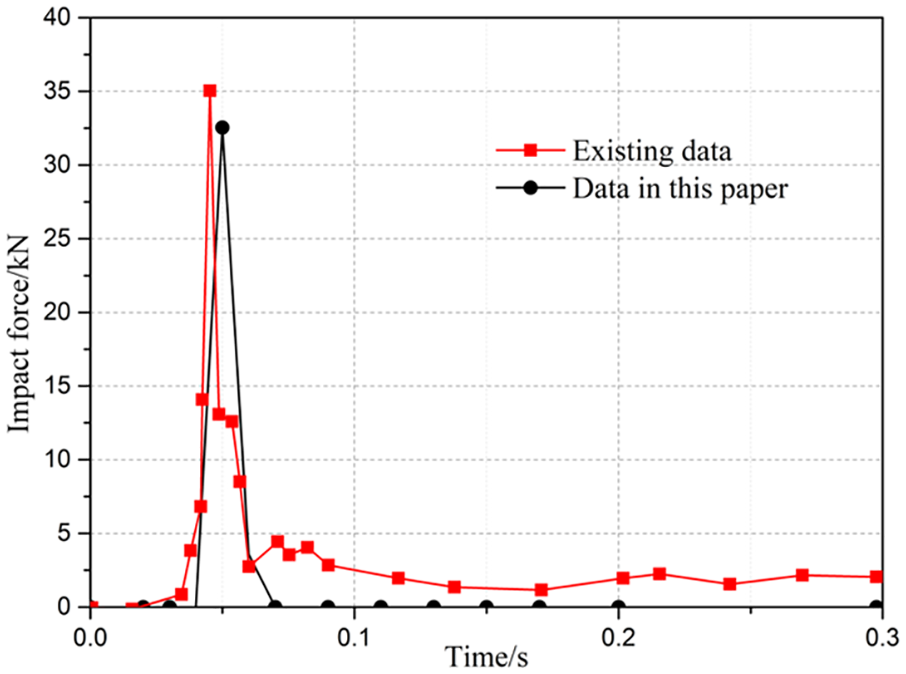
Impact force–time curves.
Figure 5 shows the comparison of column displacement between existing data and data in this article. The data in this article are similar to the existing data from the perspective of time curves of column displacement. Among the time history curves, the maximum displacement of the column top obtained from the reference test is 22.3 mm, and the result calculated by the finite element model in this article is 21.2 mm, with an error of 4.93%. The maximum displacement of the column impact point obtained from the reference test is 14.0 mm, and the result calculated by the finite element model in this article is 13.1 mm, with an error of 6.43%. The simulation analysis results have been compared with existing data, which illustrate that the column model used in this article is correct and applicable to engineering.
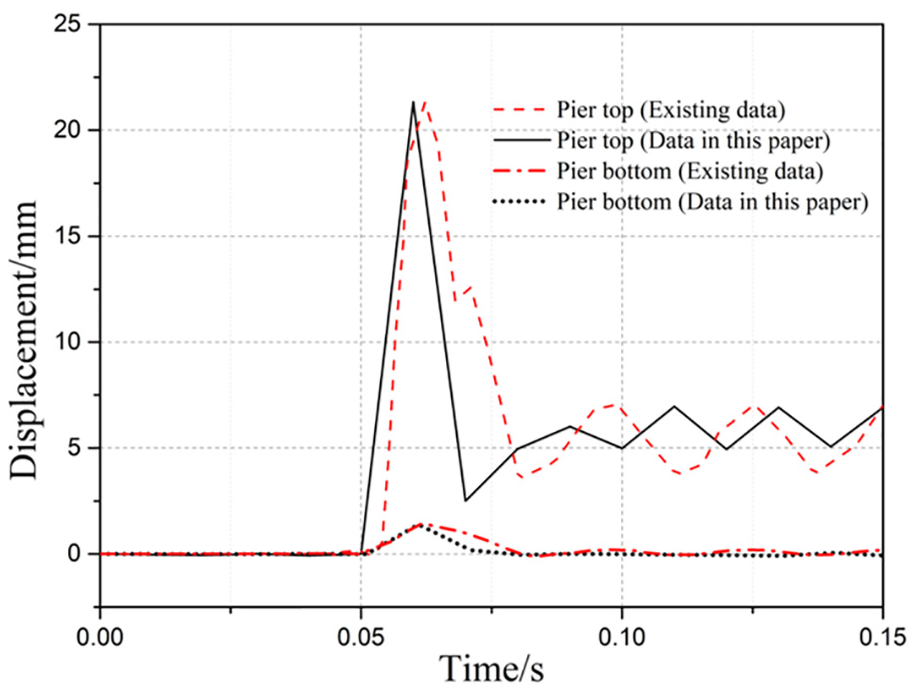
Displacement–time curves.
Impact performance analysis
Based on the finite element analysis, this section studies the impact process of vehicles on the column. By analyzing the time history curve of the impact force, the dynamic response of the column during the impact process is studied. The damage analysis of bridge column is carried out. The influence of axial load on the impact force is also discussed.
Impact force analysis
The time history of impact force is an important design parameter of anti-collision design. In the actual impact process, the impact force time history curve is complex. In order to study the influence of various factors on the impact force time history, the impact force time history curve is simplified in this section. Through the analysis of the key indicators (peak value of impact force, platform value of impact force, impact duration, and impact impulse), it provides reference for further research on simplifying the impact force time history curve.
The time history curve of impact force can be divided into three stages—(1) Oscillation stage: when the vehicle contacts with the cylinder at zero time, the impact force reaches the peak value rapidly and then decays rapidly, and the impact force time history presents a triangular pulse; (2) Stable stage: after the initial oscillation, the impact force is stable near a fixed value, forming a rectangular pulse, which lasts for a long time. The impact force mainly works at this stage; (3) Attenuation stage: the impact force begins to decay after the stable stage, and finally the impact force decreases to zero. In this article, the time history curves of the last two stages of impact force are simplified as rectangles. Each stage is shown in Figure 6.

Original and simplified time history curves of impact force.
The duration of the triangle pulse is taken as t1. The moment when the final impact force decreases to zero is taken as t2. The relationship between impact impulse I, impact force F, and impact time t is shown in equation (4)

where Itri is the triangular impulse in oscillation stage

where Ft is the peak impact force in oscillation stage. The total impact impulse Itotal is

where Irec is the total impulse in stable stage and attenuation stage

The average impact force Fa of the simplified rectangular pulse is

Therefore, the impulse time history I(t) of the initial stage mainly depends on the peak value of the impact force Ft during the whole impact process. After that, the impact impulse time history I(t) mainly depends on the average impact force value Fa.
Damage analysis
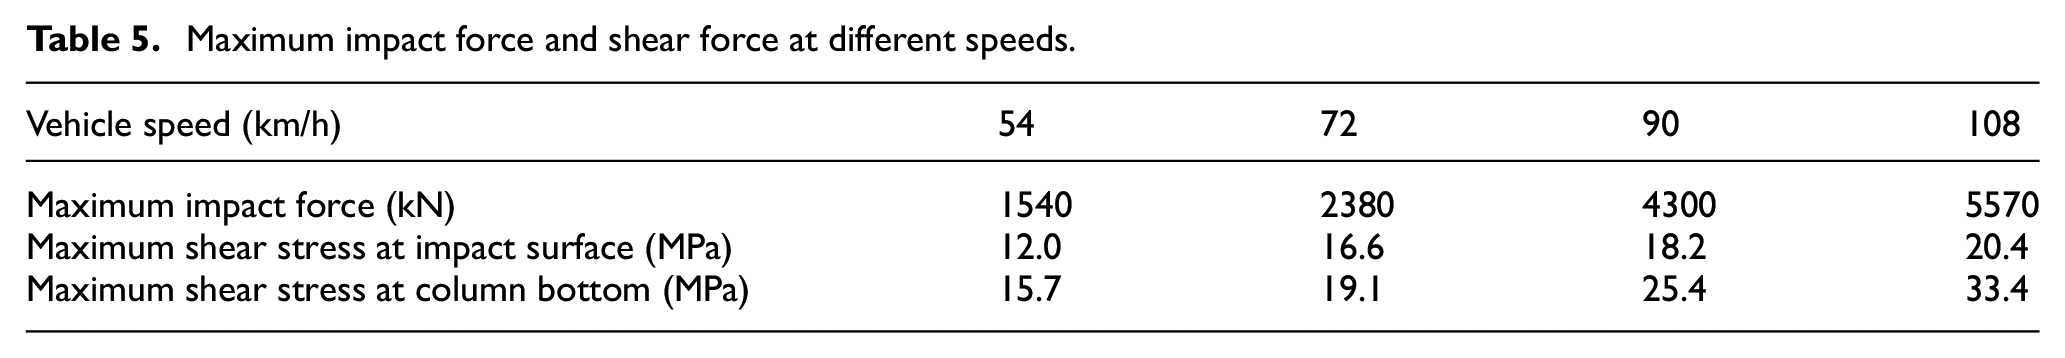
In order to study the failure mode of bridge columns under impact, the full-scale model of bridge column is established by using the method verified in this article. The impact of different speeds on the column is simulated. In the full-scale column model, the section size is 800 mm × 800 mm and the height of the column is 4200 mm. The vehicle speed is 54, 72, 90, and 108 km/h, respectively. The finite element modeling and calculation are carried out using the method in section “Model establishment.” The maximum impact force and shear force at different speeds are shown in Table 5. The stress of column is extracted from each calculation model, and the failure mode of column at different speed is analyzed. The failure patterns are shown in Figure 7.
Maximum impact force and shear force at different speeds.

Failure types of columns.
When the vehicle impacts the bridge column, the impact impulse is mainly absorbed by the local deformation of the impact point. As the impact process continues, the overall deformation of the column occurs, and the large concentrated rotation deformation occurs at the support of the column. At this time, the deformation of the column develops, the deflection of the impact point increases, and the column absorbs a large amount of impact impulse through the overall deformation. In the process of vehicle impacting columns, the following three types of typical failure often occur: local damage type, overall failure type, and local failure type. The local damage type means deformation and damage around the impact area of the column, while the other parts of the column are still in the elastic stage. The main failure mode of local damage type is local concrete compression in the collision area and crushing of concrete in the compression area. Local damage type mainly occurs when the impact time is short and the impact energy is small. The overall failure mode means the overall deformation of the column, accompanied by the local deformation of the impact area. The main failure mode of overall failure type is the local damage in the impact area and the bending failure at bearings. This kind of failure mainly occurs when the impact duration is long and the impact energy is large. The local failure mode means the punching shear failure in the impact area of the column, and the overall deformation of the column is not large. This kind of damage mainly occurs when the impact duration is short and the impact energy is very large. Due to the local punching shear failure of the column in a short time, the overall bending deformation of the column has not yet developed.
It can be seen from Figure 7 that when the vehicle speed is 54 km/h, the column deformation is mainly local deformation, and the failure type is local damage. When the speed is 72 km/h, the failure type is the same as that of 54 km/h. When the speed is 90 km/h, the failure type is still local damage. The local damage of the column is more obvious. The cover concrete is all failure and spalling, and the reinforcement is exposed. When the speed is 108 km/h, the failure type is local failure. As the impact energy is very large, the concrete in the impact area is seriously damaged, but the overall deformation of the column is not obvious.
Influence of axial load
According to the literature,26,27 the axial loads arising from the mass of superstructure can significantly affect the dynamic responses of bridge columns. In this section, the model from section “Damage analysis” is used to study the influence of axial load on impact force. The impact speed of the vehicle is 90 km/h. The axial compression ratio of column is 0.1, 0.3, 0.5, and 0.8, respectively. The finite element simulation results are shown in Figure 8.
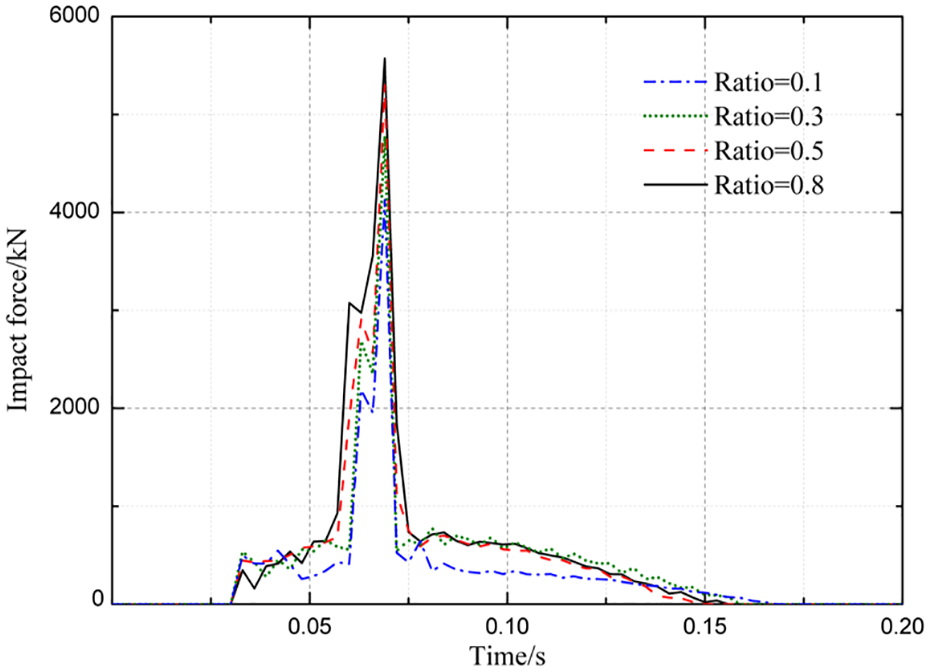
Impact forces at different axial compression ratios.
It can be seen from Figure 8 that the increase in axial load will lead to the increase in peak impact force. The peak values of impact force at different axial compression ratios are shown in Table 6.
Peak impact forces at different axial compression ratios.

Validation of protection device effect
Based on the finite element model in Section “Model establishment” is, the dynamic responses of bridge columns with and without protection device are investigated to evaluate the effectiveness of the device. Those dynamic responses are included in present discussion: impact force, displacement, stress, energy conversion, and vehicle acceleration.
Figure 9 shows the impact force time–history curve under two working conditions. The duration of impact force is about 0.03 s. In the absence of protection devices, the peak impact force is 33.1 kN. When the protection device is installed on the column, the peak value of the impact force is 20.7 kN, which reduces by 37.5%. This indicates that the aluminum foam protection device can help reducing impact force.

Impact force–time curves.
The displacement of the column can also directly reflect the vibration of the column. Figure 10 shows the time history curves of displacement at column top under two working conditions. Figure 11 shows the time history curves of displacement at impact area. Without the protection device, the maximum displacement is 3.75 mm at column top and is 8.78 mm at impact area. With the protection device, the maximum displacement is 2.35 mm at column top, which reduces by 37.3%; and it is 4.98 mm at impact area, which reduces by 43.3%. When the protection device is installed, the displacement of the column top during the impact is also significantly reduced.

Displacement–time curves (column top).

Displacement–time curves (impact area).
During the impact, the stress level of the column is related to the damage and effectiveness of the column. Figure 12(a) is the stress nephogram of column without the protection device; Figure 12(b) is the stress nephogram of column with the protection device. The impact area has the largest stress of the whole column under both working conditions. The difference is that without the protection device, the concrete at impact area failed; with the protection device, the concrete at the impact point was effectively protected and did not fail. Meanwhile, the stress at the bottom of the column is also significant. This is due to the fact that the bottom of the column receives large shear and bending moments during the impact.

Stress nephogram: (a) without protection device and (b) with protection device.
Figure 13 shows the stress curve of the impact point under two working conditions and Figure 14 shows the stress curve of the bottom of the column under two working conditions. In the absence of protective devices, the maximum stress at impact area is 78.7 MPa; the maximum stresses at the column bottom is 25.0 MPa. With the protection device, the maximum stress at impact area is 48.9 MPa; the maximum stress at the column bottom is 12.1 MPa.

Stress–time curves (impact area).

Stress–time curve (column bottom).
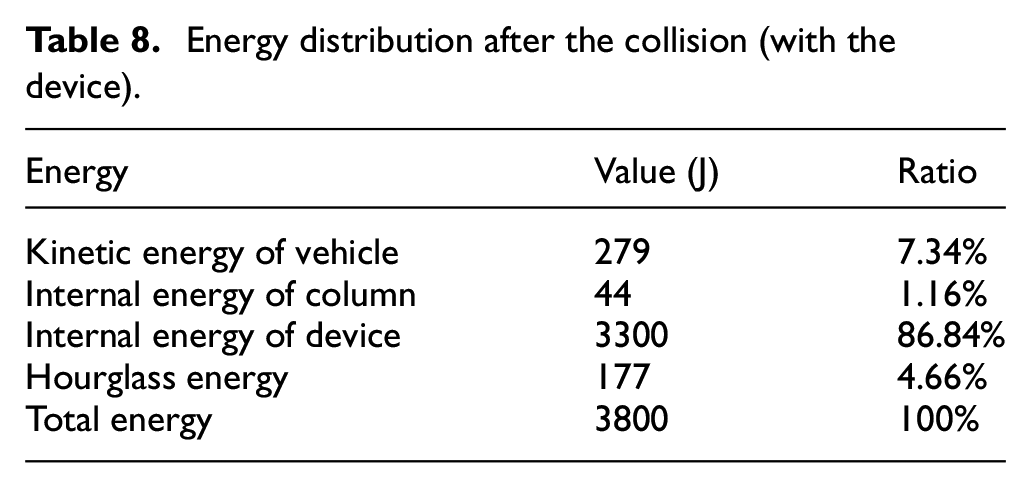
According to the law of conservation of energy, the kinetic energy of the vehicle will be converted into the following energy: the elastoplastic deformation energy of the vehicle, the elastoplastic deformation energy and kinetic energy of the anti-collision device and the bridge, and the heat energy loss caused by the friction between the components. The elastoplastic deformation of vehicle is not considered in this article. Without the protection device, the kinetic energy loss of the vehicle is mainly converted into the internal energy of the column. After the protection device is installed, the kinetic energy of the vehicle is mainly absorbed by the protection device. Tables 7 and 8 show the energy distributions after the collision under different working conditions.
Energy distribution after the collision (without the device).

Energy distribution after the collision (with the device).
The acceleration of the vehicle can intuitively reflect the movement of the vehicle. Figure 15 shows the time–history curve of the vehicle’s acceleration response. The vehicle’s acceleration curve coincides with the impact force curve. Without the protection device, the maximum acceleration of the vehicle is 132.3 m/s2. With the protection device, the maximum acceleration of the vehicle is 78.6 m/s 2 , which is reduced by 40.6%. The protection device is also effective in reducing vehicle acceleration.

Acceleration–time curves of vehicle.
Influence of design parameters
From the above analysis, the aluminum foam protection device has been proved having a certain protective effect on the column impacted by the vehicle. The following is a parametric analysis of the thickness and porosity of the aluminum foam. Suggestions are made for the thickness and porosity setting of the device after the analysis.
The thickness of the protection device has a great influence on the protection effect. Therefore, parameter analysis of protection device thickness has been carried out. In section “Model establishment,” the finite element model of 340 mm diameter cylindrical reinforced concrete column is established. In order to make the test results more accurate, the square section reinforced concrete column with 340 mm × 340 mm section is added as the control group. In the control group, except for the section form, other parameters such as concrete grade, reinforcement ratio, and stirrup ratio are consistent with the cylindrical column in section “Model establishment.” The impact vehicle parameters are the same as the model in section “Model establishment,” and the impact speed is 2.5 m/s. The thickness of the aluminum foam protection device is set as 50, 100, 150, 200, 250, and 300 mm, respectively. The dynamic response of different columns with different aluminum foam thickness is calculated to carry out the parameter analysis.
However, the porosity of aluminum foam will also affect the protection device’s effect. According to the different porosity, foam metal materials can be generally divided into three types: low porosity (<10%) foam metal material, high porosity (>70%) foam metal material, and foam metal material with porosity between 10% and 70%. A large number of studies have shown that higher porosity will make the structure lighter and more rigid, but it will also cause the overall bearing capacity of the structure to be low. Low porosity will reduce the energy absorption capacity of the material.28–30 A control group experiment is conducted to investigate the influence of porosity of aluminum foam on the collision avoidance of protection devices. Similar to aluminum foam thickness analysis, finite element model mentioned in section “Model establishment” is used and the square section column is the control group. The porosity of the aluminum foam is set as 10%, 20%, 30%, 40%, 50%, 60%, and 70%. The dynamic response of different columns with different aluminum foam porosities is calculated.
Influence of thickness of aluminum foam
Through the finite element calculation, the peak value of impact force and the maximum displacement of column top under different thicknesses of protection device are obtained. The calculation results are shown in Figures 16 and 17.

Peak value of impact force under different thicknesses.

Maximum displacement of column top under different thicknesses.
It can be seen from Figure 16 that with the increase in the thickness of the protection device, the peak value of the impact force decreases significantly: when the thickness of the protection device is less than 50 mm, the effect on the decrease in the peak value of the impact force is not obvious. But when the thickness of the protection device reaches 300 mm, compared with when there is no protection device, the peak value of impact force of cylinder section column is reduced by 49.5%, and that of square section column is reduced by 50.3%. The anti-collision effect is significant. Figure 17 illustrates that the protection device also plays a significant role in reducing the displacement of column top: compared with when there is no protection device, when the thickness of protection device reaches 300 mm, the maximum value of column top displacement in cylinder column is reduced by 34.0%, and that in square section column is reduced by 33.0%. From the above analysis, we can see that the protection performance of protection device becomes stronger with the increase in its thickness. However, in engineering practice, it is necessary to consider that the protection device cannot affect the carriageway and its economic applicability. Thus, the protection device should not be too thick. When the thickness of protection device is 150 to 200 mm, the protection device can reduce the peak impact force by 25%–40%, and the maximum displacement of column top by 15%–25%. Therefore, under the conditions set in this article, it is suggested that the thickness of protection device should be 150 to 200 mm. In this way, the bridge column can be effectively protected without affecting the traffic.
Influence of porosity of aluminum foam
The peak value of impact force and the maximum displacement of column top under different porosities of aluminum foam are obtained. The calculation results are shown in Figures 18 and 19.

Peak value of impact force under different porosities.
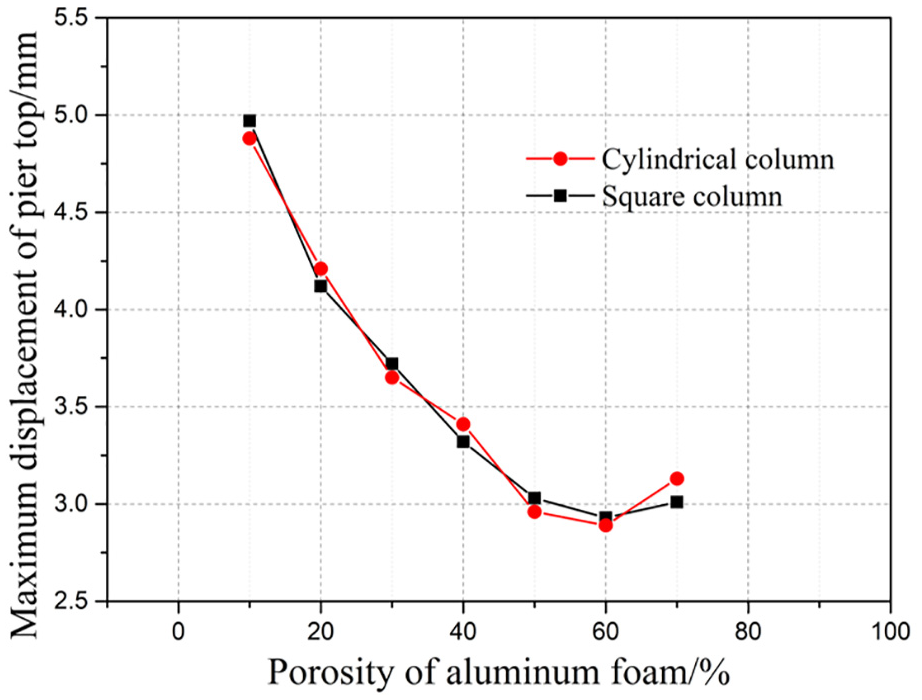
Maximum displacement of column top under different porosities.
When the porosity is less than 60%, the impact force and column top displacement decrease with the increase in porosity. Low porosity is not conducive to the protection effect of protection device. When the porosity is 60%, the device has the best anti-collision effect. The peak value of impact force of cylinder section column is reduced by 45.7%, and that of square section column is reduced by 40.0%. The maximum displacement of column top in cylinder section column is reduced by 26.8%, and that in square section column is reduced by 24.0%. However, when the porosity is more than 60%, the impact force and column top displacement increase with the increase in porosity. Thus, the porosity of the aluminum can be taken as 60% to get the best anti-collision performance. It should be pointed out that this design parameter proposal is based on the working condition of this article and has certain limitations. Its further quantitative analysis needs a lot of tests to verify.
Conclusion
Through the numerical research on impact performance of bridge columns with aluminum foam protection device and the parameter analysis of the proposed device, the conclusions are as follows:
The installation of protective devices can effectively reduce the direct damage of vehicles to bridge columns. During the collision, the protection device can greatly reduce the peak force, displacement, and stress. The protection device can also absorb most of the energy.
After the protection device being installed, the protection device prolongs the collision time, which significantly reduces the acceleration of the vehicle. The protection device can also protect vehicles while protecting columns.
The thickness and porosity of the aluminum foam have obvious influence on the effect of the protection device. It is found that the increase in the thickness of aluminum foam has positive effects on the protection capability. The effect of protection device gets better with the increase in the porosity when the porosity of aluminum is less than 60%; when the porosity is more than 60%, the increase in the porosity has negative effects.
Footnotes
Handling Editor: Francesc Pozo
Declaration of conflicting interests
The author(s) declared no potential conflicts of interest with respect to the research, authorship, and/or publication of this article.
Funding
The author(s) disclosed receipt of the following financial support for the research, authorship, and/or publication of this article: This work was supported by the Fundamental Research Funds for the Central Universities of China (grant no. 30920021154), the “Six-Talent Peaks” Project of Jiangsu Province (grant no. 2019-JZ-013), and the Nanjing University of Science and Technology, Start-up (grant no. AE89991).