
Abstract
Network security situational assessment, the core task of network security situational awareness, can obtain security situation by comprehensively analyzing various factors that affect network status. Thus, network security situational assessment can provide accurate security state evaluation and security trend prediction for users. Although plenty of network security situational assessment methods have been proposed, there are still many problems to solve. First, because of high dimensionality of input data, computational complexity in model construction could be very high. Moreover, most of the existing schemes trade computational overhead for accuracy. Second, due to the lack of centralized standard, the weights of indicators are usually determined empirically or by subjective opinions of domain expert. To solve the above problems, we propose a novel network security situation assessment method based on stack autoencoding network and back propagation neural network. In stack autoencoding network and back propagation neural network, to reduce the data storage overhead and improve computational efficiency, we use stack autoencoding network to reduce the dimensions of the indicator data. And the low-dimensional data output by hidden layer of stack autoencoding network will be the input data of the error back propagation neural network. Then, the back propagation neural network algorithm is adopted to perform network security situation assessment. Finally, extensive experiments are conducted to verify the effectiveness of the proposed method.
Keywords
Introduction
With the prevalence of big data, the amount of services provided by Internet witnesses an explosive growth. 1 This is due to the extension of Internet application and the integration of various fields, such as national defense, military, and public transportation. However, network security incidents occur frequently and the techniques used in network attacks become more and more complex. As a result, how to accurately and effectively evaluate security status has become a hot research topic in the field of network security, which is related to the stability and security of network operation. 2 Therefore, it is necessary to adopt holistic approach to effectively deal with situational awareness data. Thus, network security situational awareness (NSSA) emerges. 3 NSSA 4 was first proposed by T bass, provides decision-makers with knowledge of the most critical assets, threats, and related vulnerabilities, and effective countermeasures and risk mitigation technologies to correctly and timely response to threats. 5
Network security situation assessment is the core of NSSA technology, which can comprehensively analyze all kinds of uncontrollable security factors and provide information about current network security situation. When network threats come in, proactive defense measures are taken to ensure timely protection of network security. Network security situation assessment determines the performance of techniques for NSSA, and it is of great importance to comprehensively understand the state of network environment, the ability to detect network security, and handle network threat events.
Network security situation assessment is a crucial part of network security, and it is an useful technique to understand the status and performance of network, which is important to the management of networks. Network security situation assessment has been applied to many fields, such as electric power information network, 6 naval systems, 7 aviation cyber security, 8 and vehicle network. 9
Existing network security situation assessment methods can be summarized into the following categories, that is, methods based on mathematical model (MM), approaches based on knowledge reasoning (KR), and methods based on pattern recognition (PR). 10 As a PR-based method, back propagation neural network (BPNN) has a certain flexible network structure and a strong non-linear mapping ability. According to the specific situation, the number of intermediate layers and the number of neurons in each layer can be arbitrarily set. However, existing NSSA data exhibit characteristics, such as complex structure, multi-source, and massive. As a result, high dimensionality of input data will lead to high complexity of model construction, huge CPU costs in model training, slow training speed, and numerous parameters, which will ultimately affect the efficiency of the method. Therefore, it is necessary to perform data dimensionality reduction to avoid curse of dimensionality, improve computational efficiency, and reduce probability of overfitting.
The main contributions of this article are summarized as follows:
Stack autoencoding network (SAE) is used to reduce the dimensionality of non-linear data and the complexity of model construction before performing security situation assessment;
Loss function is used to determine the number of self-coding network layers to ensure information integrity of the data;
BPNN is adopted to perform network security situation assessment, and contextual relevance of network security is fully taken into consideration.
The remainder of this article is organized as follows. In section “Related work,” we review the related work, and give some preliminaries in section “Preliminaries.” Then, we propose the network security situation assessment method based on SAE + BPNN in section “Proposed model.” In section “Experimental study,” we briefly introduce the experimental environment and data we used, and the experimental results are analyzed in detail. Finally, we conclude the article in section “Conclusion.”
Related work
The network security situation assessment methods are usually divided into MM, KR, and PR. The evaluation method based on MM considers various factors to evaluate the situation, which aims to evaluate the network situation from different angles.
Chen et al. 11 established a hierarchical network security threat situation quantitative assessment model based on the bottom-up, local first and global strategy. Their proposed method calculates the threat indicator by weighting the importance of attacks, services, hosts, and the whole network layer by layer, thus evaluating the security threat situation. Li et al. 12 used fuzzy c-mean clustering and optimal clustering criteria to process the data, thus obtaining the optimal clustering center and number of clusters. Moreover, they combined analytic hierarchy process (AHP) to establish a multi-factor two-level assessment model to obtain the final situation assessment result. Wang et al. 6 proposed a hierarchical chaos simulation annealing (CSA) method based on AHP and gray cluster analysis (GCA). In their method, they used AHP to build a hierarchical CSA to determine the weight of every threat. Meanwhile, GCA is used to build the standard layer of the indexing system. Bian et al. 13 proposed a multi-level fuzzy comprehensive network security situation evaluation model based on improved AHP and fuzzy comprehensive evaluation method. Note that traditional network situation assessment methods cannot effectively assess the security situation of distributed denial of service (DDoS) attacks. Zhang et al. 14 proposed a DDoS attack security situation assessment model based on the fusion features of fuzzy clustering algorithms. Their model can reasonably and effectively evaluate the security status of DDoS attacks. Meanwhile, their model is more flexible than non-fuzzy methods. However, the methods based on MM rely on expert knowledge in the process of index selection, index weight determination, and model construction. As a result, the evaluation results are easily affected by subjective factors.
The KR-based network security situation assessment methods assume that there is certain degree of correlation between the network security situation and the state of the network, which is susceptible to the influence of historical and current information. It uses theory of evidence, mathematical statistics, and fuzzy theory to learn historical prior information and current information to infer the current security status of the network. Based on semi-supervised naive Bayes (NB) classifiers, Xu et al. 15 proposed an improved algorithm based on the confidence of data classification, which can achieve situational classification of air combat data. Jin et al. 16 proposed a network security situation assessment model based on random forest (RF). Their method is based on the idea of multiple classifier combination, which consists of decision trees. Each tree depends on an independent sample, and all the trees have the same random vector distribution value in a forest. To effectively evaluate the impact of DDoS attacks on the network situation, Li et al. 17 computed the indicators representing the network situation in each layer, and then the indicators are fused with Dempster–Shafer (D-S) evidence theory to evaluate the impact. Fu et al. 18 improved the optimal fuzzy gray model using modified gray model (GM) (1,1) with residuals, and the optimal fuzzy gray model is used to the prediction of network security situation assessment.
The Markov model has important applications in network security situation assessment. Schemes19,20 fully consider the interaction between the attacker and the defender, and proposed a network security assessment model based on the Markov decision process and game theory. To solve the problem that hidden Markov model (HMM) parameters are difficult to configure, Li and Li 21 proposed an improved situational assessment method based on HMM, which establishes HMM by obtaining the observation sequence and combines the improved simulated annealing (SA) algorithm with the Baum–Welch (BW) algorithm. HMM parameters are optimized, and the security situation value of the network is obtained by the method of quantitative analysis, which more accurately reflects the security situation of the network. Liu and Liu 22 used attack graphs to describe the causality of attack behaviors and combined the HMM to establish the probability mapping between the observation sequence and the attack state. Moreover, the Viterbi algorithm was used to calculate the maximum probability state transition sequence. Li and Zhoa 23 pointed out that the network evaluation time period is greatly affected by human, and the HMM state transfer matrix and observation symbol matrix are often determined empirically. To solve the above problems, they used sliding time window mechanism to extract observation values, and the hybrid multi-population genetic algorithm is adopted to train the HMM model parameters to improve accuracy. Although the method based on KR performs well when analyzing security problems on small dataset with low dimensionality, its evaluation efficiency is relatively low when dealing with massive high-dimensional data.
The PR-based network security situation assessment methods assume that the network security situation results can be obtained according to the degree of matching data. PR-based methods divide different security situation levels by learning the characteristics of data and use the data to match each of the divided results, thus obtaining the network security situation. To obtain a global optimal solution, Shi and Chen 24 proposed a twin support vector machines (SVM) model for command information system security situation sample data learning and parameter estimation, so as to evaluate the command information system security situation. Gao et al. 25 proposed an artificial fish swarm algorithm to optimize the information system security risk assessment model of SVM. The proposed method used the artificial fish swarm algorithm to optimize the penalty coefficient C and kernel function of SVM. The experimental results show that the method has high accuracy and convergence speed. Song et al. 26 proposed an information security situation assessment model based on genetic algorithm to optimize weights and thresholds of BPNN. Compared with the standard BPNN, BPNN optimized by genetic algorithm (GA-BP) neural network has lower simulation error and better fitting effect. Li et al. 27 and Dong et al. 28 use cuckoo search algorithm to optimize BPNN neural network parameters to avoid BP falling into local extreme values, thereby improving training speed and evaluation accuracy. Compared with genetic-BPNN algorithm, it has training time, error, and accuracy. Even better, Luo and Liu 29 used the rough intensive reduction attribute to take the membership of the samples calculated by fuzzy method as the input of neural network and the expert value as expected output of the network to improve training speed and accuracy. Zhang et al. 30 proposed a situation assessment method based on deep autoencoding network for the dependence of BPNN methods on label data. The deep autoencoder (AE) is used as the basic unit to construct a deep AE network, and the deep AE network is trained with expert experience and hierarchical evaluation methods to form a model with the ability to accurately evaluate the input situation data. However, the classification results are mostly obtained through machine learning techniques, and the middle part of the algorithm is difficult to follow.
Preliminaries
SAE
AE is an unsupervised learning algorithm driven by input data, which performs feature extraction on data through self-supervision without labels, thus resulting in data with reduced dimensionality, that is, less but more important features. The self-encoding neural network maps the input data to the hidden layer to realize data encoding. Then, the corresponding decoded data are obtained by mapping the encoded data, and the decoded data are regarded as the output data.
The encoder is composed of input layer, hidden layer, and output layer, in which the learning process from input layer to hidden layer is called encoding process, while from hidden layer to output layer is called decoding process, as shown in Figure 1.

Self-encoding neural network.
From a general perspective, the input layer is
The output of self-encoding hidden layer can be expressed as

where

In the process of training the neural network, to reduce the parameters that need to be trained in the model, the following constraints are usually given

At this point, it means that the learning model should contain three sets of parameters:

1. When

2. When

The overall error function can be expressed as

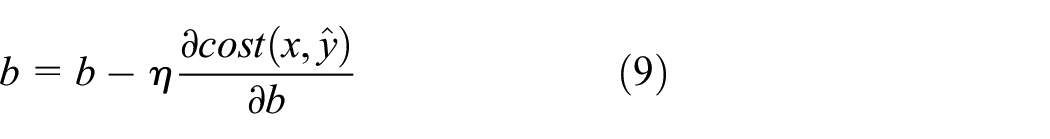
The BP training is carried out using the stochastic gradient descent method combined with the error function to update the network parameters. The rules for parameter update are defined as follows (where


SAE 31 is an improved research based on self-coding network, which is a kind of network constructed by connecting several ordinary self-encoder successively. As shown in Figure 2, it consists of several layers of self-encoding networks and a Softmax layer.

Deep self-coding neural network.
The training of stack self-encoding includes the following steps:
Input the original data, use an AE to train the input data to get the corresponding network parameters, encode the original data through the trained AE network, and take the output result after encoding as the output result of the first hidden layer;
Take the output in Step 1 as the input and continue to use the training method in Step 1 to optimize and update the network parameters of this layer. Repeat this step until the last hidden layer is trained;
Take the output in Step 2 as the input and use the label corresponding of the original input data to train and optimize the network parameters of Softmax layer;
Calculate the loss cost function of all hidden layers and Softmax layers, and the partial derivative function value of each parameter in the network;
The initial network parameters calculated in Steps 1, 2, and 3 are taken as the initialization parameters of the whole network. Meanwhile, the loss cost functions and partial derivatives of the parameters obtained in Step 4 are used to calculate the updated network parameters and realize the parameter optimization of the whole network.
BPNN
The Error BPNN is also called BPNN, as shown in Figure 3. As a supervised learning algorithm, BPNN mainly uses the error function generated by the actual output value and the expected output value for BP, which adjusts connection weight and threshold parameters of neurons in each layer of the network. The training of network will be stopped and relevant parameters of the network will be saved by iterating the network with input data until the error function is reduced to the allowable range of the network.

BPNN.
The specific training steps of BPNN are as follows:
1. Initialize the network. Assume that the input vector is
2. Calculate the output of each neuron in the hidden layer and the output layer.


where
3. Calculate the error function of the output layer and the hidden layer. Given the training sample, let
With batch update method, for the given training sample

where

Sample population error

4. Calculate new connection weights and thresholds


where
5. Repeat multiple iterations. Repeat Steps 2–4, adjust the network parameters according to the errors generated by each iteration, and finish the training and save the model parameters until all samples are trained or the error function has reached the preset range.
Proposed model
Network structure
Due to high dimensionality and complexity of data, existing evaluation methods based on neural network use multi-layer and multi-neuron networks. However, these methods are not efficient. In this article, we propose a network security situation evaluation method based on SAE and BPNN.
SAE is an unsupervised learning algorithm, which is mostly used in data denoising, sparse high-dimensional data dimensionality reduction, and so on. In network security situation assessment field, the indicator data are high dimensional and sparse. We use SAE to reduce data dimensionality while ensuring that there is no information loss in indicator data and combine BPNN to conduct network security situation assessment. Meanwhile, we select the commonly used security situation assessment methods, such as SVM and NB, for auxiliary verification. The experimental results show that the method has fast convergence rate in training phase and high accuracy in evaluation phase, which is convenient for administrators to understand the network security status accurately.
SAE-BPNN uses the coded data output from the last hidden layer of SAE network as the input of BPNN, which not only can ensure the non-linear relationship of data but also can reduce the dimension of input data, as shown in Figure 4.

SAE-BPNN.
The SAE-BPNN algorithm
The specific process of the SAE-BPNN evaluation method is as follows (see Figure 5).
1. Indicator data extraction and normalization processing: most of the NSSA data are generated in the form of network traffic, alarm logs, and so on. It is necessary to execute perception data extraction according to the indicator system and then normalize the indicator data according to the corresponding normalization criteria.
2. SAE training model: the SAE training model inputs the normalized indicator data. Specifically, it first determines the number of hidden layer in the model. Training through multi-layer SAE neural network, calculating the corresponding loss value, and determining whether within the scope of the reasonable losses. If not reasonable, adjusting the number of hidden layers. Then it needs to adjust the model parameters. It adjusts SAE model parameters and the number of iterations to obtain the model under the optimal error value and uses the final SAE model to encode the input data as the input of BPNN.
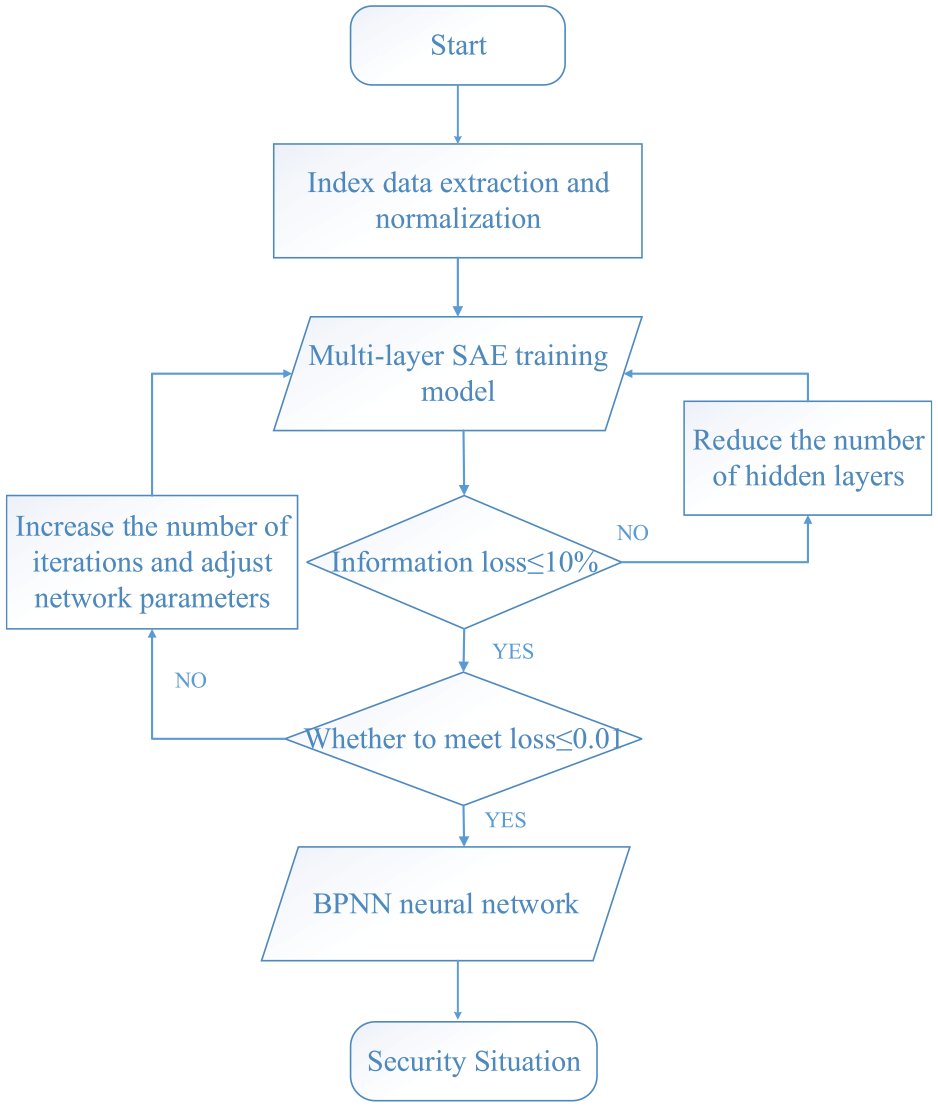
SAE-BPNN algorithm evaluation process.
First, the combination formula of hidden layer and output layer is deduced according to the self-coding formula in section “SAE”


The number of layers of SAE is determined by the information loss rate.
The formula of single layer information loss rate is as follows
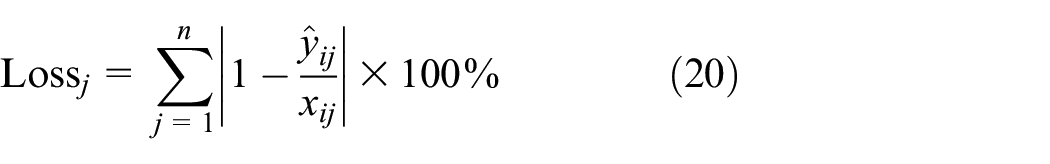
The loss rate of n-layer comprehensive information is as follows

where
Finally, the number of SAE layers and the output results of N layers are determined by the loss range

3. BPNN situation assessment: input the data after non-linear dimensionality reduction processing and its corresponding label into BPNN, thus obtaining the optimal model through multiple iterations and evaluating the security situation.


Experimental study
Experimental environment
We conduct experiments on a machine equipped with NVIDIA TITAN XP GPU, with Ubuntu 18.04 operating system, Python 3.6, and PyCharm Community 2017.3. Meanwhile, we use TensorFlow 1.4.1, Keras library, and machine learning library scikit-learn for model training.
Experiment dataset
To verify the validity of the SAE-BPNN algorithm, we select the Coburg Intrusion Detection Dataset-001 (CIDDS-001) 32 of Coburg University of Technology as the research object. CIDDS is an evaluation dataset created based on an anomaly network intrusion detection system. The basic idea behind CIDDS is to use OpenStack to create tagged stream-based datasets in a virtual environment.
The network topology of CIDDS-001 dataset is divided into internal network and external network, as shown in Figure 6. The internal environment includes multiple clients and typical servers, such as e-mail servers and Web servers. Network attacks contain denial of service (DoS), brute force attacks, and port scans. Since the origin, target and timestamp of the attack being executed are known; it is easy to mark the recorded NetFlow data.

CIDDS-001 network topology.
CIDDS-001 dataset has a total of 14 attributes, as shown in Table 1.
CIDDS-001 data property table.

In this experiment, CIDDS-001 dataset’s Week 2 external stream data are selected for analysis, and the external stream data flow attack on the second day is shown in Table 2.
Attack log information.

The relevant information can be extracted from Table 2. Three attacks are initiated before 12 o’clock and after 12 o’clock. Therefore, the data stream after 12 o’clock is selected for training, and the data stream before 12 o’clock is used for testing; the ratio of training set to validation set is 2:1.
Classification of the normalization scheme of this experimental indicator system:
1. The maximum value of the six types of indicators (e.g. data stream duration, number of used protocols, number of source addresses, number of destination addresses, number of network ports, and type of data stream) are within a certain range. The normalization scheme uses the extreme value method

where
2. The number of transmitted packets, the number of transferred bytes, and the amount of suspicious data have a large amount of variation. As a result, their maximum value cannot be determined. Therefore, the inverse cotangent function method is adopted in the normalization scheme

or
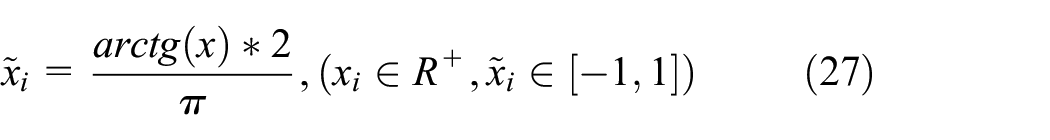
where
Experiment results
Dimension reduction part
We first need to determine the number of hidden layers in SAE. Then according to the SAE-BPNN evaluation process, we normalize the indicator data and use SAE to perform data dimensionality reduction on the training model, and the experimental parameter setting is given in Table 3.
SAE network parameter configuration.

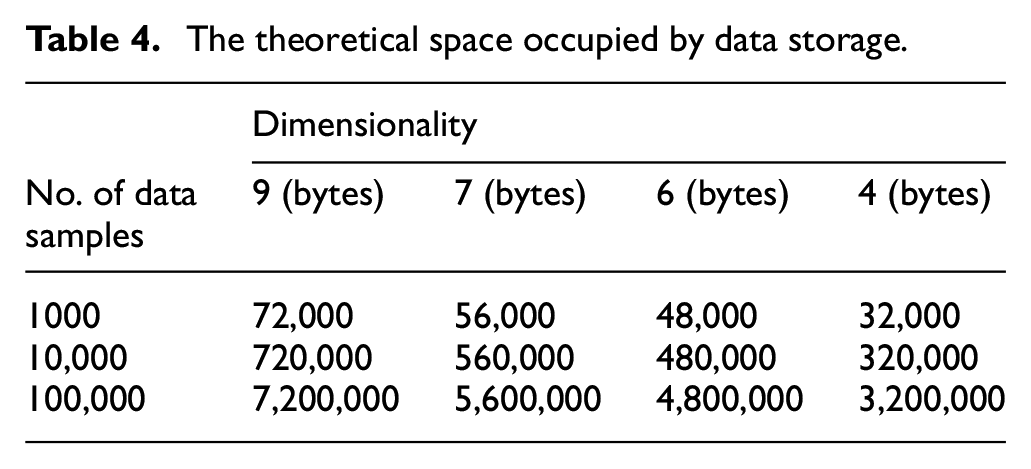
First, we select the number of hidden layers for SAE. Considering the memory space occupied by the data storage after dimensionality reduction, the analysis is performed according to the theoretical space proportion, actual test proportion, and data proportion of the actual data store. The theoretical storage space of data is shown in Table 4, and the actual storage space of data in file storage is shown in Table 5. Note that the data are a float-64 type, and each one of the data occupies 8 bytes. The initial dimensionality is 9. Data footprint = (dimension × number of data pieces) × unit data occupies storage space. For example, 1000 data samples of 9-dimensional data take up
The theoretical space occupied by data storage.
The actual space occupied by data storage.

As shown in Figure 7, we can find that during the actual data storage process, the data are stored in the excel file. When the data are reduced from 9 to 4 dimensions, the average storage space of 1000 pieces of data is reduced from 73,728 bytes to 65,536 bytes, saving nearly 15% of storage space.
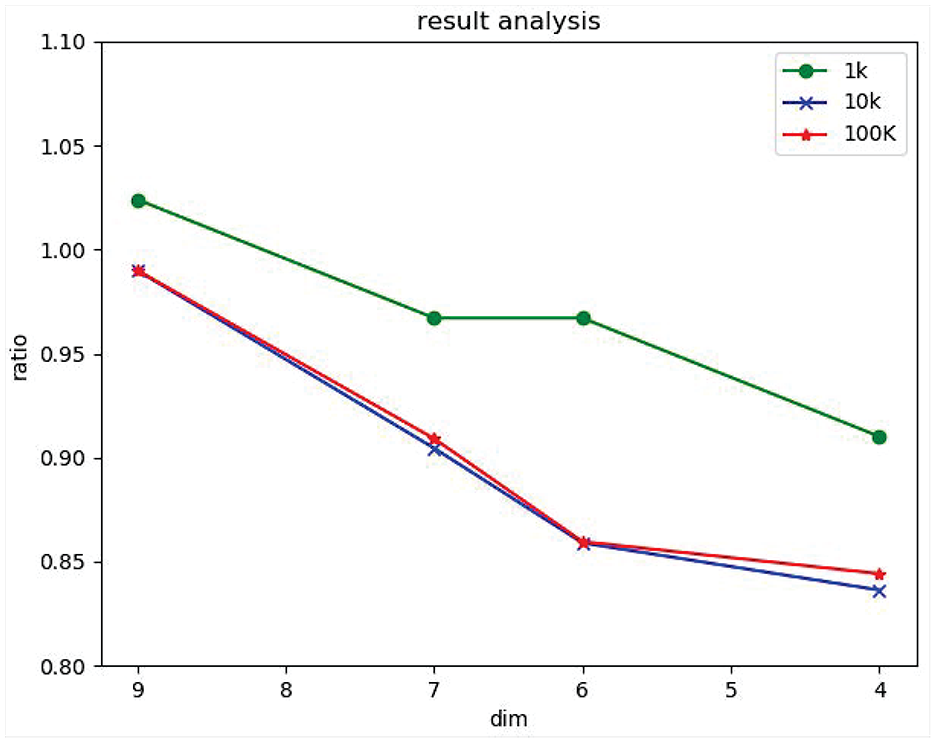
Ratio of actual storage space to ideal storage space.
Figure 8 shows the Loss caused by constructing Layers 1, 2, and 3 SAE hidden layer. According to the analysis results, it can be seen that when the indicator data are coded for dimensionless reduction, the Loss value is close to 0 when the number of SAE hiding layers is 1 and the number of iterations epoch is 400, which indicates that after the dimensionless reduction of SAE at Layer 1, the output data can better restore the input data, and the information integrity rate of the input data is close to 100%. When the number of hidden layers of SAE is 2 or 3, the Loss value tended to be stable when epoch = 200 times, but the Loss value remained above 0.2. Meanwhile, the SAE hidden layer output data are equivalent to the feature information that loses more than 20% of the original input data. Through experimental analysis, Layer 1 SAE is finally selected to encode the indicator data, and SAE iteration times are selected as 600.
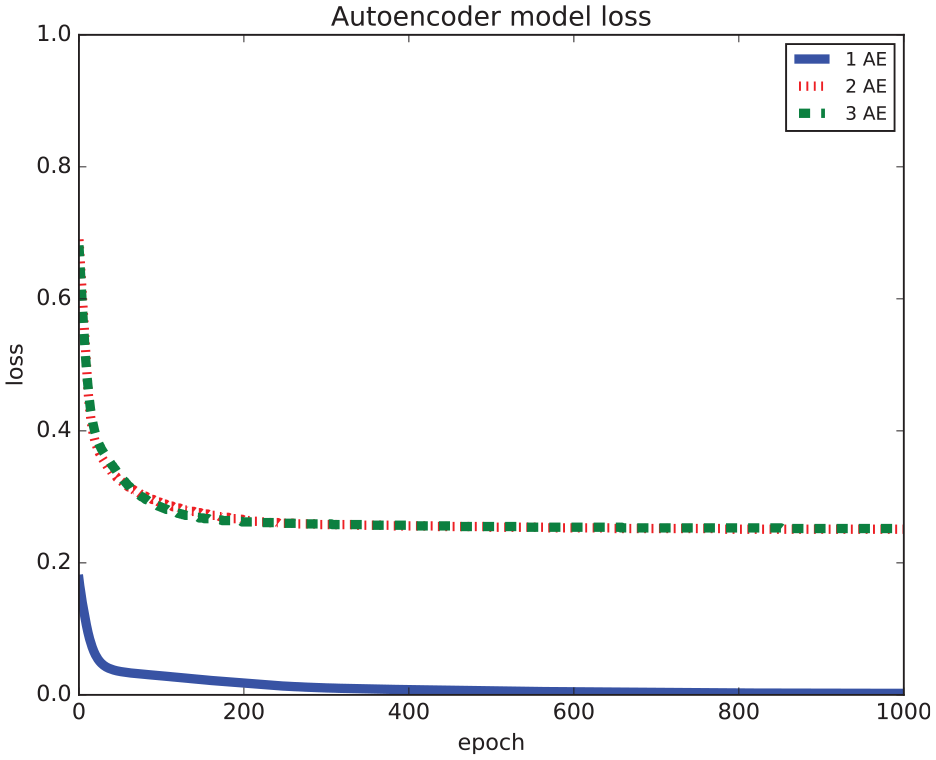
Loss comparison of SAE algorithm.
Evaluation
The data after SAE dimensionality reduction are input into BPNN, and the BPNN parameter settings are shown in Table 6. To verify the effectiveness of SAE + BPNN, BPNN and SAE are used for comparison to evaluate the network security situation. The test experiment selects the external data stream from 9 am to 12 am on the Tuesday of second week of CIDDS-001 dataset. There are three attacks between 9:46 and 9:48, 10:14 to 10:30, and 11:33 to 12:00, and the experimental comparison results are listed in Figure 9.
BPNN network parameter configuration.


Comparison of SAE-BPNN experiments.
From Figure 9 we can see that although SAE can roughly determine the attack situation during the process of network security situation assessment, the evaluation results fluctuate relatively much. Moreover, BPNN can accurately detect the situation of attack, but there is a false positive within 120–140 min. SAE + BPNN can accurately determine the time of attack and its evaluation accuracy is the most accurate, which can exactly identify the attack time.
Evaluation performance analysis
Except the comparison experiment conducted by combining SAE with BP, we also select SVM and NP to analyze the security situation and verify the effectiveness of the proposed method.
From Table 7 we can easily find that the proposed method has a certain improvement in terms of accuracy as compared with BPNN, and the combination of SAE, NB, and SVM also improves the evaluation accuracy. Meanwhile, from Table 8 we can see that the running time of the methods after applying SAE dimensionality reduction is less than that of the methods BP, NB, and SVM without dimensionality reduction.
Comparison of algorithm performance.

BPNN: back propagation neural network; SAE: Stack autoencoding network; SVM: support vector machines.
Comparison of algorithm time.

SAE: stack autoencoding network; BPNN: back propagation neural network; NB: naive Bayes; SVM: support vector machine.
Conclusion
In this article, we propose a network domain security situation assessment method based on SAE-BPNN. First, the proposed method extracts the indicator data of network domain and normalizes them. Then, SAE is used for dimension reduction and feature extraction. Moreover, the network security situation value will be calculated by BPNN algorithm, which can evaluate the network domain security situation quantitatively. Finally, through a series of comparative experiments, we proved that the proposed method based on SAE and BPNN can accurately evaluate the security situation of network domain. And this method has the ability to reduce the dimensions of input data while preserving useful features of the data, which can reduce the storage overhead and computing resources and improve the evaluation efficiency.
Footnotes
Handling Editor: Yanjiao Chen
Declaration of conflicting interests
The author(s) declared no potential conflicts of interest with respect to the research, authorship, and/or publication of this article.
Funding
The author(s) disclosed receipt of the following financial support for the research, authorship, and/or publication of this article: This work was supported by the National Natural Science Foundation of China (No. 61962015), the Natural Science Foundation of Guangxi (No. 2016GXNSFAA380098), and the Science and Technology Program of Guangxi (No. AB17195045).