
Abstract
Recently, Internet-based devices have evolved into platforms for new networks, with Internet of Things technology being applied in various areas. The expansion of scope of this technology and exchange of real-time information enables users to check their content whenever. The real-time Internet of Things motion detection platform has been developed to detect and monitor users in installed spaces. In this article, the real-time Internet of Things motion detection platform utilizes a non-contact sensor module and motion recovery printed circuit board module to quickly respond to emergency situations through real-time monitoring. This is visualized on the display by sending data extracted from the motion recovery printed circuit board module combined with open source hardware by the non-contact sensor module receiving information from smartphone users. The administrator’s display continuously analyzes real-time moving objects by detecting them with respect to location coordinates and providing automatically recognized data to the cloud server. In addition, real-time Internet of Things motion detection monitoring system was configured to quickly respond to real-time alerts and effectively manage problems. Therefore, installing real-time Internet of Things motion detection platform at an actual site will enable quick resolving of emergency situations through information provision and user awareness monitoring.
Keywords
Introduction
Since the beginning of the spread of smartphones to Korea in 2009, the domestic market for mobile devices has continued growing at an accelerating pace. 1 The rapid expansion of the Internet has been accompanied by the creation and sustained development of a new society. At the beginning of 2010, the concept of hyper connectivity emerged in the context of mobile phones, 2 associated with the sole use of communication functions. In the new network environments, smartphone users exchange massive amounts of information through the Internet in real time and establish platforms for various services. The development of fast-growing telecommunication technologies has expanded beyond smartphones and other smart devices, reflecting the needs of users.3,4
According to the International Data Corporation (IDC)’s smartphone shipments survey, smartphone shipments in 2014 and 2015 numbered 1301.7 million and 1432.9 million units, respectively, which reflects 10.1% annual growth. It is estimated that in 2019, 7.6 billion individuals globally will be using smartphones. 5
The mobile-device market is growing alongside Internet communication technologies6,7 and other smartphone-related developments. 8 Stable Internet communication networks allow users around the world to exchange vast amounts of information. The growth of the smart-device market, 9 which started with smartphones and smart products, has led to a re-orientation toward users’ demands and, accordingly, to customized services that provide a variety of information, without time and place restrictions.
As one of the trends, the Internet of Things (IoT)10–15 is continuously attracting attention for its convenience and efficiency in providing services appropriate to the user situation. It is now possible for a user to select and provide information directly from the device display, which previously only possessed a direction information-processing function. The user experience, which allows users to receive a wide variety of information without time and place limitations, leverages the big data that are extracted in large quantities from the digital environment to build new services. 16 The user-customized desired services and information are provided in real time and visualized using technologies such as sensor,17,18 wireless fidelity (Wi-Fi), 19 and near field communication (NFC), 20 to provide user services. Furthermore, research and development are currently underway to provide services customized for and analyzed by the users.
Huang et al. 21 used various techniques to present sensor-based pedestrian tracking techniques that accurately calculate pedestrian locations and use algorithms to improve tracking accuracy for monitoring. However, difficulties exist in communication technology, the simple structural design of the module, and the maximization of utility when utilizing the sensor module desired by the user in the IoT environment.
Morrison et al. 22 collected on-site data on pedestrian navigation, posture, and location to analyze the body movements of users. This proposal considers the accuracy of user navigation and location recognition techniques in utilizing various sensors. However, it is difficult to compare the global navigation satellite system (GNSS) with the Wi-Fi test that delivers solutions through integration of various sensors. This requires a platform with an IoT-based system that allows multiple sensors to smoothly send, receive, and secure compatibility and flexibility.
AD Deshmukh and UB Shinde 23 described the monitoring system that provide information about environmental conditions. The monitoring system provides data to the Raspberry Pi through the Arduino Nano for industrial, home, and office applications. This should maximize the use of IoT technology-based sensor modular systems so that they can be applied to various environments according to user requirements.
Y Liao et al. 24 proposed SnowFort for the open source wireless sensor network (WSN) to analyze data for infrastructure and environmental monitoring. SnowFort has developed a real-time damage detection application for development structure status monitoring and a powerful distributed algorithm for data loss, which presents ongoing resolution problems by identifying system equipment failures, increasing the number of service users, and server usage in real time for application in the real world.
Turkane and Nagrale 25 sensed background images extracted using a moving video sequence of the human body to analyze human motion. The movement of an object uses a static camera to detect objects and to update the background in real time, in order to extract image data.
However, difficulties exist due to environmental problems, communication speed, and so on. when analyzing human movement by acquiring large amounts of real-time data that are extracted to easily detect moving objects in the IoT environment. To this end, it is essential to use a real-time IoT motion detection (RTIMD) platform by applying visualization modules for detecting the movement of small objects from various angles.
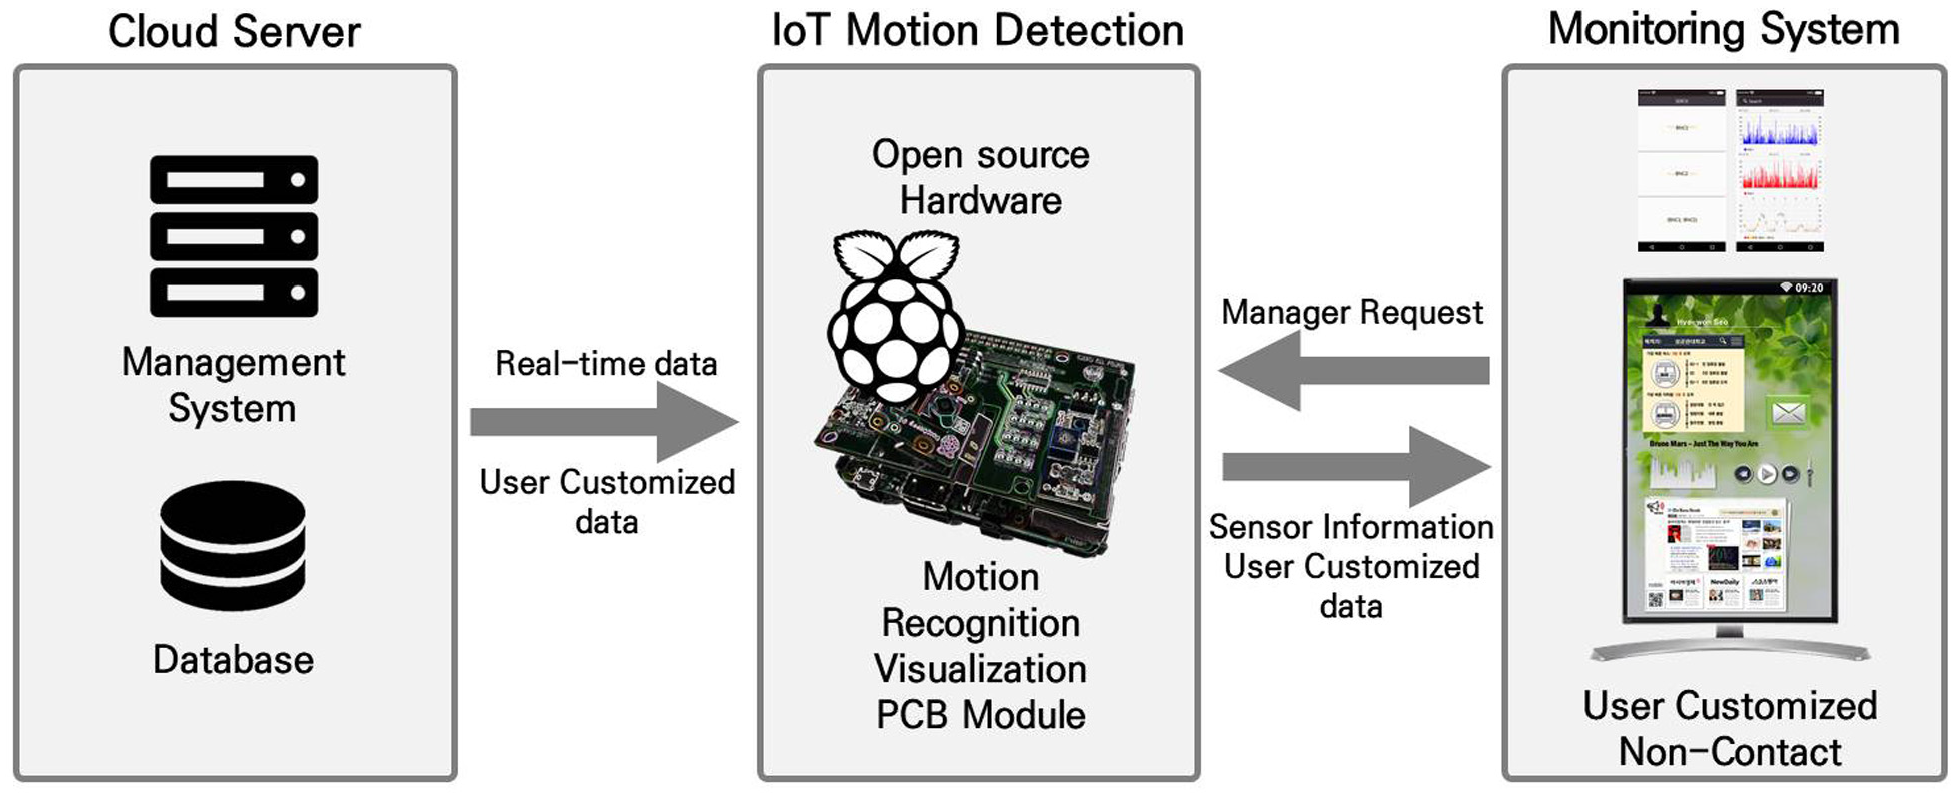
This article summarizes the overall architecture of the RTIMD platform, as shown in Figure 1.
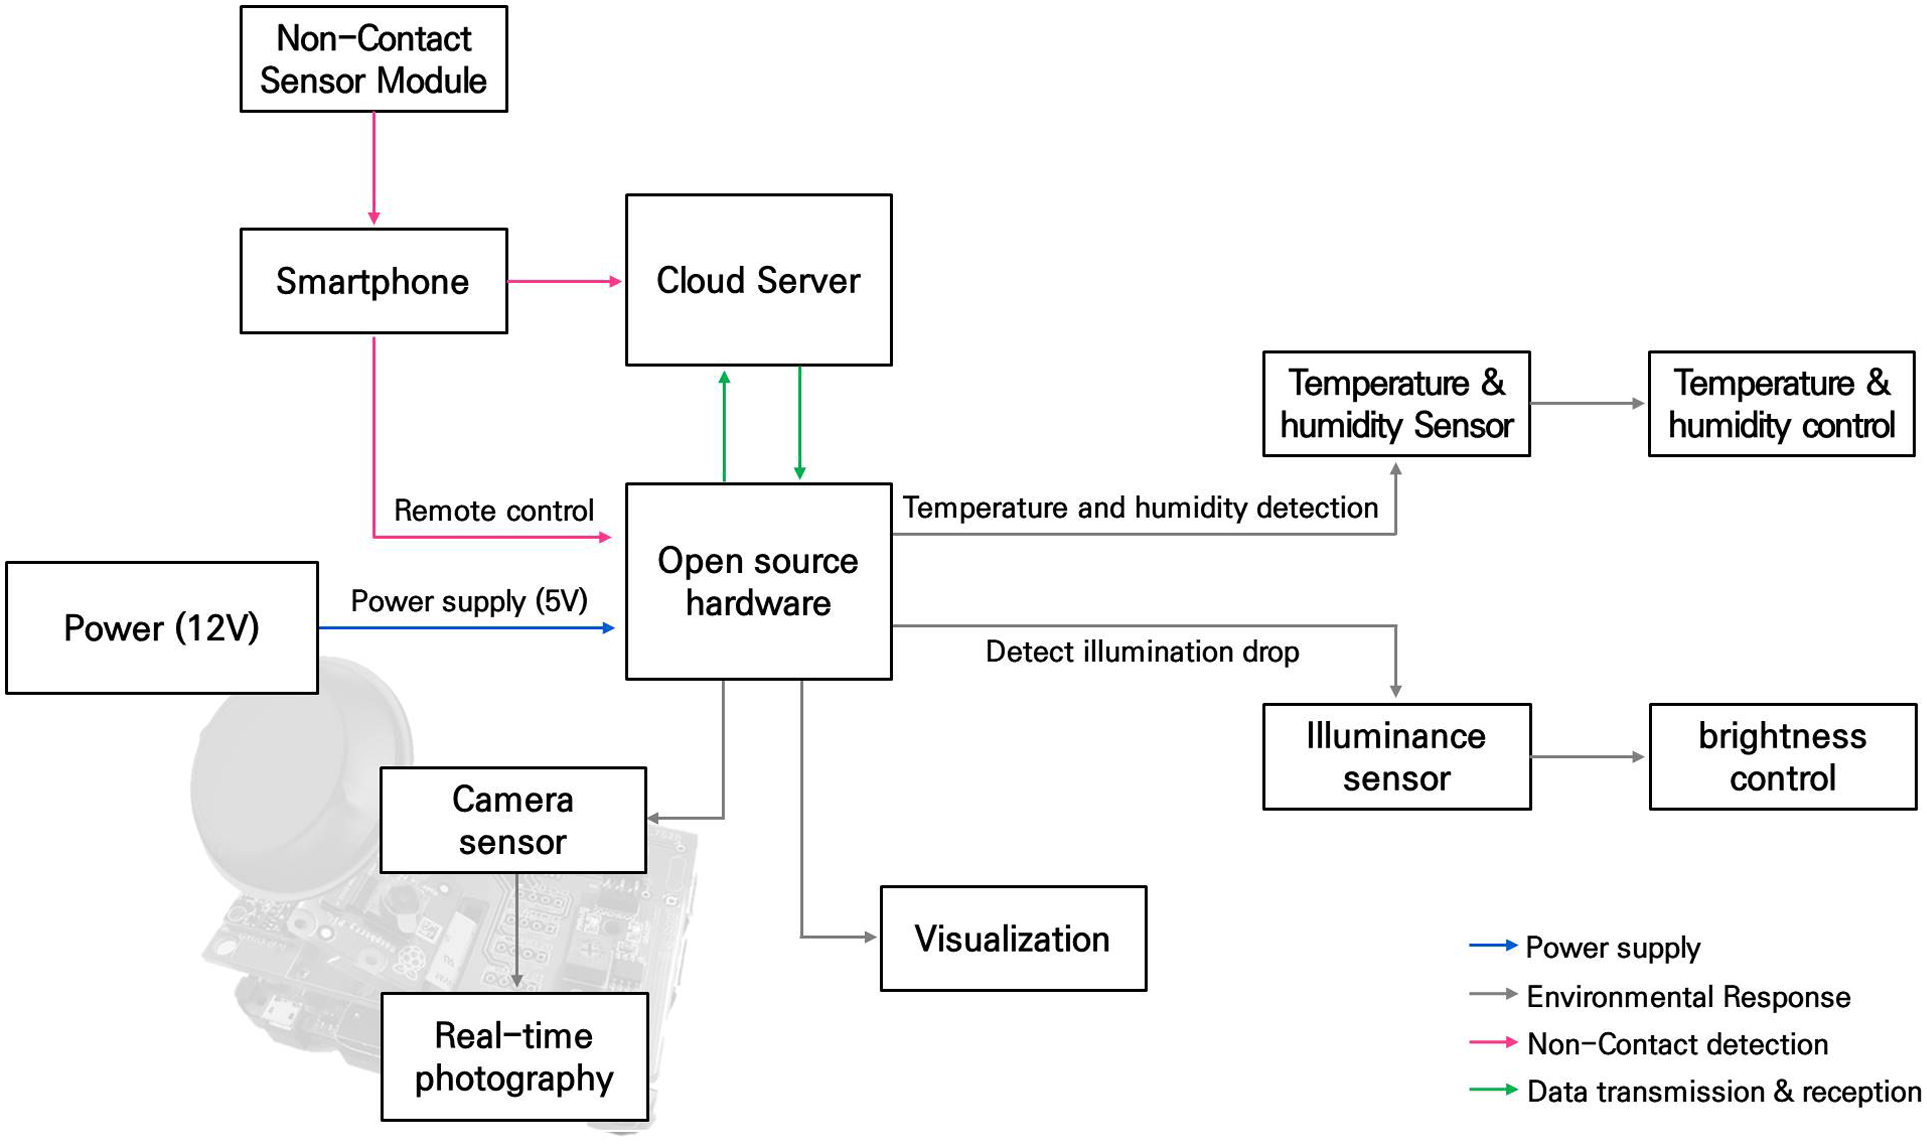
Real-time IoT motion detection platform circuit design.
The non-contact sensor module (NCS module) accesses the smartphone user information closest to the display and then sends it to open source hardware. The motion recognition visualization printed circuit board module (MRV PCB module) section embodies various sensor functions for personalized design. The RTIMD monitoring system streams and monitors data sent to the cloud server in real time. The verification section for realizing the IoT operation sensing platform activates the sensor to facilitate real-time management. This is done to provide an efficient service by notifying the manager of real-time monitoring information, while it is sent to a cloud server.
The rest of this article is structured as follows. Section “NCS module” describes the development process of NCS module and how data are received correctly in conjunction with a smartphone. Section “MRV PCB module” describes the development of a MRV PCB module that can be combined into an open source hardware to identify the location and status of the user. Section “RTIMD monitoring system” identifies data extracted via the RTIMD monitoring system through real-time streaming. Section “Verification for implementing RTIMD platform” conducts verification for implementing RTIMD platform for practical use. Section “Conclusion” summarizes the RTIMD platform and concludes the article.
NCS module
Recently, sensor modules have been installed in a variety of fields to provide users with new changes in various services. Users can acquire data from sensor modules to monitor movements as they sense the behavior of objects. This provides scalability and applicability as sensor modules combine with open source hardware to perform functions on controllers in a variety of environments. Raspberry Pi, an open source hardware, is a key component of hardware development that is highly utilized in real-life environments and minimizes the economic burden. Raspberry Pi computer is a mini PC concept, smaller than a regular desktop Personal computer (PC), which has minimal and high-end characteristics.26,27 As a result of technological advances, recent mini-PCs consist of almost the same components as traditional desktop PCs.
The importance of storing data continues to grow in recent years as data usage increases. This is used to improve data input/output performance and reduce performance regarding the use of solid state drives (SSD), a storage device that uses memory instead of shock-prone and noisy disk-type hard disk drive (HDD). In addition, since Raspberry Pi models can be used in a small-sized form with only the desired functions, they can be designed with compact measurements and are therefore highly usable. These mini-PCs are easy to learn excellent performance and efficiency characteristics at low cost, therefore, with an open source nature, it is easy for novice users to access and develop applications in a variety of areas through coding.
Microcontrollers are useful among micro PCs when I/O control is needed; however, in this article, open source hardware is used for image processing and high-speed processing. Open source hardware operates in conjunction with the mainboard of a microprocessor-steered unit with computer functions in one circuit. One of its advantages is its ability to be used for servers (network-attached storage (NAS), web servers, etc.) or in parallel processing by connecting several units. Varieties of open source hardware available are such as BeagleBone,28,29 Orange Pi,30,31 and Odroid models.32,33 The open source hardware belongs to a single board computer class, with advantages such as low cost, ultra-small, and fast individual-compatible modules. These include Raspbian, a Linux-based operating system, the Windows 10 IoT core, dedicated development tools and a software development kit (SDK). Open source hardware provides the necessary environment for IoT-related development and makes it easy to configure various IoT devices and platforms. In combination with some NCS module, open source hardware is designed to transmit and receive user data. The NCS modules are communication modules that are developed with small sensors that can operate at low power consumption and can be connected to smartphones.
The NCS module radiates serial wired communications and provides a serial port profile (SPP), making it multi-pairing, to configure PicoNet so that multiple clients can be connected to one host. It is possible to connect a plurality of devices used by the user, recognize the SPP profile from each other, and communicate data.
The NCS module detects the distance between the smartphone and the display. The user-customized NCS module is a wireless communication technology that uses low-power Bluetooth low energy (BLE) to locate people or objects. A small-sized user-customized NCS module can locate family members within a radius of 50–100 m from their home. In an Ethernet and Wi-Fi environment, the user-customized NCS module can use the family’s smartphones to provide customized information such as messaging, voice, and video.
The user-customized NCS module development utilizes the built-in technology of BLE 4.0 CC2541 to incorporate a Bluetooth smart support integrated circuit (IC) inside the resin board with a layer of wiring, as shown in Figure 2.
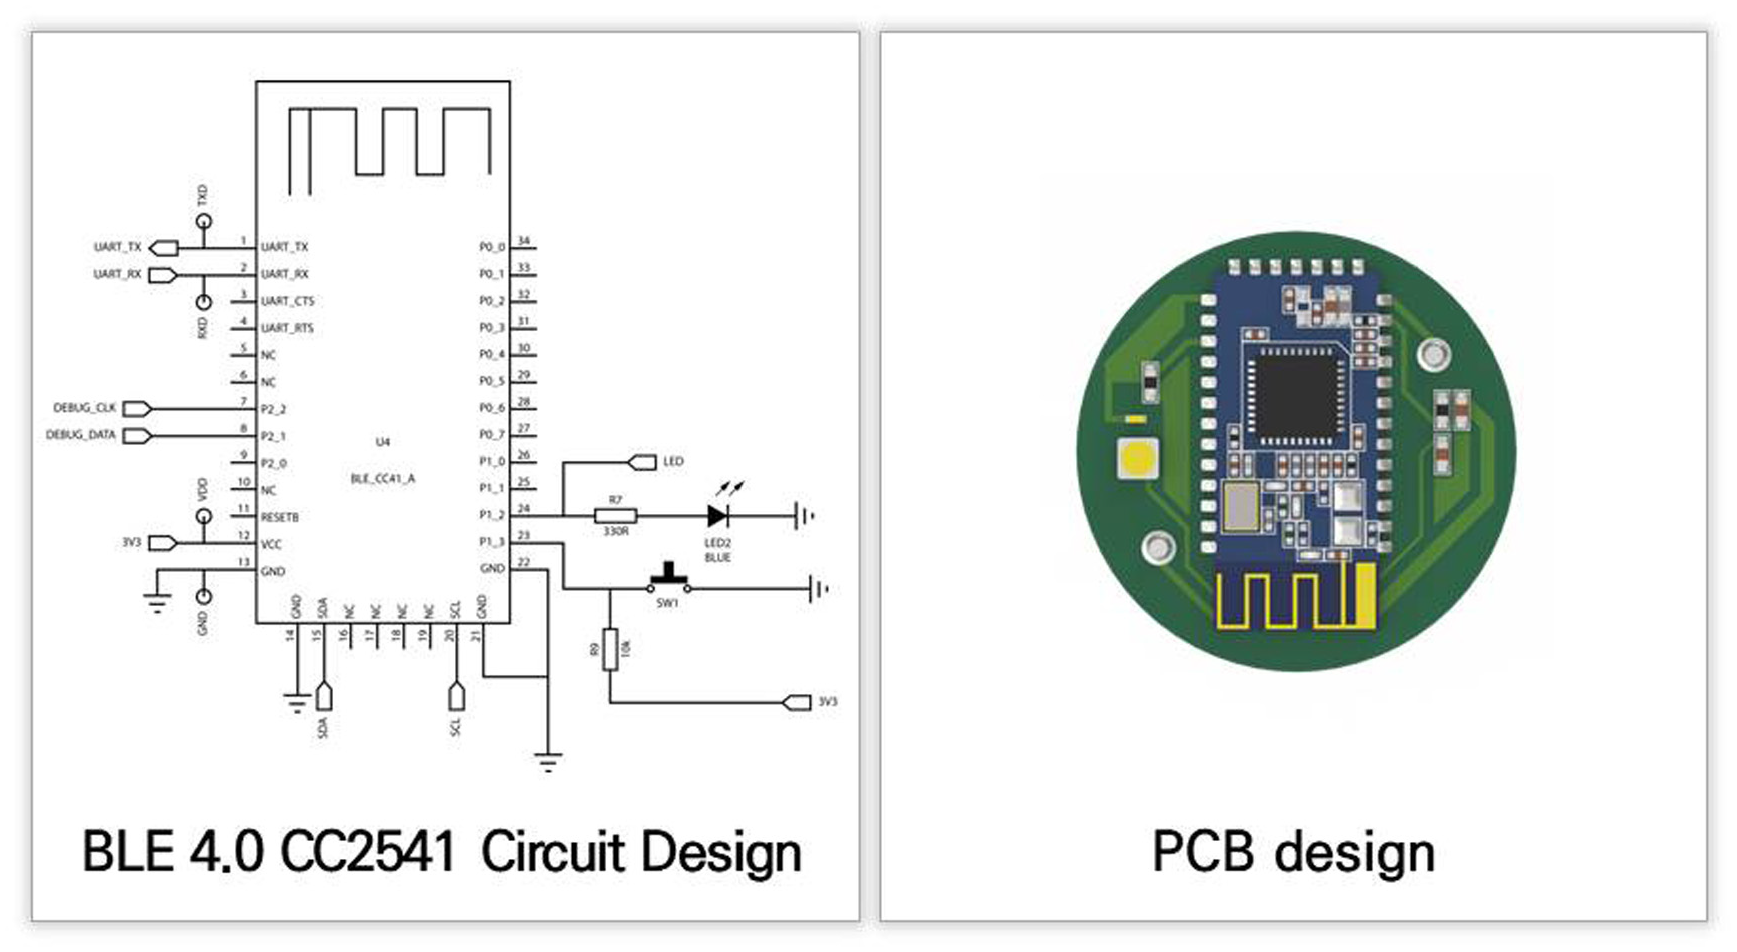
3D rendering of non-contact sensor module PCB circuit design.
The NCS module does not require a battery, and the identification number is transmitted wirelessly to apply simple functions. It is a 5 mA module that is compact, low-powered, and is a semi-conductor embedded in SUBstate (SUSUB) format that reflects a variety of functions, with the built-in component technology applied to the PCB of the contactless sensor module. The PCB of the NCS module is a solder built with a Bluetooth smart support IC inside a four-story wiring layer resin board with an internal configuration and finished with a 3-cm diameter PCB.
The MRV PCB module accesses the closest smartphone user information and visualizes the information it receives by sending customized information to the display. This applies to a variety of areas using the desired sensor functions based on open source hardware for personalized design to communicate information. Figure 3 shows resin boards with built-in ICs, designed to be 0.2 mm thick, and to be wirelessly available with modified oscillators and manual parts on top of them.

Working mockup of non-contact sensor module PCB circuit design.
The NCS module recognizes a smartphone with a SDK and then connects it to a cloud server. This module requests signal information from the central system and provides current signal information to the smartphone.
Smartphones can easily remotely control and manage interfaces with unattended Android-based terminals, which is an efficient management and operation system that enables smartphones to grasp data failure in advance, while sending visualization information to open source hardware. For data fault management, the administrator-facing application measures and verifies the response speed, as shown in Figure 4, for real-time data transmission to the display.

Measurement result of real-time visualization response speed of non-contact sensor module.
The real-time visualization response rates are summarized in Bayonet Neill–Concelman (BNC) 1 and BNC 2 in the application, to identify changes over time by line graphs. In addition, the mean value is plotted on a point graph (BNC 1 andBNC 2) for accurate measurement. The smartphone not only extracts information that is executed periodically through registered user devices in the NCS module but also identifies the normal operating conditions of malfunction and delayed behavior problems.
The NCS module transmits a specific ID value for a smartphone that is approached around up to 80 m. When a service application developed by the SDK is run on a smartphone, it recognizes the ID value and transmits it to the cloud. The NCS module provides more sophisticated positioning than just global positioning system (GPS); it generates a wide range of signals to access and identify the closest smartphone user information on the display to MRV PCB module.
Thus, the real-time visualization response rate analysis shows a maximum response rate of 64 ms and a minimum response rate of 12 ms, with the mean response rate measured at 25 ms.
Table 1 shows the results of 10 tests of the NCS module, smartphone, and open source hardware. They interacted with each other to determine whether the signals were transmitted normally.
Experiment result confirming the flow of non-contact sensor data.

The MRV PCB module visualizes data by identifying the locations of smartphones stored in the cloud, sending events and service information set in those locations to the smartphone. This transfers the modified customizing information from the smartphone by the identified user to the MRV PCB module and outputs the information as a display for visualization.
MRV PCB module
Existing sensor modules construct circuit components, such as test boards and breadboards, for complex use, making it inconvenient to design functions connected to the input/output pins and cables of the open source hardware platform. From a developer’s point of view, existing modules require functional verification in the process of developing prototyping results. However, the results of prototyping are difficult to manage due to the noise of data signals from sensors connected insecurely by cables and the complexity of wiring connections. In addition, existing modules are difficult to use in a variety of environments due to their inability to work with various functions, lack of a standard platform, and inefficiency in the design testing process, hence the application of open source hardware. Open source hardware is a kit of low cost, low power, and relatively high performance that can design hardware and software in an integrated way. In particular, the general purpose input output (GPIO) is built inside the open source hardware, which allows the operating system to be set up directly from a development perspective and can be included directly on the existing microcontroller board to implement various devices or systems as well as controls.
The MRV PCB module facilitates test board circuit configuration and improved development efficiency in hardware prototyping stage. Verification of the prototyping function minimizes errors in data acquisition processes more reliably than conventional wiring connections. The MRV PCB module is conveniently and stably configured to interface between sensors, allowing various existing sensor modules to be used as a given standard and applied as needed to various sensor.
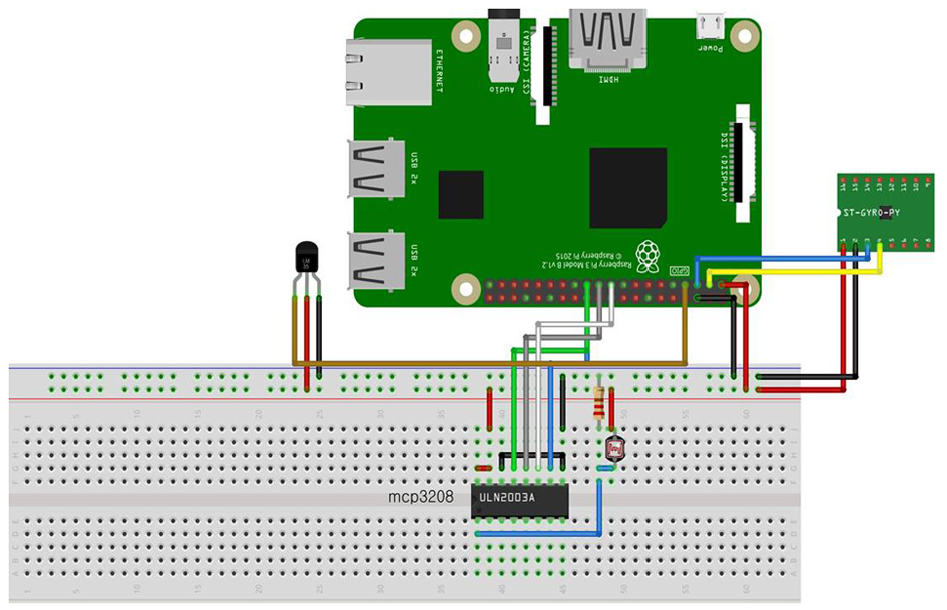
The MRV PCB module can use a prototype similar to the prototyping product for use in a variety of environments by making the appearance smaller. The MRV PCB module combines various sensors with open source hardware to provide user location and status. The gyro sensor provides data for pattern analysis by placing the problem at the target in proximity to confirm the problem generated by the target with the vibration pattern. The sensor of the camera judges whether motion within the field of view has been detected and performs real-time streaming in the x, y, and z-axes directions to the target to detect motion. The MRV PCB module uses a temperature/humidity sensor to detect the temperature of an object and convert it into an electrical signal. A temperature/humidity sensor and an illuminance sensor are installed, making it possible to detect the operation while sensing the body heat of a person inside the space and transmitting the signal. The temperature sensor of the MRV PCB module can be divided into a contact-type temperature and humidity sensor and a non-contact temperature and humidity sensor in detail. The contact-type temperature and humidity sensor can measure the temperature and humidity of the installed inside and outside to grasp the situation of the outdoor environment, while the non-contact temperature–humidity sensor recognizes the human body by detecting it from a long distance with infrared rays emitted from the body temperature. The display for the manager can grasp the heat generated by the object and confirm the distance. In addition, the administrator can ascertain the information, on the temperature and humidity, of the space by checking the inclination, acceleration, and change amount output by the real-time streaming.
The MRV PCB module has been developed in a way to conveniently and stably improve the sensor-to-sensor interface, thereby advancing the utilization of various sensor modules in response to user requirements. Various existing sensor modules can be utilized as fixed standards, and the module design is advanced to realize operation recognition functions. An optional circuit is configured on the breadboard to grasp whether the sensor module is operable. According to Figure 5, eight ports are designed for a visualization module circuit for motion sensing that consists of four sensor ports and additional ports.
Motion recognition visualization PCB module port configuration.
The A switch has been added to the MRV PCB module that can select between 3.3 and 5 V of power to supply the two I2C ports. This requires VIN, ground (GND), serial clock (SCL), and serial data (SDA) four pins; however, the arrangement order of the pins differs with respect to the module. The VIN and GND are arranged on both sides and are designed to cross one another. The serial peripheral interface (SPI) port used a fixed eight-fin arrangement based on analog-to-digital converter (ADC) connection with the MCP3208, without any variation in pin arrangement or difference in power supply between modules. The universal asynchronous receiver/transmitter (UART) port is designed to add a fully selectable switch to realize a function that minimizes variations on pinouts. GPIO ports are connected to three GPIO pins for receiving sensor data and two GPIO pins to implement and combine additional necessary functions.
Furthermore, a module with a special pin arrangement was mounted to facilitate connection to a power supply as one port. For the other ports, we designed a switch that switches between GND and GPIO pins to enable the usage of the modules with special pin assignments.
The MRV PCB module configures ports to maximize user utilization and is designed to add various ports. In the process of designing a pseudo-circuit, pin wiring of a port is connected, and primary function verification is performed in consideration of a smooth communication system. Furthermore, the additional ports are extended to support various modules and enable switching when the wirings do not coincide with each other, even in the same module.
Figure 6 shows that the MRV PCB module is modified to be combined with open source hardware and provide various sensor capabilities. The circuit diagram is prepared by considering the arrangement of the sensors and the degree of space utilization.
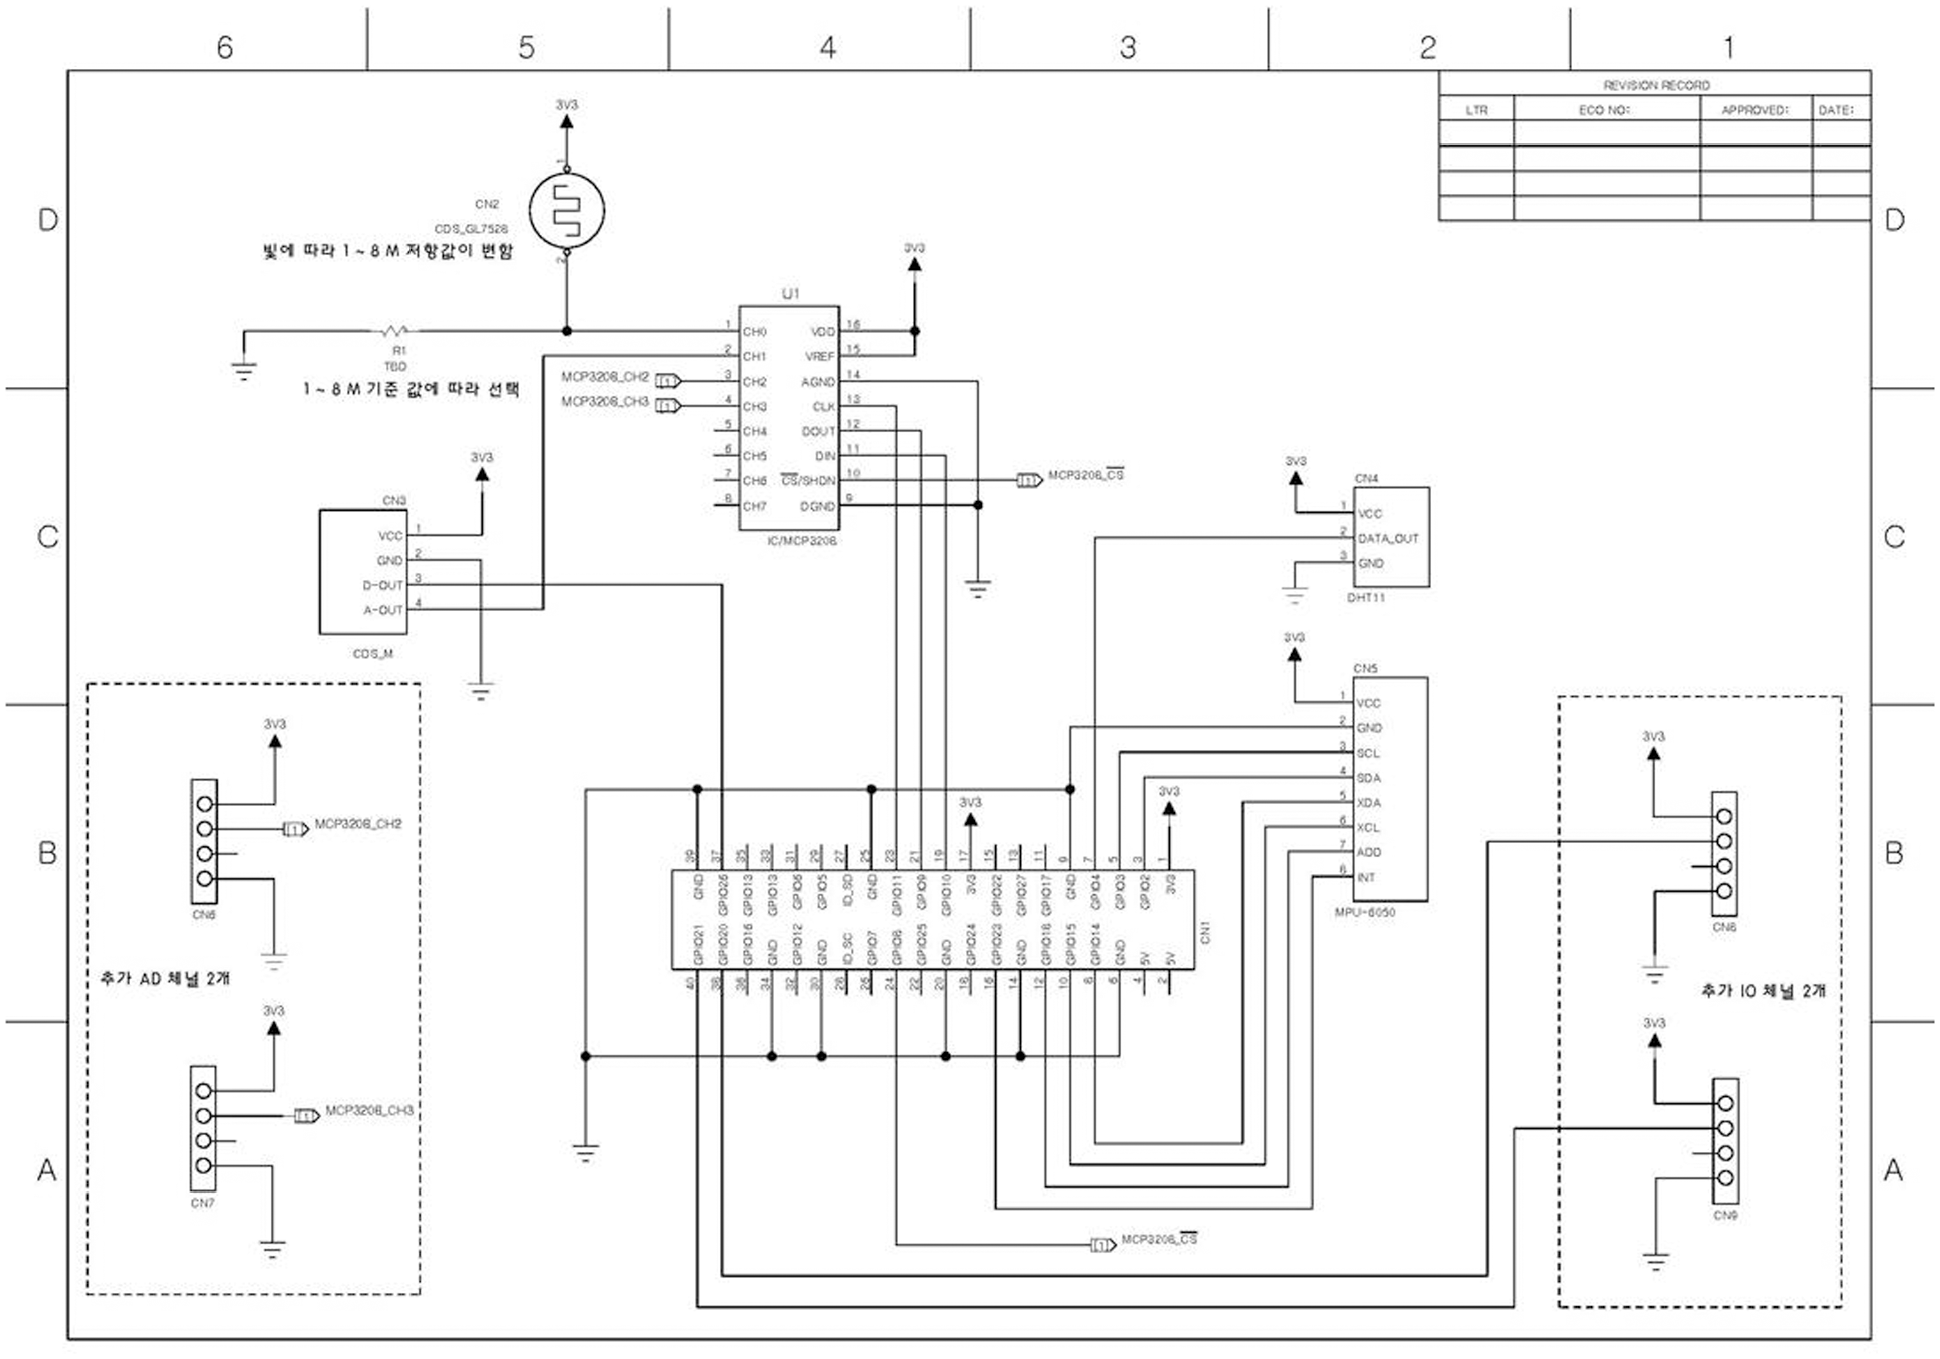
Circuit diagram of motion recognition visualization PCB module design.
The visualization module detection PCB is standardized by designing a circuit diagram and a production diagram of the PCB to produce a prototype that is operable. Figure 7 shows the connection status of each of the parts constructed for PCB production with circuit drawings for PCB production.

Artwork drawing of motion recognition visualization PCB module.
The MRV PCB module is grounded into multiple layers to identify the connected pins and minimize any potential problems in the wiring part. In this way, it is important to grasp the connection shown on the circuit diagram in the process of each layer design work. The MRV PCB module went through the primary function verification process. This secondary function verification is indispensable and is used to verify that the wiring condition of each input/output control port accords with the required standard. To verify the circuit diagram, Figure 8 shows an artwork drawing for PCB fabrication considering the required specifications.

Development of motion recognition visualization PCB module.
An input group and an output group sensor module are divided into an input module and an output module as needed for circuit design. As a result, we designed a visualization module that detects the operation to relay the input/output control, then constructed the whole system. The MRV PCB module performs secondary functional verification during the prototyping phase to make it available, as shown in Figure 9. The MRV PCB module can provide a wide range of system scalability and applicability that allows the output sensor to be connected to a cloud server and to be installed in the space through reflected sensors.

Mock-up case of motion recognition visualization PCB module.
In addition, the MRV PCB module production drawing was standardized according to the user requirements. This allows the MRV PCB module to receive real-time data, minimizing problems such as bandwidth, transmission/response time, and switch hub changes. The MRV PCB module case was verified by ensuring that the configured sensors can be safely protected in the combined situation, and that the damage can be minimized, especially when installed externally.
RTIMD monitoring system
The RTIMD monitoring system uses the non-contact hardware module for real-time streaming of the data extracted from the user’s social network service and web service. To visualize the channel, when the channel is transferred to an application server, it is stored as channel generated by the user. Data stored on cloud servers also provide interaction capabilities that enable users to visualize user data by linking their smartphones and displays.
The smartphone uploads the application program login information to the cloud server using a unique ID, where the data are stored to quickly grasp the movement of the user in real time. In addition, the cloud server stores various personal information in real time and transmits data through the open source hardware. It reconstructs the data identified through the output of user data from open source hardware, visualizes the display, and is available in the form of verification and user-friendly service platforms. Thus, the display compares the intensity of the signal collected from the user and the value of the opposite party and provides various services through the display at a short distance.
Figure 10 shows the composition of the RTIMD monitoring system configured by interlocking the MRV PCB module so that users can extract and visualize their data in real time through the NCS module.

Configuration diagram of the real-time IoT motion detection monitoring system.
The NCS module communicates with the user’s smartphone approaching the surroundings. It determines the location by sending user information and a specific ID value. The user’s smartphone uploads a unique ID value such as login information and platform access history to the cloud server through the application. The MRV PCB module, combined with open source hardware, is an internal design sensor that measures the distance and time from a moving object, and stores it on the cloud server. The cloud server configures the platform with node.js software used to develop network applications to send and receive data derived from the MRV PCB module. It receives large amounts of data from gyro sensors, temperature/humidity sensors, and camera sensors in the MRV PCB module, which is then visualized on the display while the signal is controlled for reception and operation.
The cloud server stores the ID, signal strength (dB), and user information of the various user smartphones accessed and provides data for real-time delivery of services output to the display. It compares the relative values of the signal strengths receiving the collected data and visualizes the preferred service on the display to the user at a short distance. The user’s movement remains at close range for more than 3–5 s on the display to recognize the signals and can determine output information. The cloud server operates the system in the order in which real-time stored data are sent to the MRV PCB module, which outputs to the display for visualization. The administrator system recognizes moving objects on the administrator’s display and monitors them through images sent to the cloud server. The video is transmitted and continuously verified for real-time streaming and motion detection at the installation site.
Figure 11 summarizes the operation process of the non-contact monitoring system in the operating algorithm. The non-contact hardware module connects with a user’s smartphone and accepts data and then transmits it to the open source hardware, which reads the data from the serial port, saves it in a file, and forwards it to a cloud server.

Operating algorithm of the user-customized non-contact monitoring system.
Figure 12 shows a schematic of the cloud server backing up the data in real time and synchronizing the changes every 5 s, considering the increasing amount of data.
The diagram outlining the user-customized non-contact monitoring system.
The server then stores the information on various individuals and provides a service that can be visually represented on a display. The relative values of the signal strengths collected from the users are compared to generate their preference-matched services at a distance closer to the display. In addition, if the user’s movements change for a short time, the server transmits these data to the open source hardware, which then reconstructs the identified data in the form of a user-suitable service platform, which is also shown on a display.
The cloud server can continuously back up real-time data, allowing access to information. It receives the IP address and port number of the NCS module from the cloud server.
According to Figure 13, the cloud server is set to synchronize every second every time real-time data are generated.

Result received from the user-customized non-contact monitoring system.
The collected data are stored and processed at a rapid processing speed of Hadoop-based distributed parallel data storage and large capacity big data, allowing for the use of NoSQL to support data scalability and rapid response. The collected data are temporarily stored on a hard disk of large capacity based on the kind of data. In addition, the total backup data have the space of data storage based on a seven-day cycle. Currently, cloud servers are prototyped so that there is no problem with the data capacity, but further studies are needed for testing with a distributed processing method, considering the increasing amount of data. The cloud server makes information management useful by occasionally backing up the information, and the server access right is constructed to permit access by the user’s information input.
The open source hardware that receives real-time data minimizes problems, such as bandwidth, transmission/response time, and change in switch HUB. The open source hardware visualizes the data provided by the cloud server by compressing it in the JPEG format. Furthermore, since the sharpness of the image is influenced by the recognition rate, a full HD class image is transmitted in high-quality form, which is helpful to users and can be utilized as an advantage of building a non-contact platform.
This platform provides custom services in a variety of forms, even with no other operation. The NCS module installed on the display detects the user’s smartphone and invokes the interface and the service contents set by the user, which are then updated according to the user requirements, then shown on the display. When a user entering the workplace selects a service time zone, a service, and an output interface, a user category is generated. Figure 14 shows that user data regarding interests are collected in a folder generated according to the category. The system updates the road traffic information of the public transportation to the workplace in real time under the category created by the work of a spider file used as a collection tool for the next specified information.

Visualization result of the user-customized non-contact monitoring system.
The user registers’ data information for collecting and linking data by category and processes it for confirmation. This is eliminated by checking and classifying the URL, Key, file name, title, and so on, with the aim of minimizing any duplication of the collected data. The Key continuously extracts data and generates it in a database. The collected XML data are used for database generation. When the data are collected in a file, the original file is stored in a database in the MongoDB in the form of EXCEL, comma separated values (CSV), or in the unit of a chunk in binary form. The file data stored in the Chunk units are visualized on a screen, in order to generate a table. The generated tables selectively reprocess the document or database data items required by the user through the Web User Interface (UI). When the database generator selects an XML tag collected through the API, it classifies the sensor data into itemized forms. These sensor data can be modified to provide customized content that can be shown on the display.
Figure 14 shows that visualization of the analyzed data can be used to generate an infographic to derive valuable information. The infographics transmit and visualize data derived from the NCS module and sensor data from the MRV PCB module from the real-time cloud server. In addition, the image of the Full HD class is transmitted with high quality to minimize the influence of the visibility of the image.
User-customized non-contact monitoring system is configured to view data received from NCS module and MRV PCB module in real-time and anywhere. Access to the display at a given time can be easily obtained by a system that allows users to easily share the data they want with others.
Verification for implementing RTIMD platform
The RTIMD platform applies the MRV PCB module, which can combine with open source hardware. The MRV PCB module leverages camera sensors to enable administrators to view real-time movement through position coordinates on the administrator display. The MRV PCB module utilizes image positioning method to track movement using coordinate point through camera sensor. The camera sensor of the MRV PCB module captures in real time to derive a still frame of one frame among the received image frames. It was divided into certain sizes in the form of matrices to extract pattern data along each sub-area.
The MRV PCB module extracted data continuously based on weighting of moving objects in the corresponding matrix area. The extracted pattern data are comprehensively compared and analyzed with average pattern data, previous pattern data, and current pattern data to detect the direction of the moving object. It can be tested by applying computer vision technology for accurate motion detection in a real environment. The camera sensors transmit and stream images taken in real time to the server, to visualize them in real time on the admin display. To verify the fine movement, this real-time streaming data confirm the distance based on the inclination, acceleration, and change amount. Since the camera sensor shares a visual field within a fixed range, the movement and operation of the object can be grasped from various angles. In addition, access is useful to obtain efficient image information in a variety of environments.
The RTIMD platform detects movement or the approach of the human body by real-time operation of the camera sensors, gyro sensors, temperature and humidity sensors, and Illuminance sensors in the MRV PCB module. In the installed space, the camera sensor tracks the moving object and continuously operates, while the detected object stays within the camera area for more than a period of time, streaming, and monitoring in real time.
The RTIMD platform was performed sequentially based on the algorithm shown in Figure 15.

Operating algorithm of real-time IoT motion detection platform.
The real-time monitoring provides administrators with efficient management methods through temperature/humidity and illuminance data to control peripheral devices for vibration. Illuminance sensors provide signals when detecting infrared rays and can always detect situations that occur up to 100°–120° of vision and a maximum distance of 6 m. The MRV PCB module operates in real time and detects human access, in advance, to deliver confirmation and warning messages on the admin display. The MRV PCB module controls the number of errors in the data extracted by the built-in sensor to zero. Table 2 shows the results of the MRV PCB module tested 10 times in a series of verification operations, to obtain data from each sensor. These tests confirm that the gyro sensors, temperature/humidity sensors, and illuminance sensors are operating normally and can be applied to the actual environment.
Experiment result confirming the flow of non-contact sensor data.

Gyro sensor (x, y, z) measurement.
Temperature (°C) and humidity (%) measurement.
Illuminance (lux) measurement.
The MRV PCB module installed in the space continuously determines whether motion in the field of view is detected. When streaming images are entered, they are uploaded to the server and can be checked by sending notifications to the administrator’s smartphone. The administrator’s smartphone acts as a platform for continuously detecting the situation when an error occurs in the service operation that performs real-time streaming and motion detection that observes movements in real time at the installation site.
From the management point of view, not only can the failure of the equipment be confirmed in real time but also can the prediction of an increase in the number of service users and the amount of server usage. In the event of a failure, an alarm is sent to the administrator via email, SMS, and pop-up messages to develop a real-time app system for administrators to check on the situation. Figure 16 shows that the real-time alarm system for administrators went through validation.

Real-time notification system test for administrators.
The administrator collects and supplies data to determine real-time motion detection progress in the space where the MRV PCB module is installed, such that, when an event occurs, it sends real-time status information as an email and text notification to the device previously selected by the administrator. Real-time status information automatically runs the application when the OK button is selected. The selected confirmation buttons are linked to the management site for immediate viewing of the images and can be provided in the form of reports by adding report functions to download data statistics based on time unit and duration settings to enhance operational convenience. However, the close button in the real-time connection status message can remove or mute the warning situation and at the option of the administrator, resets the notification time. When monitoring targets increase for smooth motion detection monitoring by administrators, data storage space is only expanded to ensure flexible and stable scalability. Figure 17 shows that the operation detection monitoring algorithm was designed to accurately identify the causes of failures occurring in the super-unit to ensure operational quality and quickly resolve the problem.

Motion detection monitoring algorithm.
Motion detection monitoring algorithms detect conditions above real time and determine if the system recognizes the object if it stays within the camera area for a certain period of time, for safety of the site situation. It detects intrusion through the MRV PCB module installed outside/indoor and realizes a smart environment through emergency service. As the RTIMD monitoring system recently entered an aging society, health and safety of single-person senior citizens should be considered. The RTIMD monitoring system installed in the field can quickly respond to prevent accidents if the movement of elderly people living alone is not detected. In the event of an emergency, administrators can immediately be notified via email, SMS, pop-up messages, and so on. When the administrator confirms the pop-up message within 10 s, it is recorded in the current situation breakdown and real-time video, using the motion detection monitoring algorithm, which minimizes failures by allowing administrators to access cloud servers and identify problems. The RTIMD platform detects the movement of the occupants inside and the intrusion to outsiders. This can be extended to new services by real-time detection in various environments.
The display function of the administrator is configured with the ability to grasp dangerous situations from various angles and directions, by setting it to 1–4 divided screens of dashboard, information, and camera in Figure 18. The dashboard is configured to go to any screen for the convenience of the administrator. Information details are the main content of each screen. The selected screen can be reduced/expanded, and the previous screen will switch to a mode state where the bottom menu is hidden. Additional features also provide a warning message about the cause of the problem, which can be resolved if the camera installed is defective and prevent screen information from being exposed. Cameras 1–4 divide the screens into four screens, depending on the direction and angle. When the administrator selects the screen of the desired camera to improve the management efficiency, it moves to the information page of the camera. In addition, data derived from camera sensors are represented graphically as shown in Figure 19 by transmitting position X, Y, and Z data of the object.

Operational implementation process of user-customized non-contact monitoring system.

Location coordinate data for administrators.
The data in the coordinates (location X, Y, Z) of the location are used to provide the orientation information of the moving objects in the image to arrange various data in order of size. The filter function is used to eliminate noise from other signals in the UI environment to output intermediate values of the data. To analyze a large amount of real-time data as needed, the administrator can confirm the date data with a graph by using a real-time setting function and a period setting function.
The real-time setting function shows data on temperature, humidity, and illuminance up to 1 h before the present time reference in units of 5 s, as shown in Figure 20. The period set function can select the date and time that a search needs to be performed in the input field to obtain the required data. The output of the data is graphed up to 10,000 data points, based on the selected date.

Real-time data results for temperature, humidity, and illuminance.
The MRV PCB module has been confirmed to function normally and transmit data from the administrator display in real time. This is presented in graph form from the data received through the sensor. Administrators can choose functions such as capturing, stopping, restarting, re-drawing, and changing the background, to check the exact situation. A large amount of real-time data is stored on the cloud server for verification of the server usage and server operational status for secure management. A file format desired by a manager is set, and the amount of use of the server and the operation state of the server can be downloaded in a result table. However, when the manager accesses the cloud server for the first time, after proceeding with the authentication procedure, access authority is given, and data are provided. The administrator can connect to the cloud server and request the operation sensing information of the field situation from the database with reference to the date, time, and day of the week, so as to query the data. Thus, the administrator performs a verification test with the test items displayed in Table 3 for efficient management and operation of the IoT operation sensing platform.
Verification experience for the IoT motion detection platform.

IoT: Internet of Things; PCB: printed circuit board.
The NCS module has determined that the number of errors encountered during radio transmission measurements is zero. The NCS module records the presence or absence of operational data transmission for practical use. The MRV PCB module identifies control errors of gyro sensors as well as those of temperature and illuminance sensor operation, when detecting objects.
The test items include the number of errors in the visualization module operation for motion detection, real-time monitoring performance, and data information transmission to the administrator’s display.
The real-time monitoring cameras were checked to ensure that historical data were stored regularly on cloud servers. The administrator’s display confirmed that the data information was sent to the server within an average of 2 s. As shown in Table 4, the NCS module conducted 10 operation test and 10 verification tests.
Experiment result of transmitting data information for administrator’s display.

The minimum required time was 203 ms (2.03 s), while the maximum required time was 227 ms (2.27 s) for the first 10 operation tests. The average time required for the primary verification was 215.8 ms (2.158 s), and the transmission was completed in approximately 2 s. The minimum required time was 206 ms (2.06 s), while the maximum required time was 231 ms (2.31 s) for the second 10 verification tests. The average time required for the secondary validation was 216.3 ms (2.163 s), and as with the primary validation, the transfer time was verified within 2 s.
It is required to verify that the information detected during operation is transmitted to the server within an average of 2 s. The MRV PCB module transmits real-time data from an average of 2 s to approximately 2.2 s per duration. The visualized data for motion sensing are transmitted in real time from an average of 2 s to about 2.2 s at every required time without deviation.
Even in poor Internet environment, real-time data transmission can be performed without any sufficiently large problems by maintaining a speed of about 50% of a normal Internet environment. In addition, the success rate of the data reception in the server is 100% every 20 times, and data can be completely transmitted and received.
The results of these tests confirmed the credibility of the RTIMD platform and the improved performance. With open source hardware, the RTIMD platform can implement an effective real-time monitoring and recognition system through the non-contact hardware module and MRV PCB module, thus quickly solving problems that occur in spaces where real-time recognition monitoring system is installed and minimize damage. The data file can store tangible data by selecting the folder based on its characteristics and format. This provides a confirmation message that data can be easily extracted by using the extracted data source in a situation connected in real time and specific details can be grasped. The confirmation message is presented so that a background process for extracting data can be started, and the data can be stored in the library at a specified position. The extracted data can be added, selected, edited, and removed from the characteristics, and can be continuously updated.
Conclusion
As it was recently established as an IoT platform with additional functions based on user preferences, it receives real-time information regardless of time or place. A user-conforming service requires continuous research to improve convenience and efficiency by providing a service adapted to the user situation. To visually present data desired by a user in real time in an IoT network environment, this study developed an RTIMD platform that can confirm real-time image data by a custom-made service providing and seal paper system without the user’s operation. The RTIMD platform has developed a system by applying a non-contact hardware module and MRV PCB module based on open source hardware. The NCS module transmits a specific ID value for a smartphone that is approached around up to 80 m. The user’s smartphone uploads a unique ID value such as login information and platform access history to the cloud server through the application. When a service application developed by the SDK is run on a smartphone, it recognizes the ID value and transmits it to the cloud server, which stores the ID, signal strength (dB), and user information of the various user smartphones accessed, and provides data for real-time delivery of services output to the display. Through combination with open source hardware, the non-contact hardware module developed an efficient management system that can proactively track data failures while transmitting real-time data. The fault management of the data was verified by measuring the response rate of the real-time data sent to the display via an application for administrators. The MRV PCB module visualizes data by identifying the location of smartphones stored in the cloud, sending events and service information set in those locations to the smartphone. It compares the relative value of the signal strength receiving the collected data and visualizes the preferred service on the display to the user at a short distance. The user’s movement remains at close range for more than 3–5 s on the display to recognize the signals and determine output information. The motion revision visualization PCB Module has been developed with an I/O control module that can be used by integrating the gyro sensor, temperature sensor, Illuminance sensor, and camera sensor. The gyro sensor checks the distance with respect to the location of the object. It was divided into specific sizes in the form of matrices to extract pattern data along each sub-area. The MRV PCB module extracted data continuously based on weighting of moving objects in the corresponding matrix area. The extracted pattern data are comprehensively compared and analyzed with average pattern data, previous pattern data, and current pattern data to detect the direction of the moving object.
The camera sensor captured motion in the visual field in the x, y, and z directions in real-time streaming. The Illuminance sensor monitors the real-time temperature inside the installed space, and the temperature sensor detects heat from a person and sends signals to detect movement. The MRV PCB module utilizes image positioning method to track movement using coordinate point through camera sensor. The camera sensor of the MRV PCB module captures in real time to derive a still frame of one frame among the received image frames. The real-time monitoring was performed to control the vibration, temperature, and illumination data from the installed space by controlling the vibration peripherals and the error frequency to be zero. In addition, the PCB module for MRV consisted of a mounted gyro sensor, temperature/humidity and sensor, and illuminance sensor, which were tested 10 times in a row to check normal operation. For the first verification 10 times, the minimum required time, maximum required time, and average required time were 2.03, 2.27, and 2.158 s, respectively.
A display for managers can identify the real-time output of slope, acceleration, and variation in the temperature and humidity information of the space. From the management point of view, not only were the equipment failures confirmed in real time but also were the prediction of increase in service users and the amount of server usage. In the event of a failure, an alarm is sent to the administrator via email and SMS so that the status can be developed to provide a message to be connected in real time to be processed when an operation fault occurs in a situation in which operation sensing is progressing in real time. The message of the real-time connection state provides current status information, and when a confirmation button is selected, an application program is automatically executed to quickly solve the problem. The administrator’s display and data information were confirmed to be transmitted to the server in real time within an average of 2.2 s. Even in poor Internet environment, it was able to maintain a speed of about 50% of the normal Internet environment. The success rate of receiving data from the server was 100% in all 20 cases, ensuring that data are fully transmitted and received. The administrator utilized the real-time and period setting functions to check the date data graphically, hence analyze a large amount of real-time data as needed. Hereafter, the RTIMD platform can be expanded to smart devices connected with various other devices, and customized information can be provided. Further described platforms have recently been used to meet consumer interest in art and culture.
Footnotes
Handling Editor: Pascal Lorenz
Declaration of conflicting interests
The author(s) declared no potential conflicts of interest with respect to the research, authorship, and/or publication of this article.
Funding
The author(s) disclosed receipt of the following financial support for the research, authorship, and/or publication of this article: This work was supported by the BK21 Plus Program (Interdisciplinary Human-Centered Service Design, 31Z20130012925) funded by the Ministry of Education (MOE, Korea) and National Research Foundation of Korea (NRF).