
Abstract
As concrete is a building material that is widely used in the field of infrastructure construction, and its quality is related to the quality and service life in infrastructure engineering, concrete strength is an important reference index that reflects the concrete quality. Based on this, two commercial concretes A and B are selected in Henan Province, China, to perform the concrete strength test under same condition curing and standard condition curing in the pull-out post-insert method, cubic compression, rebound method, and drilling core method. The relationships between the different curing conditions, cubic compressive strength, core sample strength, rebound strength, and pull-out force of different commercial concretes are compared and analyzed. Through a comparative analysis and while considering the convenience and accuracy requirements, the strength curves of the two different concretes based on the pull-out post-insert method were fitted and analyzed, and the local strength curve test in Henan based on the pull-out post-insert method was established. The research results provide technical support for evaluating the strength of concrete structures using the pull-out post-insert method, which has important engineering significance for improving the popularize and application of the pull-out post-insert method.
Keywords
Introduction
Concrete is one of the most widely used materials in highway engineering, bridge engineering, and construction engineering owing to the advantages of its convenient material selection, low price, and durability. Concrete strength is the core property considered in concrete quality control, an important basis for structural design and construction, and one of the most important properties of concrete. 1 Therefore, one of the important components of structural safety assessment is the determination of concrete strength. At present, concrete strength testing methods are mainly categorized as non-destructive testing methods and semi-destructive testing methods. The non-destructive testing method comprises a direct estimation of the concrete strength without affecting the mechanical properties of the structure or member or other functions of use. 2 In the semi-breakage detection method, samples are directly obtained from the structure for a strength test without affecting the overall performance of the structure, or a local damage test is directly performed at the appropriate parts of the structure, and the concrete strength value is then calculated based on the test results. The methods commonly used in the engineering field in China to test the strength of concrete include the rebound method, ultrasonic method, core drilling method, and extraction method. The core drilling and extraction methods are semi-damage detection methods. The rebound and wave velocity values obtained in the rebound method and ultrasonic method tests are not directly related to the concrete strength but can be used as a parameter to indirectly reflect the concrete strength. Although the core drilling method is the most direct and reliable method for testing the strength of concrete, as the core drilling method directly causes local damage to the concrete structure, an excessive number of test points should not be used in the core method, and the test points should avoid the stress components in particular. The main force parts combined with the high cost of the core test, if the large number of structures are tested, it will cause labor and cost, so it is worth the loss, and the extraction method is between the two, its operation method is relatively simple and easy, and can ensure sufficient detection accuracy.
The extraction method is divided into two types according to the time when the anchor is buried in the concrete; in one type, the position of the anchor is first determined, and the concrete is then poured, which is called the pre-embedded extraction method (LOK test); in the other type, the concrete is cast first. In the pull-out post-insert method (CAPO test), holes are drilled in the hardened concrete surface and the anchors are then placed. The pull-out method was originally used in the Soviet Union, Perfilieffc. 3 In 1930, a steel bar was buried in concrete, and after the concrete was hardened, the steel bars were pulled; only the steel bars were pulled out. The reason for the failure in this test was the bond failure between the steel and concrete—not the failure of the concrete itself. Since then, Soviet engineers Volf and Gershberg have improved the anchors and used spherical anchors of a diameter greater than the anchor. In this case, when the anchors were pulled out, it resulted in the concrete cones being pulled out as well. In 1938, BG Skramtajew 4 presented the pull-out post-insert method while summarizing Volf’s pre-emergence method as follows. A hole was drilled at the test point, the diameter of which was larger than that of the Volf anchor, and the Volf anchor was then buried in the hole. It was then caulked using a fast hard high-strength mortar, and the pull-out test was performed several days later.
In 1944, Tremper 5 in the United States performed the pull-out test on concretes of different ages, different water-to-binder ratios, and different coarse aggregates. Through a regression analysis, the correlation between the pull-out force and concrete compressive strength was obtained. The experiment showed great improvement over the Volf method both in scope and in establishing relationships. At the same time, Japanese scholars also studied the extraction method. As the dimensions of the anchor and reaction force support are different, different regression formulas are obtained for the pull-out force and compressive strength. In the late 1950s, the idea of developing the pre-embedded extraction method into a standard test method was presented. Based on this, Kierkegaard–Hansen 6 performed several experiments to explore the transformation of the extraction method into a standard test and demonstrated its feasibility. The inner diameter of the reasonable reaction force support is 55 mm, anchor head diameter is 25 mm, and buried depth is 25 mm in the famous LOK test. In 1975, Petersen 7 of Denmark highlighted the shortcomings of the pre-embedded extraction method. If the pre-embedded extraction method is used, the anchors must be placed and buried at a predetermined position before the concrete is poured. Therefore, the structural concrete cannot be inspected at any time and any place. Furthermore, owing to the low flexibility, the pull-out post-insert test was proposed. In the pull-out post-insert method, the concrete is hardened, the surface is drilled, the groove is cut, and the anchor is buried; the anchor is then pulled out, and the strength of the concrete is estimated according to the pulling force. The concrete embedded in the anchor can also be pulled out at any time. The principle of this test, state of the concrete under stress, size of the stressed part, equipment used to apply the pull-out force, and concrete pull-out force obtained from the test are exactly the same as those of the LOK test. The difference between the two tests is that this test does not require the placement of test points and anchors before the pouring of the concrete.6,7 In the aforementioned test, a special machine was used to drill at any selected location, after the structural concrete was hardened, to enlarge the root of the hole and to embed a patented expandable expansion ring. The oil pump and the jack of the LOK test were then used to apply the pulling force to the concrete. In 1986, Japan’s Y Kosaka 8 proposed that the compressive strength decreases with the increase in the coarse aggregate size of concrete, and the pull-out force increases with the increase in the coarse aggregate size of concrete. Therefore, the influence of the coarse aggregate particle size on the estimation accuracy of the concrete compressive strength should be considered. At the same time, it is proposed that if the slip of the anchor is neglected when calculating the pull-out force, the concrete strength obtained using the pre-embedded method is greater than that of the pull-out post-insert method; however, if the anchoring accuracy can be improved and the strength estimation is performed accurately when the amount of anchor slip is measured, the pull-out post-insert method can also be used to accurately estimate the concrete strength. By the 1980s, the extraction method was recognized by technical standards organizations in many countries, and some influential technical standards organizations listed the trials as standard test methods.9–13
In the late 1980s, China began a pilot study on the strength of concrete after the pull-out post-insert method test was conducted. In 1985, the concrete room of the Railway Engineering Research Institute 14 developed the TYL-I with reference to the dual-purpose tester of LOK test (pre-buried method) and CAPO test (post-installation method) produced by Danish Germann Aps. type concrete strength puller. Owing to the shortcomings of the TYL-I type pull-out instrument, the Railway Engineering Research Institute improved it and manufactured the TYL-II pull-out instrument. The new pull-out instrument has a digital display system with a peak hold and self-test functions and is easy to operate. The above two instruments are circular ring pull-out instruments. In addition, China has also developed a three-point support type pull-out instrument, 15 which has been widely used in engineering quality inspection. The China Academy of Building Research, 14 Harbin University of Civil Engineering and Architecture, and Beijing Municipal Construction Engineering Corporation have successfully developed complete sets of equipment of various sizes for pull-out post-insert and extraction suitable for China’s actual conditions. On the basis of the relevant research results, in 1994, China’s “Technical specification for Inspection of concrete strength by pull-out post-insert method” (CECS 69:1994) 16 was promulgated. In 2011, through the revision and improvement, the new standard “Technical specification for test of concrete strength by pullout method” (CECS 69:2011) 17 was implemented. Jin Nanguo, a teacher from the Department of Civil Engineering of Zhejiang University, and Jin and Jin 18 and Song, 19 studied the adhesive extraction method. After the concrete is hardened, the surface is drilled and the anchor is buried. The fast curing adhesive anchoring is a test method for extracting the anchor after the hardening of the adhesive and estimating the strength of the structural concrete according to the pulling force. The expansion plug extraction method is the same as the glue extraction method. After the concrete is poured, the anchored concrete surface is drilled, the anchor is embedded, and the pull-out test is then performed. The difference between the two tests is that the former is anchored with a high-strength, fast-curing adhesive, and the anchor is pulled out after the adhesive is hardened. The expansion bolt is extracted using an expansion bolt as an anchor. China’s extraction method is widely studied, not only for the extraction test of ordinary concrete, but also for the extraction test of lightweight aggregate concrete, shotcrete, and high-strength concrete. 20 L Bu and C Liu 21 tested the strength of ultra-high-strength concrete with the method of cast-in-place pull-out and pull-out post-insert, which verified the applicability of the method of pulling out on the strength of ultra-high strength concrete, and used the least square method to fit the test data and calculate various parameters of the regression equation. The results show that all kinds of parameters are in a reasonable range, so the pull-out method is applicable to the conclusion of testing the strength of ultra-high-strength concrete. Through comparison, it is found that the method of cast-in-place pull-out is more accurate under the same material, the measurement curve of ultra-high-strength concrete is similar to that of steel fiber mortar, and the detection range of pull-out post-insert method is wider than that of cast-in-place pull-out method. L Bu and J Li 22 also tested the compressive strength of poly (propylene alcohol) fiber cement mortar by pull-out post-insert method, drew the conclusion that pull-out method is also applicable to the detection of cement mortar and composite cement mortar, and gave the strength curve. H Chen et al. 23 selected representative raw materials in this region to prepare concrete specimens with strength grade of C10–C60 respectively, and conducted tests on rebound, pull-out method, rebound pull-out synthesis method and compressive strength comparison, and gave the local strength measurement curve of rebound pull-out synthesis method. It is found that compared with the single method, the relative error is smaller, and the detection accuracy is higher. X Chen et al. 24 by cyclic tensile compressive test and consider three kinds of strain rate (10−6 s−1, 10−5 s−1, and 10−4 s−1) and four kinds of unloading stress, strain rate, and the unloading stress is studied the influence of mechanical properties of concrete, and the stress strain model was established, finally, Weibull distribution model is introduced after the peak of concrete under monotonic and cyclic loads of damage evolution were analyzed. It is found that the amplitude of the participating strain and the non-classical compressive strain increases with the increase of the non-classical strain pair, and the non-classical tangent modulus decreases with the decrease of the unloading stress. The accumulation of non-classical deformation in the continuous cyclic loading process degrades with the stiffness of the material. In the process of tensile loading, the failure probability increases with the increase of non-classical strain. When the unloading curve reaches the compressive stress, the compressive stress will not increase the failure probability of concrete. Then in 2019, X Chen et al. 25 conducted cyclic direct tensile test, high temperature test, and monotonic direct tensile test on concrete, and studied the influence of cyclic damage and high temperature on the residual tensile performance of concrete. The results show that the residual tensile strength and elastic modulus of damaged concrete decrease with the increase of cyclic damage. Under high temperature environment, the micro-cracks and pores caused by water evaporation, hydration product decomposition, and incompatible thermal stress lead to the reduction of tensile strength and stiffness, the increase of peak strain and obvious nonlinearity. The influence of temperature on residual mechanical properties decreased with the increase of cyclic damage. The pre-peak branch of the residual tensile stress–strain curve changes from linear to non-linear, and the post-peak branch changes from steep to gentle.
The national standard “Technical specification for inspection of concrete strength by pull-out post-insert method(CECS 69:94)” was promulgated by the China Engineering Construction Standardization Association Standard in 1994 and revised in 2011 (CECS 69:2011), but there are many factors influencing the pull-out post-insert method. China has a vast territory. Many varieties of concrete are used in various places in China, and the raw materials used are obtained from scattered locations. Thus, the province has a significant impact on the accuracy of the national unified pull-out post-insert method. 26
Based on this, two representative brands of commercial concrete in Henan are considered as the research objects, and the regional strength curve is establishes for the concrete after performing the loading and unloading method used in Henan.
Concrete strength test design
This test mainly includes the pull-out post-insert pull-out test, cubic compressive strength test, core drilling method, and rebound method.
Test equipment and method of use
Pull-out post-insert test equipment and operation
The SHJ-40-type pull-out instrument produced by Hangzhou Sansi Instrument Co, Ltd. is shown in Figure 1. The diameter of the drill hole of the three-point pull-out test device of the rear loading and unloading method is d1 = 22 mm, the hole depth is 65–75 mm, the working depth is 45 mm, and 20–30 mm is reserved for mounting the anchor and containing the dust. The grinding groove is at a distance of 35 mm from the orifice, the groove width is 10 mm, the diameter of the reamed annular groove is 30 mm, and the reaction force supporting the inner diameter, d3, is 120 mm. The pull-out force value is then determined according to the national “Technical specification for test of concrete strength by pullout method” (CECS 69:2011); 17 for each pull-out test piece, the center of the four pouring sides is considered as the pull-out point during drilling using a tabletop drill. The hole is drilled using a bench-top rotary drill, the concrete inside the drill hole is cleaned out, the grinder is used to grind the grooves perpendicular to the borehole wall, the anchor and puller are installed, and a continuous and even pull-out force of 1 kN is then applied to the concrete. After cracking damage is observed, the force reading on the display stops increasing, and the limit pull-out force value F is recorded with an accuracy of up to 0.1 kN. Eventually, the concrete is pulled out of an inverted cone.

Three-point pull-out test device schematic: (a) The internal structure, (b) SHJ-40 Multi-function strength tester and digital pressure gauge and (c) Pull-out instrument after installation.
Rebound method experimental instrument and operation
In this test, the HT225A-type rebound hammer produced by Tianjin Construction Instrument Factory with the factory number 05-214 is adopted, as show in Figure 2, and tests are conducted according to the “Technical specification for inspecting of concrete compressive strength by rebound method” (JGJ/T 23-2011). 27 Select 16 evenly distributed measuring points in the 200 mm × 200 mm area on the side of the test block for the test. The arrangement of measuring points is shown in Figure 3. Under the pressure of maintaining 30–50 kN, bounce at the above 16 points, push the bounce bar against the surface of the concrete, gently press the instrument, release the button, and slowly push the bounce bar out. Make the instrument apply slow and uniform pressure on the concrete surface, and rebound after the hammer is released from the hook, and the pointer moves backward and stays at a certain position, which is the rebound value. Continue to resist the concrete surface and after reading and recording the rebound value, gradually reduce pressure on the instrument, make the rebound value of the measured member or structure can be measured by repeating the above operation. During operation, the axis of the instrument should always be perpendicular to the concrete surface of the member.

HT225A rebound hammer.
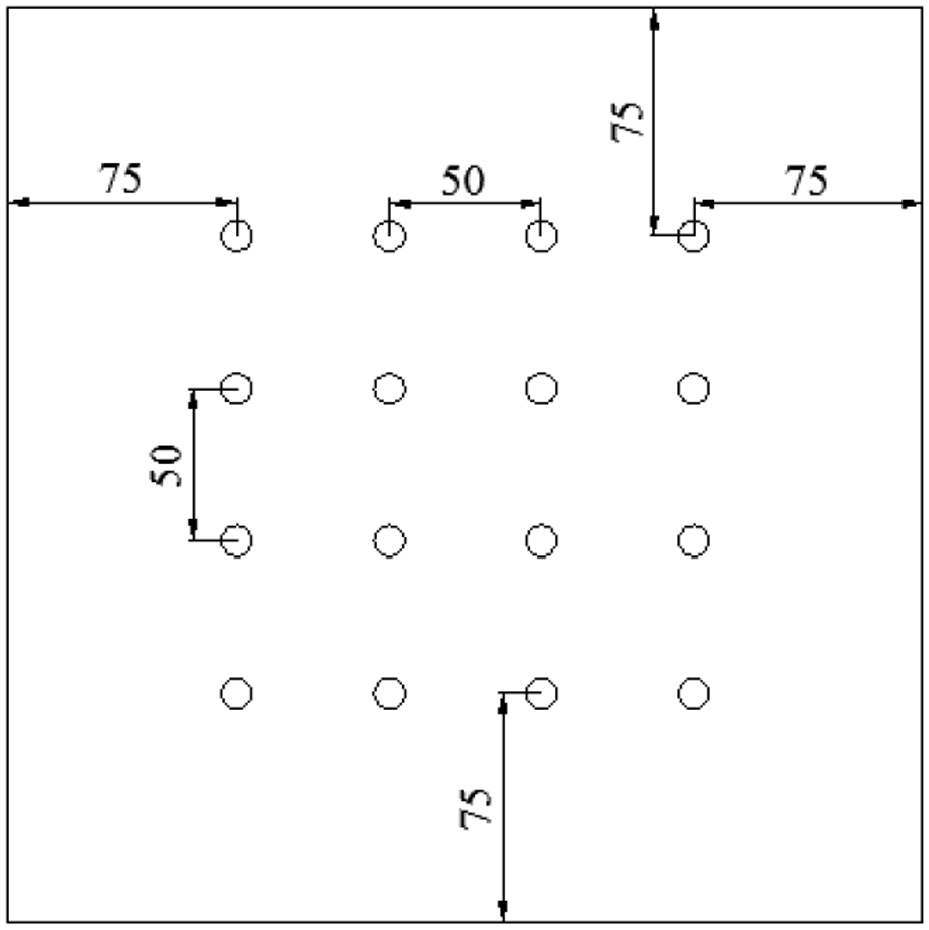
Distribution of rebound detection points.
Cube strength compression equipment and operation
In this test, the cubic compressive strength test instrument uses the TYA-2000 electro-hydraulic pressure tester manufactured by Wuxi Xinluoda Instrument Equipment Co, Ltd. The maximum test force of the pressure tester is 2000 kN, as shown in Figure 4. After the cube compression test block is cured to the specified age, the test and calculation are performed according to the national standard “Standard for test method of mechanical properties on ordinary concrete” (GB/T 50081-2002). 28 The strength of the concrete cube is determined according to the concrete strength. The relevant provisions of the “Standard for evaluation of concrete compressive strength” (GB/T 50107-2010) 29 are met. Dry the water on the surface of the block, block surface dry naturally after the bearing plate under electric hydraulic pressure testing machine at the center of the circle area, the pressure on the surface of test shall be the block forming when the top surface of the vertical, to start the machine, at 1.5 −2.5 kN/s to the loading speed for continuous uniform load until the test block, when the display reading no longer increases when the record of the monitor readings, which block the destructive load, three test cube test results to determine the group on behalf of the compressive strength value of the block.
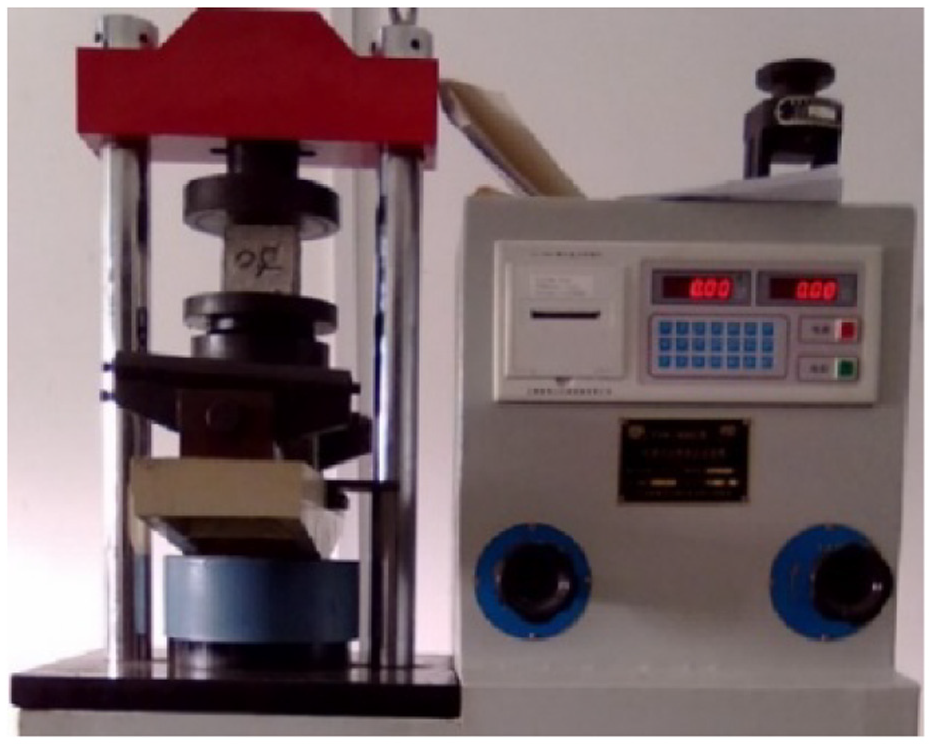
TYA-2000 electro-hydraulic pressure testing machine.
Core drilling operation
According to the relevant regulations of the “Technical specification for testing concrete strength with drilled core method” (JGJ/T 384-2016), 30 the core sample obtained must be processed and cured. First, the core sample diameter and height should be measured before processing the core sample. The cutting conditions are determined, and the flatness of the core sample is observed to determine whether it is required to be filled with cement mortar. After the core sample is filled, it is required to be placed in the room for 1–2 h and then sent to the curing room for 3–4 days for conducting a pressure test.
Specimen design, processing, and maintenance
Concrete materials and mix ratio
This test study is conducted on A and B commercial concrete. The concrete materials of various strengths used are shown in Tables 1 and 2. The cement performance of each strength concrete is in full compliance with the current national standard “Common portland cement” (GB 175-2007). 31 The regulations for concrete of various strengths comply with the current national standards of “Sand for construction” (GB/T 14684-2011), 32 “Pebble and crushed stone for building” (GB/T 14685-2011), 33 and “Standard for technical requirements and test method of sand and crushed stone (or gravel) for ordinary concrete” (JGJ 52-2006). 34 The strength range is C15–C60 (10 strength grades of C15, C20, C25, C30, C35, C40, C45, C50, C55, and C60). The concrete components are water, cement (silicon), sand (medium sand), stone (5–20 mm gravel), an admixture of fly ash/mineral powder, and an admixture of high-performance water reducer.
Raw materials of various grades of concrete and their usage per cubic meter (concrete A).
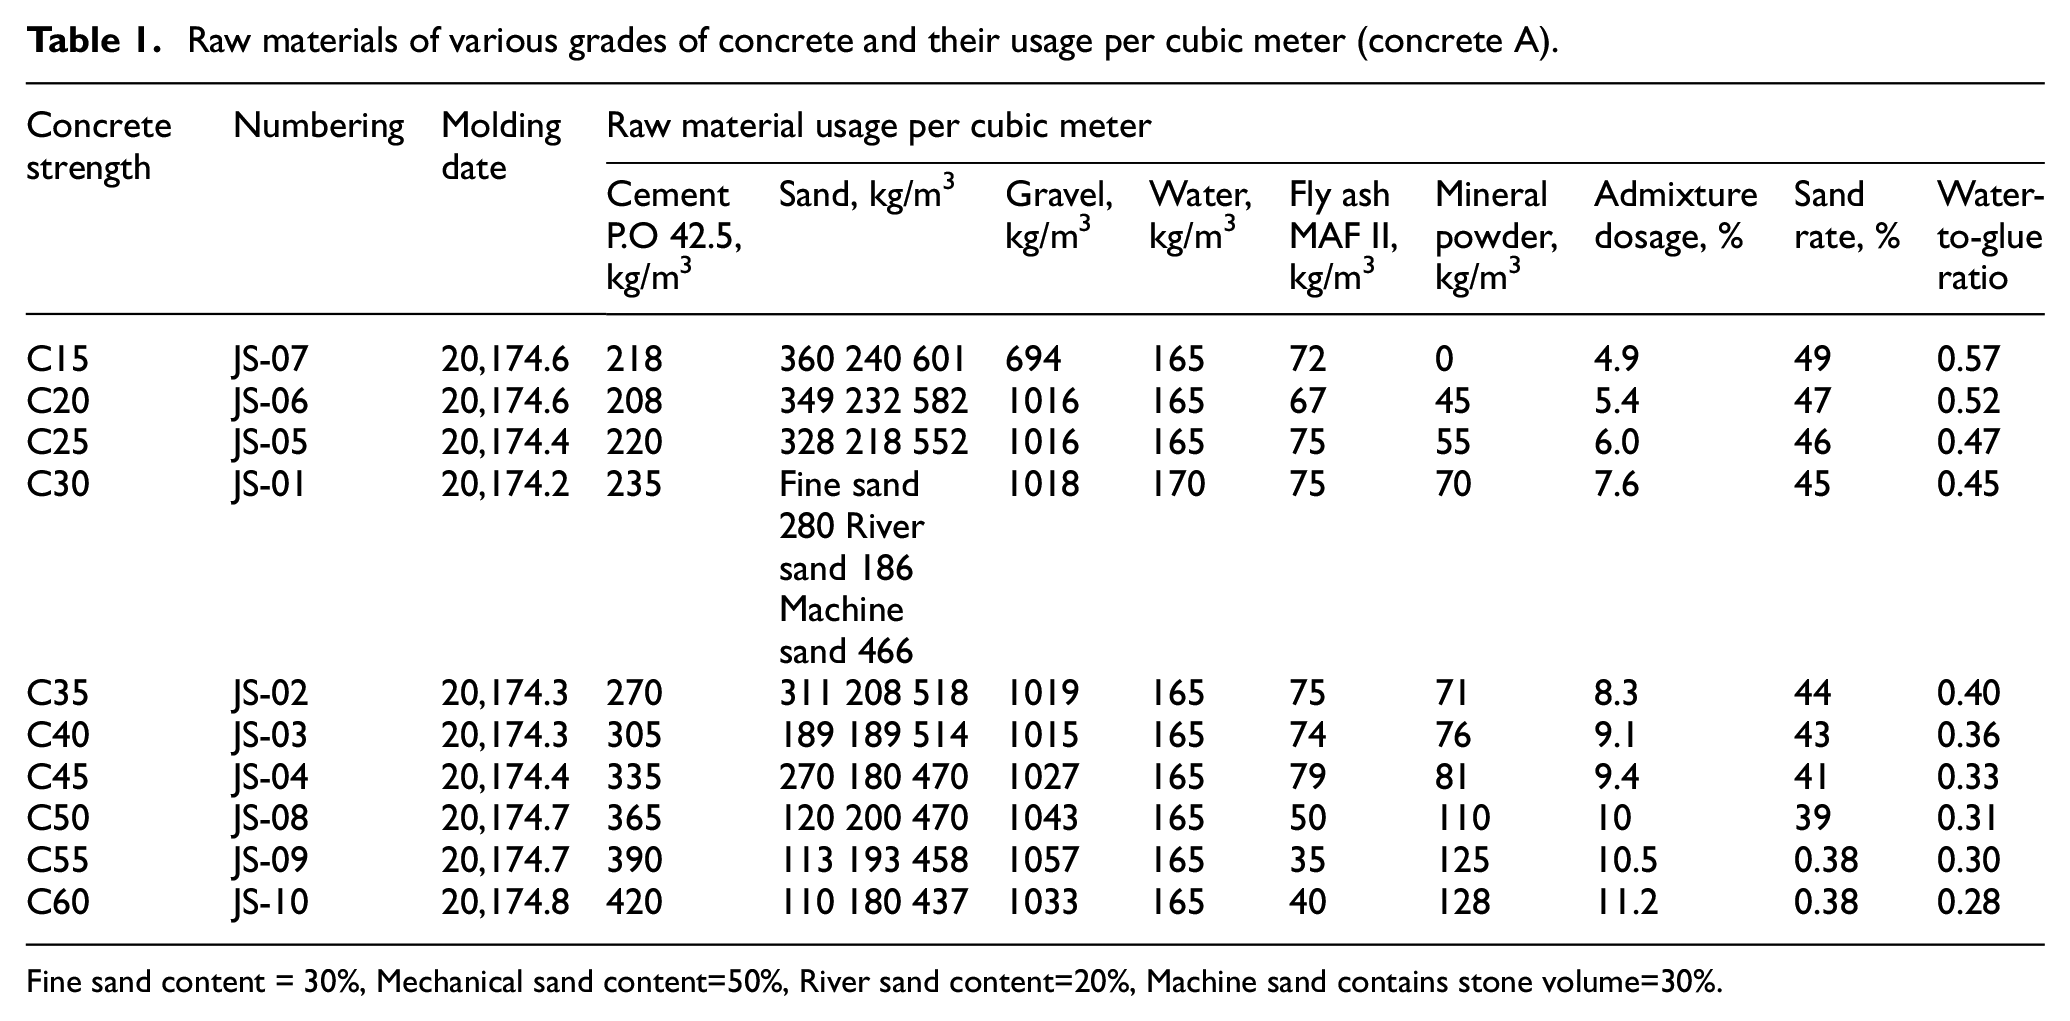
Fine sand content = 30%, Mechanical sand content=50%, River sand content=20%, Machine sand contains stone volume=30%.
Raw materials of various grades of concrete and their amount per cubic meter (concrete B).

Test piece production and curing
1. Pull-out test piece: the concrete test piece size is 500 mm × 300 mm × 250 mm, and each test piece is molded into two test pieces per age, exhibited in Figure 5.
2. Cube compressive strength test block: the concrete cube test piece size is 100 mm × 100 mm × 100 mm, and each strength class is divided into two groups (three pieces each) for each age.

Molded test piece.
The pull-out test piece and the cubic compressive strength test block of each test piece were fabricated from the same plate concrete and simultaneously vibrated on the same vibration table.
3. Test piece curing: as this test requires a comparative test of the same condition curing and standard curing, the test pieces of the two commercial concretes A and B are, respectively, divided in two groups for two methods. For one group, the standard curing is adopted. The test blocks are cured in a standard room at 20°C ± 2°C and humidity greater than 95% for 28 days; the other group is cured under the same conditions, and the test blocks are prepared by sampling at the concrete pouring site. The specimens produced by the on-site sampling are cured according to the curing conditions of the structural entities on the site (i.e. placed near the components). The compressive strength values of the test blocks of this condition can better reflect the concrete strength of the structural entities. The curing conditions at natural exposure was 28 days.
Data collection and test results
1. Value of the tensile strength of the test piece
After the pull-out test, according to the relevant provisions of the “Technical specification for test of concrete strength by pullout method” (CECS 69:2011), 17 three pull-out forces are measured on each of the pulled-out test pieces. If the difference between the maximum and minimum pull-out forces and the middle pull-out force is less than 15% of the intermediate pull-out force, the average of the three calculated values should be considered.
2. Determination of compressive strength of test pieces
According to the relevant provisions of “Standard for evaluation of concrete compressive strength” (GB/T 50107-2010), 29 the compressive strengths of the test pieces are determined. The data processing shall be performed in accordance with the following provisions:
The arithmetic mean of the strengths of the three test pieces is taken as the representative value of the strength of each test piece.
When the difference between the maximum and minimum values of the strength of a set of test pieces exceeds the intermediate value by 15%, the intermediate value is taken as the representative value of the strength of the test piece.
When the difference between the maximum and minimum strengths of a set of specimens and the intermediate value exceeds 15% of the intermediate value, the strength of the specimens should not be used as the basis of the evaluation.
Test results under standard curing (Table 3–8)
Test results of core strength (core strength and cubic compressive strength) corresponding to the concrete pull-out strength of different strength grades under standard curing (concrete A).

Test results of core strength (core strength and cubic compressive strength) corresponding to standard curing and concrete strength resistance of different strength grades (concrete B).
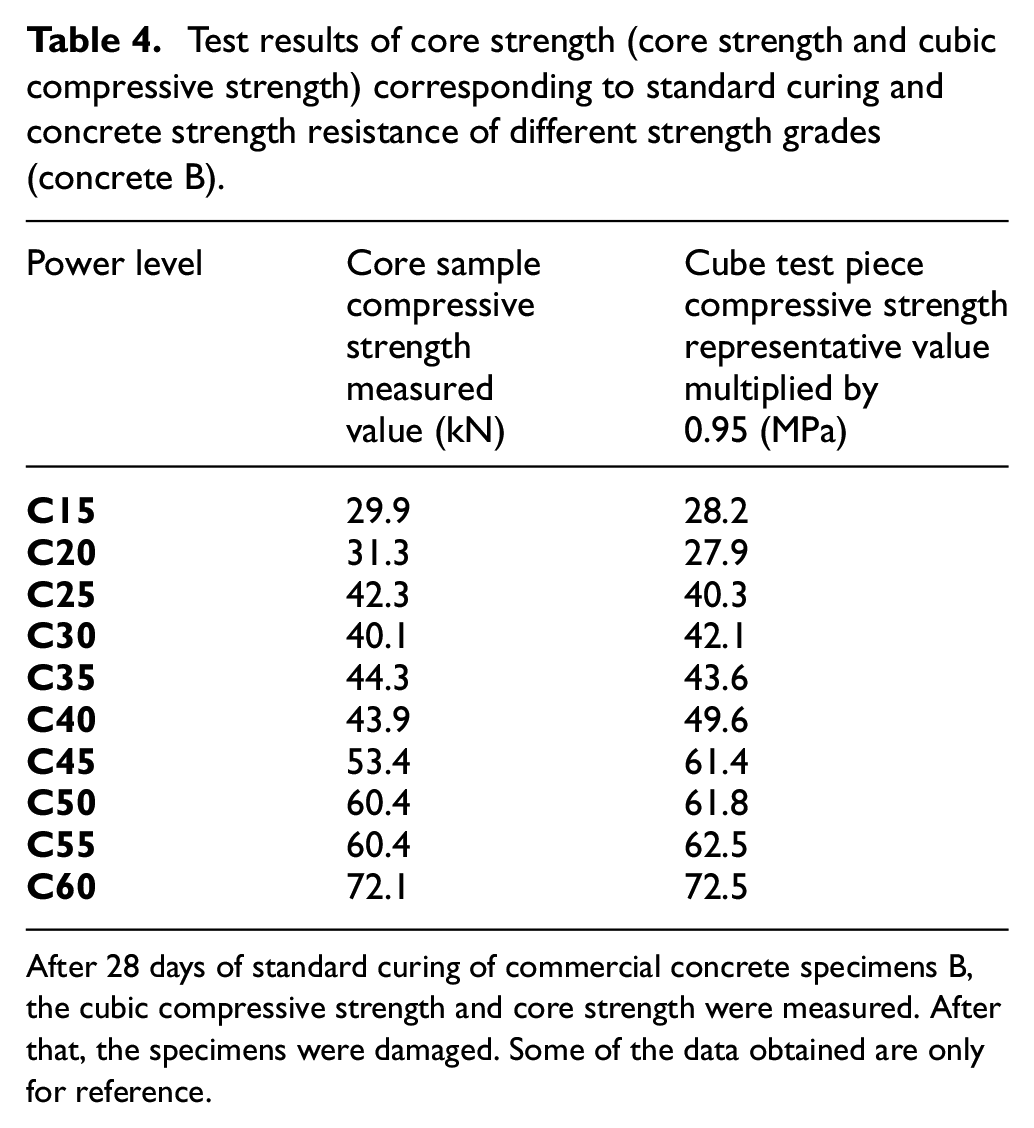
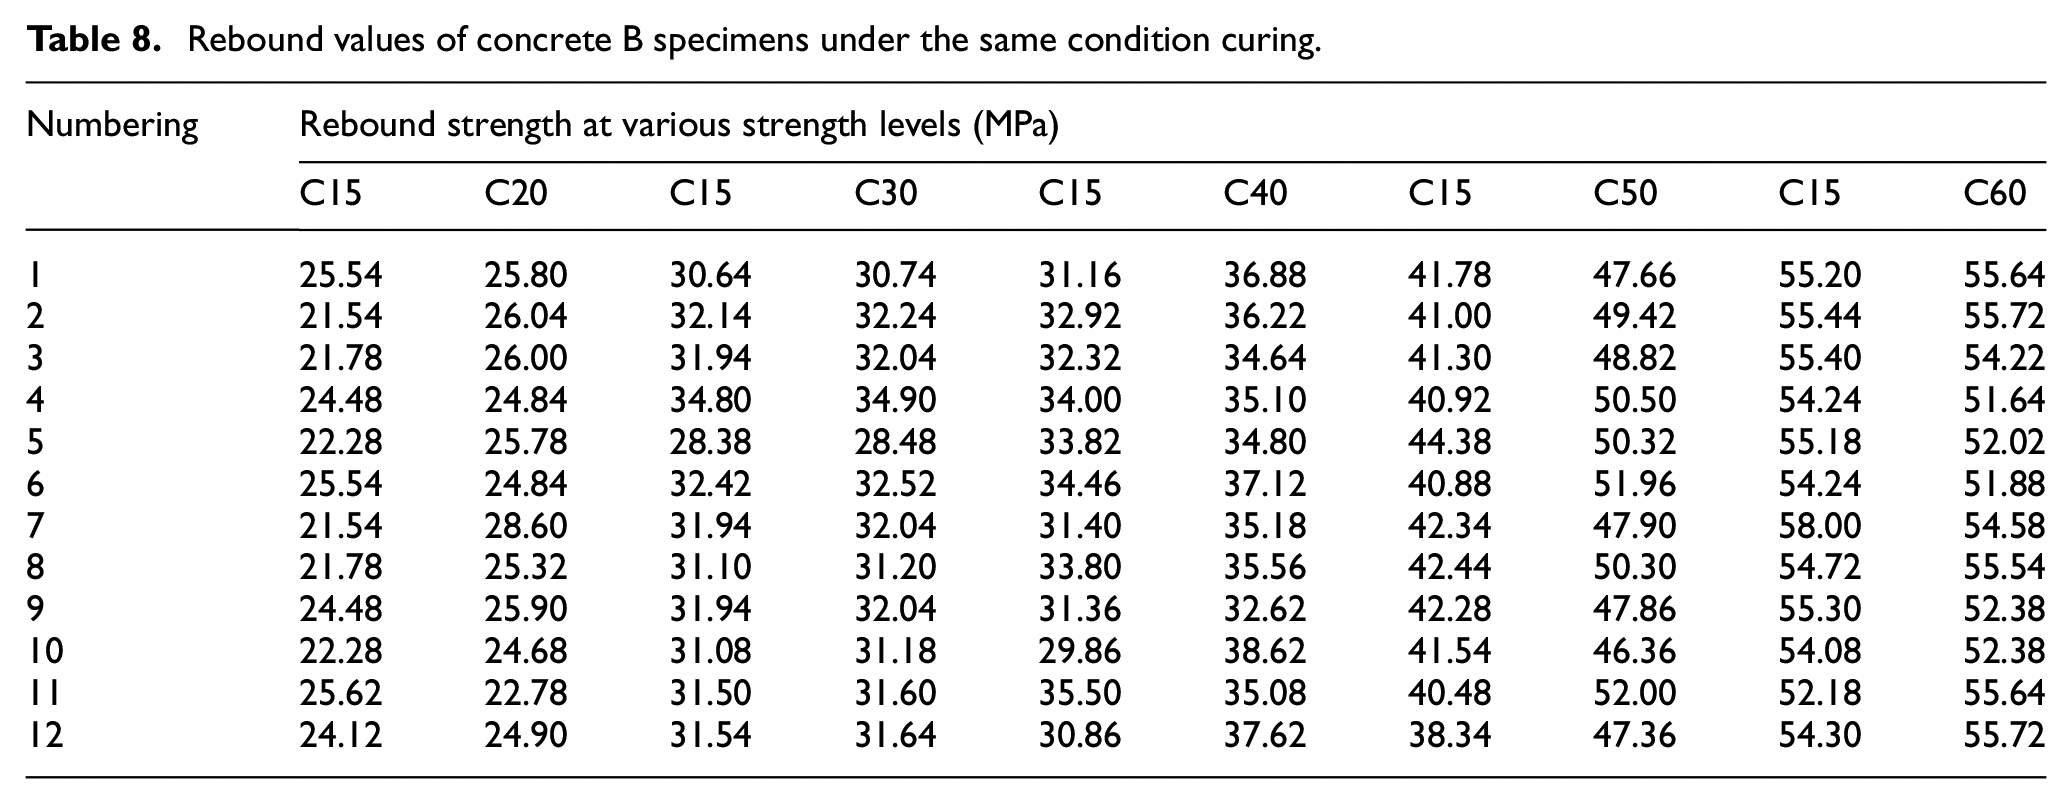
After 28 days of standard curing of commercial concrete specimens B, the cubic compressive strength and core strength were measured. After that, the specimens were damaged. Some of the data obtained are only for reference.
Test results under curing under the same conditions
Test results of component strength (core strength and cubic compressive strength) corresponding to same condition curing and concrete strength resistance of different strength grades (concrete A).

Test results of component strength (core strength and cubic compressive strength) corresponding to same condition curing and concrete strength resistance of different strength grades (concrete B).

Rebound value of concrete A specimen under the same condition curing.

Rebound values of concrete B specimens under the same condition curing.
Correction of test data using the core method
After the core is sampled and processed in the pull-out post-insert position, the compressive strength test is performed, and the strength of the concrete core sample is then used to correct the relationship curve.
Using the core result for the pull-out post-insert test, the cube compression results are corrected based on the correct method presented in the “Technical specification for testing concrete strength with drilled core method” (JGJ/T 384-2016). 30
In the batch evaluation of the test using the correct method, six standard core sample pieces were randomly taken out of their positions—the attached test piece was removed—and the core sample diameter and height were determined. After the cutting conditions were met, observations were made. The flatness of the core sample determines whether it is required to be filled with cement mortar. After the core sample is filled, it is required to be placed in a room for 1–2 h and then sent to the curing room for 3–4 days for a pressure test. In order to ensure that the environment and the temperature of the core sample test piece are basically the same as those for the concrete of the tested structure, the core strength test specification specifies two states of the core sample test piece: one state is if the structural concrete is tested. The environment is relatively dry, and the core sample test piece should be tested under natural dry conditions. The specific method is used to test the core sample test piece naturally after drying for 3 days. Second, if the environment of the tested concrete structure is relatively moist, the core sample test piece should be pressed in a wet state. The specific method is used to test the core sample piece, wherein the sample is placed in water at 15°C–25°C for 2 days and then tested. 30
The core sample test piece compressive strength value calculation formula is

where,
The core correction formula is


where
The revised test data are shown in the Tables 9–11.
Results under standard curing of the test after the correction of the concrete pull-out force and the corresponding component strength (core strength and cubic compressive strength) of different strength grades (concrete A).

Results under the same condition curing of the test after the correction of the concrete pull-out force and corresponding component strength (core strength and cubic compressive strength) of different strength grades (concrete A).

The rebound value of the test piece under the same condition is measured using the same method as the rebound value under the standard curing. The data under the same condition is also corrected by the core method.
Results of the test after the correction of the concrete pull-out force and the corresponding component strength (core sample strength and cubic compressive strength) of different strength grades (concrete B).

Comparison of test data after correction of core method
In this article, the comparative test of the standard curing and the same condition curing of commercial concrete A is performed. Therefore, the revised test data are divided into standard curing, the same condition, two different curing methods, and different strength grades of concrete A. The obtained test results are shown in Figures 6 and 7.

Data comparison of concrete A under standard curing.
Data comparison of concrete A under conditional maintenance.
In the above figure, we can observe the following:
The pull-out force corresponding to the different concrete strength grades of concrete A is consistent with the cubic compressive strength value, and there is no obvious difference.
When the concrete strength grade is greater than C50, the rebound strength of the concrete cured under the same condition is slightly lower than the concrete rebound strength under standard curing.
When the concrete strength grade is between C15 and C35, the standard strength of the core sample is basically the same as that of the sample having the same core.
When the concrete strength grade is C45–C50, the compressive strength of the core sample under the same curing condition is obviously greater than that of the core sample under the standard curing condition.
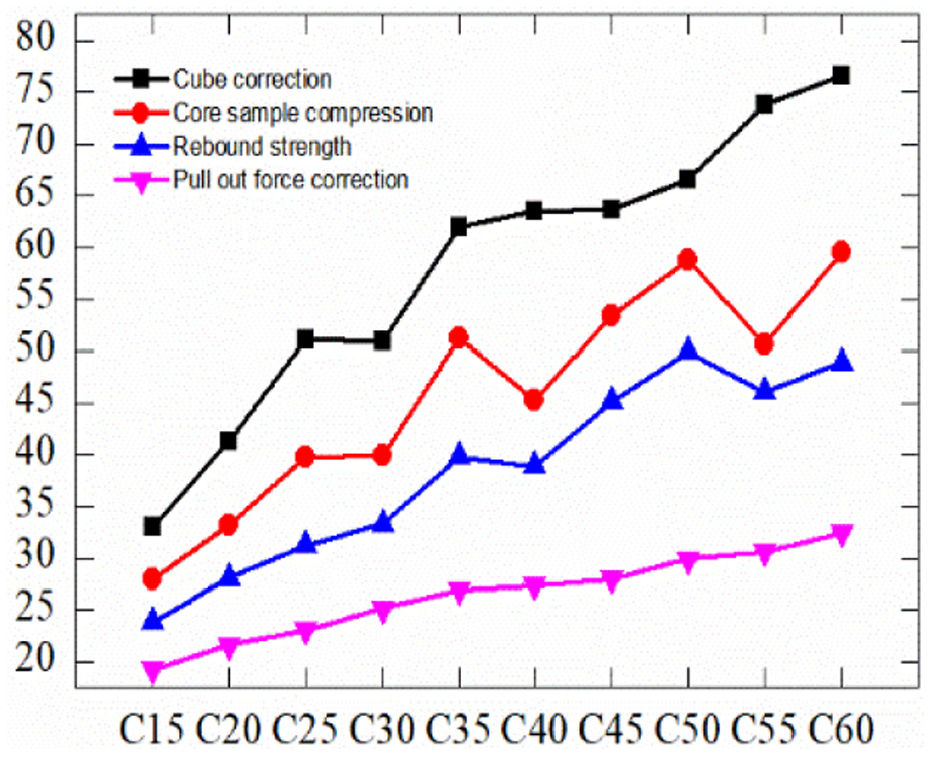
Owing to the destruction of the standard test piece, part of the data under a different strength of the standard curing of B commercial concrete and the test data under the same condition curing are shown in Figures 8 and 9.

Data comparison of concrete B standard curing.

Data comparison of concrete B same condition curing.
In the above figure, two different conservation situations can be clearly observed:
For concrete specimens of the same strength grade, the compressive strength of the cube under the same conditional curing is greater than that of the cube under standard curing.
When the concrete strength grade is between C45 and C55, the strength of the core specimen of the concrete specimen under the same condition is greater than that of the core specimen under the standard curing condition.
Establishment of the strength curve of commercial concretes A and B based on the pull-out post-insert method
Selection of regression formula model
The comparison shows that the concrete A pull-out force and the cubic compressive strength under the standard curing are close to each other. The two regression curves of the core sample strength are close. From the perspective of convenient engineering application, the linear regression curve should be preferentially selected for ensuring a good accuracy. However, the regression curves of the concrete A pull-out force and rebound strength under standard curing conditions are slightly different, but the correlation coefficient R is greater than 0.9. Therefore, in this article, the pull-out force and the compressive strength value of the test piece under the standard curing conditions are summarized, and the regression analysis is performed according to the principle of the least squares method. The regressive effect of the equation is tested using the relative standard deviation and correlation coefficient

In the formula, A and B are the regression coefficient, that is, the coefficient of the strength curve,
The indicators for evaluating the accuracy of the regression formula are as follows:
Correlation coefficient:

Average relative error:

Relative standard deviation:

Coefficient of variation:

where
Regression analysis of concrete A under standard curing condition
The pulling force and cubic compressive strength, core sample compressive strength, and rebound strength correlation are shown in Figures 10–12.

Regression comparison between pull-out force and cube compressive strength.

Regression comparison between pull-out force and core sample compressive strength.

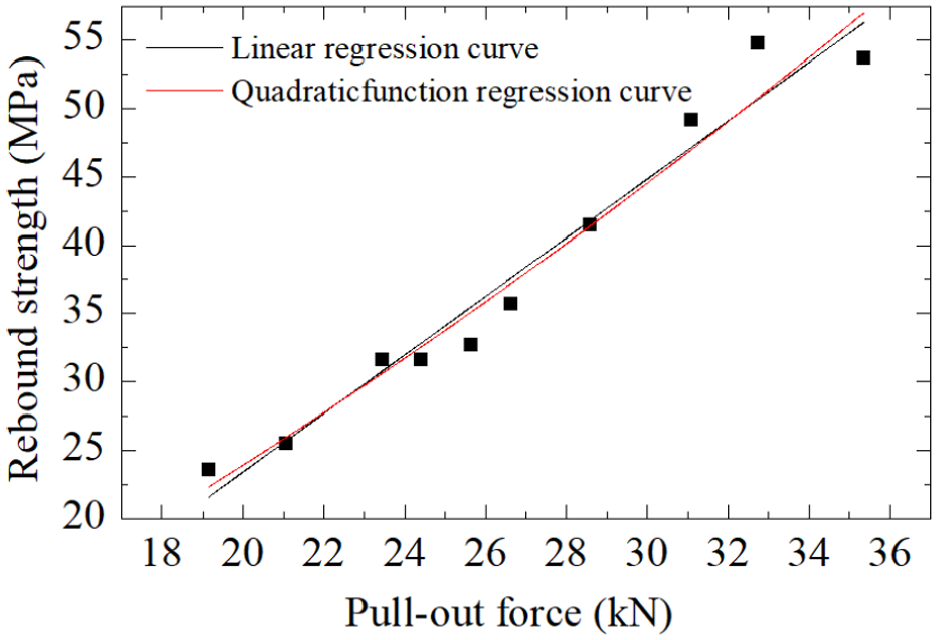
Regression comparison between pull-out force and rebound strength.
The strength formula obtained after the linear regression is as presented in equation (9)

where
The strength formula obtained after the quadratic function regression is shown in equation (10)

where
The strength formula obtained after the linear regression is as in equation (11)

where
The strength formula obtained after the quadratic function regression is shown in equation (12)

where
The strength formula after linear regression is shown in equation (13)

where
The strength formula obtained after the quadratic function regression is shown in equation (14)

where
It is found that the two regression curves of concrete A pull-out force and cubic compressive strength, core sample strength, and rebound strength under the standard curing overlap, and the linear regression curve can be directly selected for engineering applications.
Regression analysis of concretes A and B under the same condition curing
The pulling force and cubic compressive strength, core sample compressive strength, and rebound strength correlation for concretes A and B are presented in Figures 13–18, respectively.
Regression of pull-out force and cube compressive strength (A).

Regression comparison between pull-out force and core sample compressive strength (A).

Regression of pull-out force and rebound strength (A).

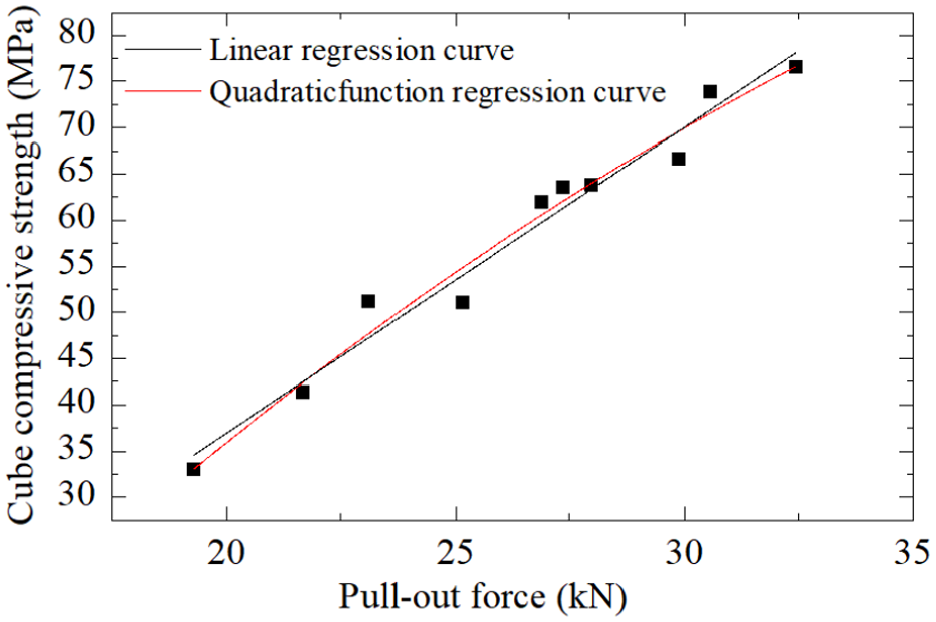
Regression of pull-out force and cube compressive strength (B).
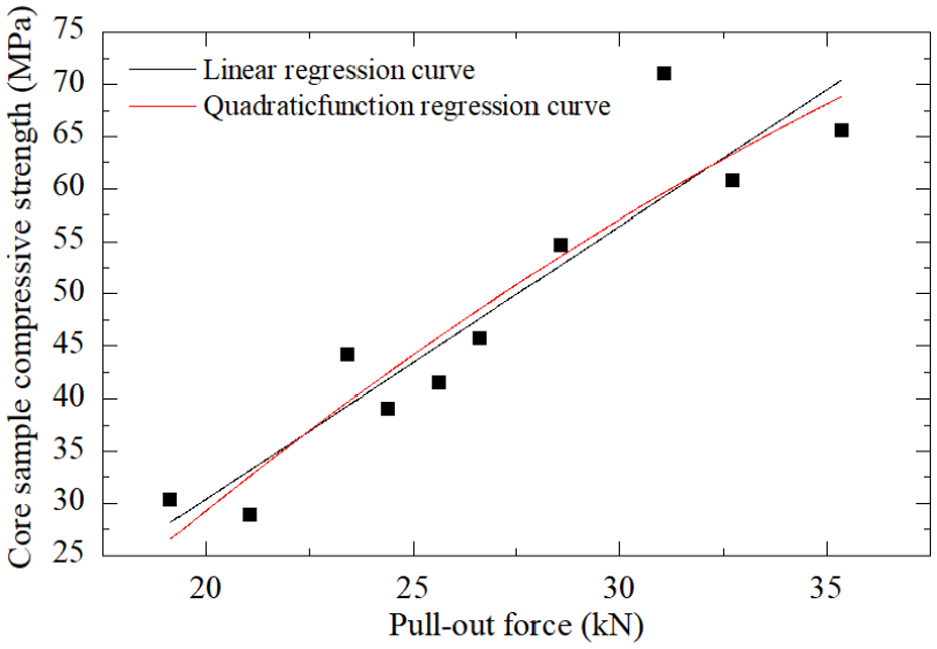
Regression comparison between pull-out force and core sample compressive strength (B).
Regression of pull-out force and rebound strength (B).
The strength formula obtained after linear regression is shown in equation (15)

where
The strength formula obtained after the quadratic function regression is shown in equation (16)

where
The strength formula obtained after linear regression is shown in equation (17)

where
The strength formula obtained after the quadratic function regression is shown in equation (18)

where
The strength formula obtained after linear regression is shown in equation (19)

where
The strength formula obtained after the quadratic function regression is shown in equation (20)

where
The strength formula obtained after linear regression is shown in equation (21)

where
The strength formula obtained after the quadratic function regression is shown in equation (22)

where
The strength formula obtained after linear regression is shown in equation (23)

where
The strength formula obtained after the quadratic function regression is shown in equation (24)

where
The strength formula obtained after linear regression is shown in equation (25)

where
The strength formula obtained after the quadratic function regression is shown in equation (26)

where
It is found that the two regression curves of the take-up force and the cubic compressive strength of the soaring concrete under the same condition and the core compressive strength and rebound strength are coincident, and the linear regression curve can be directly selected for the convenience of engineering applications.
Fitting analysis of concrete strength curves of two commercial concretes A and B
Comparative analysis of strength of concrete A in standard curing and same condition curing
The pull-out force and cubic compressive strength under the same nutrient and standard curing, core strength, and rebound strength are compared as shown in Figures 19–21, respectively.

Regression of pull-out force and cube compressive strength.

Regression of pull-out force and core sample compressive strength.

Regression of pull-out force and rebound strength.
From Figure 19, it can be clearly observed that when the pull-out force is less than 25 kN, the compressive strength of the concrete A cube under the standard curing is significantly greater than that under the conditional curing. On the other hand, when the pull-out force is greater than 25 kN, the compressive strength of the concrete cube under the conditional curing is greater than that under the standard curing. As is show in Figure 20, the core-like compressive strength corresponding to the pull-out force of the same size of concrete A is obviously slightly greater than that in the case of the standard curing. As can be seen from Figure 21 that the corresponding pull-out force of concrete A under the same conditional curing is less than the rebound strength under the standard curing condition.
Comparative analysis of strengths of concretes A and B under the same condition curing
1. Comparative analysis of pull-out force and cubic compressive strength of concretes A and B under the same condition curing.
Figure 22 shows that the compressive strength of the cube corresponding to the same pull-out force under the same condition curing is significantly greater than that corresponding to concrete B. A quantitative analysis of the equations corresponding to the two concretes given a set of pull-out forces is shown in Table 12.

Regression comparison between pull-out force and cubic compressive strength of concretes A and B under the same condition curing.
Quantitative analysis of the relationship between pull-out force and cubic compressive strength.
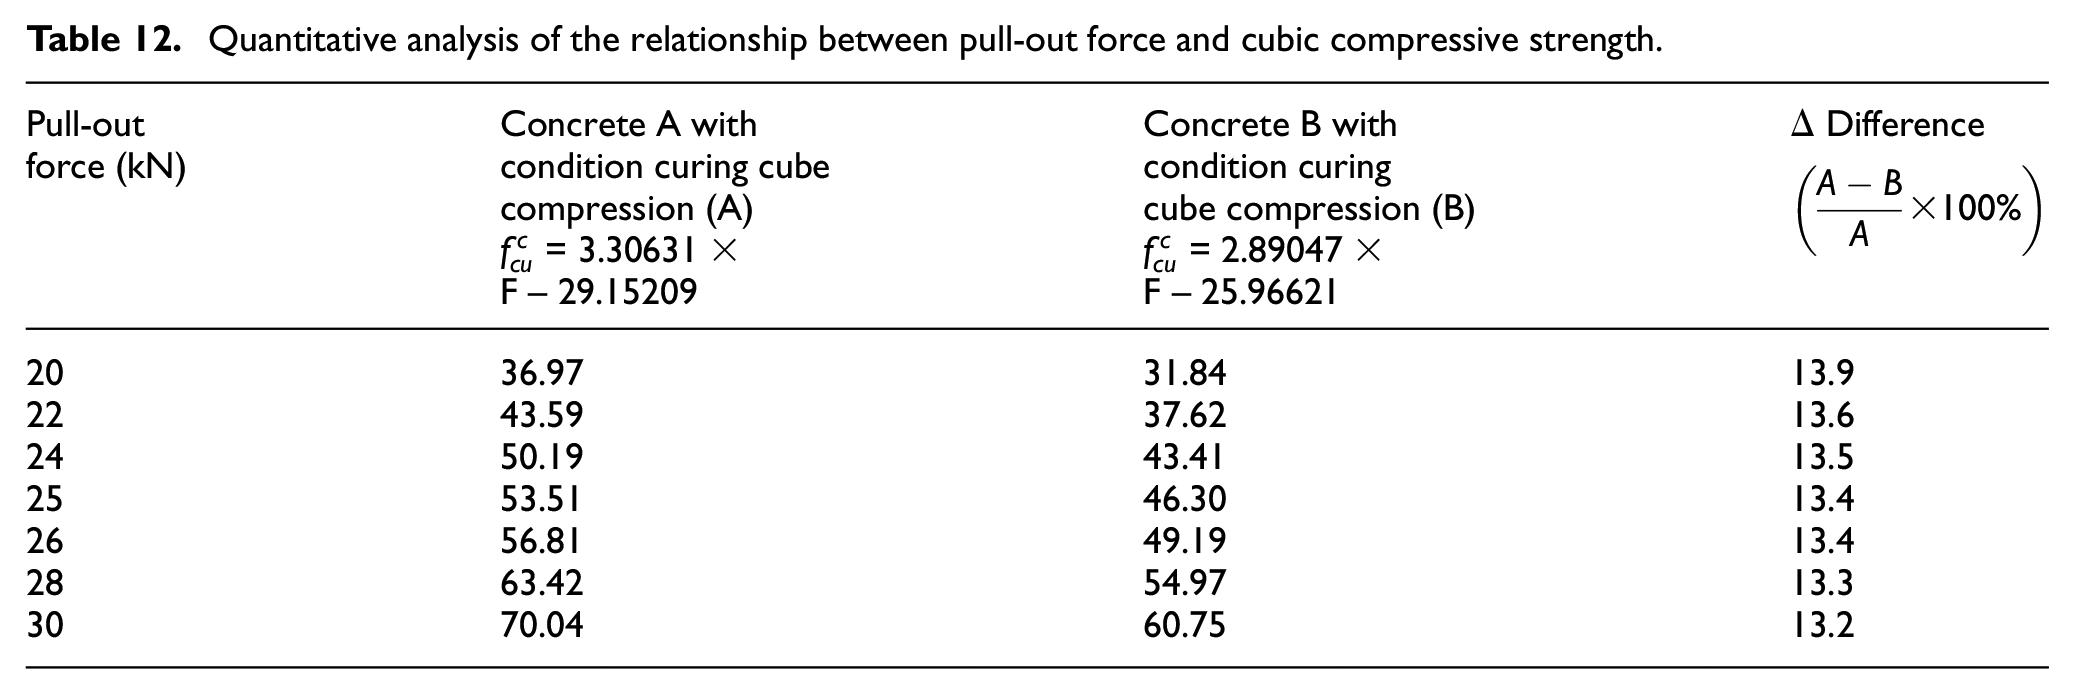
It can be observed in Table 12 that as the pull-out force increases, the difference between the pull-out force and the cubic compressive strength under the condition curing of concretes A and B decreases gradually, but the minimum value is 13.2%. Owing to the large differences, the respective regression equations must be used separately.
2. Comparative analysis of pull-out force and core strength of concretes A and B under the same condition curing.
In the comparison presented in Figure 23, it is found that the two pull-out forces of concretes A and B are similar to the core-fitting compressive strength fitting curves, and a set of pull-out forces is used to quantitatively analyze the difference of the fitting values of different concretes, as shown in Table 13.
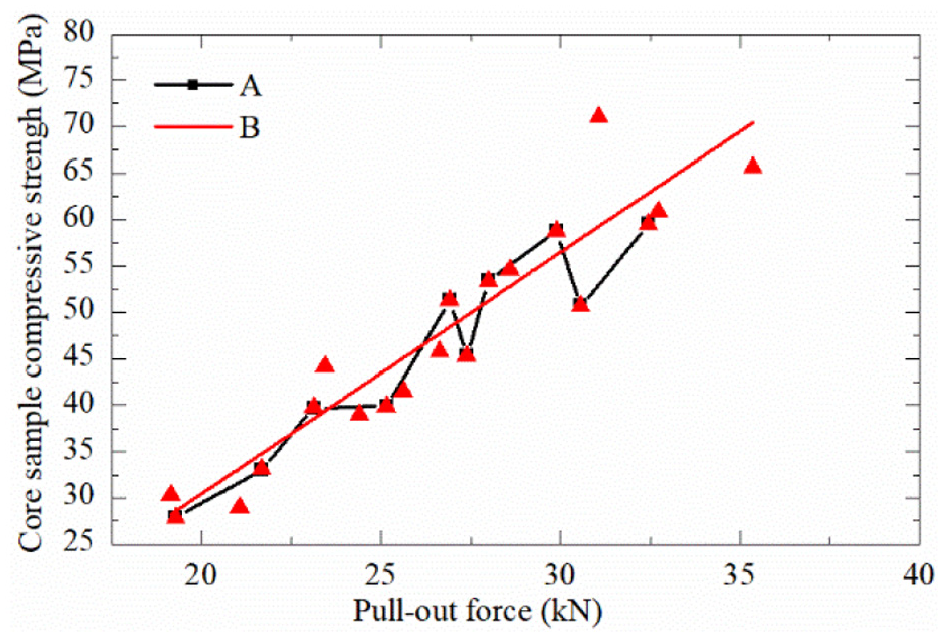
Regression comparison between pull-out force and core compressive strength of concretes A and B under the same condition curing.
Quantitative analysis of the relationship between pull-out force and core compressive strength.

It can be observed in Table 13 that the difference between the pull-out force and the rebound strength of concretes A and B under the condition curing gradually increases with the gradual increase in the pull-out force, but the maximum error does not exceed 3.4%. The engineering application can be fitted to a curve, and the curve obtained after the comprehensive fitting is shown in Figure 24.

Pull-out force and core sample compressive strength comprehensive regression of concretes A and B.
The strength formula obtained after performing a linear regression of the A and B comprehensive data is show in formula (27)

where
3. Comparative analysis of pull-out force and rebound strength of concretes A and B under the same condition curing.
In the comparison in Figure 25, it is found that the two concrete pull-out forces and rebound strength fitting curves of concretes A and B are similar. Furthermore, a set of pull-out forces is used to quantitatively analyze the difference in the fitting values of different concretes, as shown in Table 14.

Regression and comparison of pull-out force and rebound strength of concretes A and B under the same condition curing.
Quantitative analysis of the relationship between pull-out force and rebound strength.

It can be observed in Table 14 that with the gradual increase in the pull-out force, the difference between the pull-out force and rebound strength of concretes A and B under the same condition curing is gradually reduced, and thus, can be fitted into a curve for the convenience of engineering applications. The curve obtained after the comprehensive fitting is shown in Figure 26.
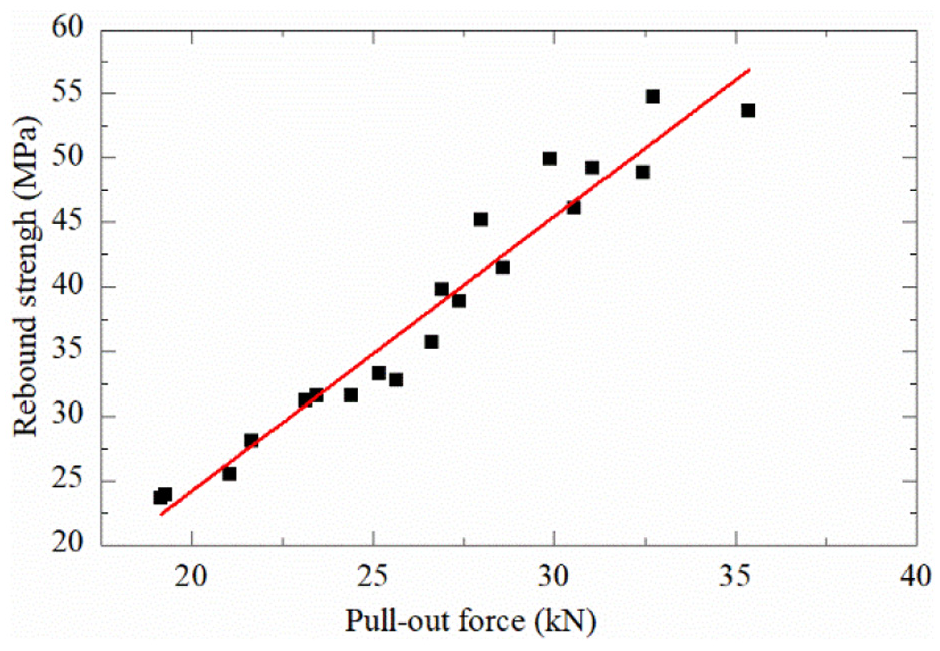
Comprehensive regression of pull-out force and rebound strength of concretes A and B.
The strength formula obtained after the linear regression of concretes A and B is show in formula (28)

where
Conclusion
On conducting the pull-out post-insert pull-out test, cubic compression test, rebound test, and core test, based on the systematic study of the mechanical properties of two common commercial concretes in Henan Province, China, a regression analysis of the experimental data was performed using the discrete least squares method. In addition, the strength curve of the two concretes was established under different curing conditions based on the pull-out post-insert method. The main findings are as follows:
Linear regression and quadratic function regression were performed on the experimental data. The comparison of the two regression analyses showed that the strength curve based on the linear regression has a high correlation, and the obtained strength curve is as follows: For the correlation between the pull-out force and cubic compression resistance, for concrete A under standard curing, For the correlation between the pull-out force and the compressive strength of the core sample, for the standard curing of concrete A, For the correlation between the pull-out force and rebound strength, the standard curing of concrete A should be
Based on the qualitative and quantitative comparison analysis of the strength curves of the two commercial concretes A and B, based on the convenience of application and the accuracy of the test, the two strength curves were fitted and analyzed. The fitting results are as follows: The extraction force of concretes A and B under the same condition has a good correlation with the compressive strength of the core sample. A unified strength curve is established by fitting the two strength curves: The pull-out force and rebound strength of concretes A and B under the same condition have a good correlation. A unified strength curve is established by fitting the two strength curves:
The establishment of the Henan Province strength measurement curve has perfected the detection technology of concrete strength detection by post-out post-insert method in Henan Province, which can be widely used in the detection of concrete strength in bridge structures, and greatly improves the accuracy of detection compared with the national unified strength measurement curve, and can effectively reduce the misjudgment of project quality, with extensive social benefits and important theoretical value and practical significance. To make the findings of this article more widely applicable, the following work remains to be done.
To study the effects of crushed rock lithology, coarse aggregate size and grade on the results of concrete testing by the post-out post-insert method in various regions of Henan Province.
The effects of water-adhesive ratio, admixture type and carbonation depth on the strength curve were investigated.
The effects of different ages of the same kind of concrete on the results of the post-out post-insert method.
Footnotes
Acknowledgements
Special thanks are extended to the anonymous reviewers for their valuable comments.
Handling Editor: Yun-Lai Zhou
Declaration of Conflicting Interests
The author(s) declared no potential conflicts of interest with respect to the research, authorship, and/or publication of this article.
Funding
The author(s) disclosed receipt of the following financial support for the research, authorship, and/or publication of this article: This work was supported by the National Natural Science Foundation of China (grant no. 51878623), the Science and Technology Tackling Project of Henan Science and Technology Agency (grant no. 172102210500), the Innovative Research Team (in Science and Technology) in University of Henan Province (grant no. 20IRTSTHN009), the General Science and Technology Tackling Project of Zhengzhou City (grant no. 153PKJGG095), the Program for Young Backbone Teachers in Colleges and Universities in Henan (2018GGJS005), and the Foundation for Postdoctoral Students in Henan province (grant no. 1901024).