
Abstract
In Taiwan, where residential and industrial areas are in close proximity, finding ways to effectively continuous monitor and manage water quality is an essential issue. This study established a total solution for an Internet of things water quality monitoring network that integrates domestic miniaturized water quality monitoring sensors for real-time transport data of pH, temperature, conductivity, chemical oxygen demand, and copper ions. The data will be used to establish an analysis model based on continuous monitoring of the nation’s background concentration. We designed an automatic continuous monitoring and early warning analysis module for automatic analysis of environmental and instrumental anomalies for decision makers, a “pollution source analysis module” utilizing static and dynamic cross-environment data to swiftly trace upstream pollution sources, and a “pollution hotspot analysis module” to evaluate the impact area of pollutants, and immediate response measures to achieve early warning and swift evaluation for the prevention of water pollution. To do this, we installed 100 domestic miniaturized water monitoring devices in Taoyuan City for testing the solution. We found that the establishment of an Internet of things environment analysis and response model integrated with cross-environment analysis can be applied in water quality monitoring and management to assure improved environmental quality.
Keywords
Introduction
Water resource management issues such as water circulation, water quality, water volume, and water pollution are matters of concern for many nations, due to climate, economic development, and social activity. This has resulted in major challenges to find ways to balance water users, while maintaining the balance of natural ecosystems. 1 Taiwan is no exception. Taiwan has ample rainfall but its steep mountains and short rivers make it challenging to develop and utilize water resources. 2 Rapid industrial development has caused countless cases of water pollution, such as the Formosa Plastics Group’s mercury sludge incident and Kaohsiung’s water pollution incidents. These incidents have caused corporations to pay a massive price. 3 Taiwan has listed water quality management and monitoring as a key issue.
Traditional water quality management has relied on field sampling to confirm pollution concentration using laboratory instruments for analysis, manually monitoring water quality on site (Traditional Manual In-Situ, TMIS), 4 or continuous monitoring methods using high-priced equipment. 5 These methods cannot obtain water quality data in a timely manner, nor are they able to produce data with low spatial and time resolution, therefore making it difficult to effectively grasp changes and trends in water quality. The high cost and labor of these methods also impacts the subsequent timeliness of environment governance and law enforcement.
The demand for water quality monitoring in rivers, lakes, groundwater, and the ocean continues to grow, 6 but traditional water quality monitoring technology is insufficient and utilizes complicated procedures to collect samples, making it difficult to obtain real-time trends and changes in water quality. Many nations have begun developing automatic continuous water quality monitoring systems to achieve early warning and ensure the timely handling of water pollution incidents. 7 These systems utilize a core analysis instrument with modern sensors and Internet of things (IoT) technology to achieve continuous real-time monitoring of water quality and changes in the target body of water. Analysis of different data cycles can achieve early warning functionality. 8
Efforts to achieve effective methods of water quality monitoring began many years ago. The United States established an automatic water quality monitoring system in the mid-20th century, followed by England, Japan, the Netherlands, and Germany, all of whom established continuous monitoring systems for water quality and pollution in the 1970s. Currently, more mature online monitoring items include water temperature, dissolved oxygen, conductivity, turbidity, oxidation–reduction potential (ORP), flow speed, and water level. Biological online monitoring technologies have also developed rapidly in recent years, and carry the advantage of being able to solve environmental and toxicity problems that cannot be handled by standard chemical monitoring stations. 8
Wireless sensor networks (WSNs) are an indispensable component of current water quality monitoring technology. WSN structures are designed to be light and low cost with monitoring capabilities that can process collected data before transferring wirelessly to a data collector. The IoT is formed by an application layer, service layer, network layer, and device layer; it is the critical foundation of WSN technology due to the function within the network and device layers. The IoT is formed by an application layer, a service layer, a network layer, and a device layer. In the past few decades, the emergence of IoT technology has helped establish smart cities. This technological development is broadly applied in various fields.9–11 It follows from what has been said that WSN focuses on device- and Internet-level equipment applications, monitoring on-site, real-time status via deployment of front-end sensors and an Internet connection, such as applications of devices for residential monitoring, or monitoring of sleeping status.12,13 IoT further analyzes collected data via an analytical model to learn of current status as the basis for forecasting, decision-making, and execution for such applications as evaluation of sleeping status and the status of patients under home care.14–16
In terms of environmental applications, IoT technology also applied to fields such as air and water resources. Environmental data from forests, rivers, lakes, and oceans were collected. 17 Here, water resources play key roles for the public, agriculture, and industries with gradual applications in bodies of water in the environment, aquaculture, industrial monitoring, and other fields of water quality monitoring, such as monitoring water quality in specific sections of rivers,18–20 monitoring the water quality requirements for specific aquaculture species,21–23 water quality for industrial use and wastewater quality monitoring.24,25 WSN technology has evolved to automatic continuous monitoring and expanded to IoT technology services to immediately grasp the occurrence of anomalies.
While many countries have begun utilizing continuous water quality monitoring equipment to manage the environment, they have been limited by sensor production, maintenance costs, and excessive size. There currently lacks a water quality monitoring deployment and data analysis application method that can be applied to large areas. Generally speaking, the insufficiencies of existing monitoring equipment, low coverage rate, weak management capabilities for general information, and insufficient real-time processing capability as well as early warning technology make it challenging to handle all types of potentially disastrous water environment pollution incidents. 26
This article devises a total solution for environmental management. Environmental IoT technology and massive deployment of water quality monitoring points supplement the final high-resolution data gap. Low cost, domestically produced, and miniaturized water quality monitoring devices use IoT technology to transfer real-time data supported by strategic deployment in areas with differing properties based on optimally designed installation, and a deployment strategy to maximize the effect of the deployed water quality sensors. When combined with data analysis models and a value-added analysis based on cross-environmental data, the system can identify pollution sources, achieve early warning and management for water quality monitoring, and open up value-added application service models based on environmental IoT and big data.
Material and methods
This study aimed to probe water quality monitoring in Taiwan. Given serious copper-ion pollution caused by printed circuit board (PCB) industries, the study tested the items of copper ions, chemical oxygen demand (COD), pH, electrical conductivity, and temperature, facilitating the detection of potential pollution sources before application of the analytical model for water quality alert, to attain the purposes of tracing, forecast, and response. In order to enlarge the effects of online water quality monitoring, this study devised a solution framework suitable for an IoT water quality monitoring network (Figure 1). The purposes of the framework are (1) to establish a systematic structure of water quality environmental management; (2) to automate tracking of data anomalies; and (3) to standardize the management of abnormal water quality incidents. This framework suggests systematic processes for obtaining data, streaming, and analysis, to back-end decision-making and response measures. At the data acquisition end, appropriate IoT water quality monitoring devices must be selected depending on the purpose of monitoring, and a deployment strategy must be planned to include suitable areas and installation locations, which ensures that all acquired data can satisfy the purpose of monitoring.

IoT water quality monitoring and management framework.
Miniaturized real-time online water quality monitoring
There are four criteria for selecting water monitoring equipment: the purpose of data collection, types of monitoring equipment installed, types of sensors deployed during installation, and specific monitoring equipment that satisfy data quality goals such as precision and accuracy. The most commonly selected sensor components detect items such as temperature, conductivity, dissolved oxygen, pH value, and turbidity. 27 Sensor components are the core devices, as their accuracy will impact readings when monitoring water quality. Consideration must be given to size, reaction, detection range, sensitivity, accuracy, lifespan, maintenance, cost requirements, miniature size, durability, precision, and cost considerations, with real-time sensor equipment as the priority choice. 5 Most traditional water quality monitoring technologies lack integrated sensor components, and are time consuming as well as labor intensive, resulting in excessive costs. Therefore, detection systems require sensor components that are low cost, have high sensitivity and accuracy, and that reliably facilitate continuous monitoring of multiple water quality parameters in multiple locations. 28 In recent times, there has been research on many lightweight and low cost monitoring systems for tap water distribution systems,29–31 but the existence of many uncertain elements in water quality monitoring of bodies of water in the environment has resulted in the lack of practical application data of miniaturized sensors used to monitor them.
Current water quality monitoring technologies that produce accurate data, such as laboratory analyses, require large instruments that cannot be transported for on-site analysis. This results in uncertain variables, such as time-consuming sampling, sample preservation, and transportation. Methods with convenient transportation, such as field analysis, greatly sacrifice sensitivity and accuracy due to rudimentary testing equipment.
This study has created a set of “miniaturized water quality detection system” devices that can measure pH value, temperature, conductivity, copper ions, and COD through the use of a micro total analysis system (μTAS). The remote water quality detection system uses an embedded system to control pumps, micro-electromagnetic valves, multi-function water quality sensors, and optical detection modules to provide functions such as multi-target, real-time, automatic, and remote monitoring. These various components substitute for larger detection instruments to achieve the goal of remote, multi-target, real-time water quality monitoring (Figure 2).

Internal structure of miniaturized water quality monitoring system.
In terms of sensor technology, the pH value sensor primarily utilizes indium tin oxide (ITO) thin membrane sensor material that is low cost, stable, and can quickly measure pH value with efficiency. Temperature and conductivity sensors are produced with platinum electrodes, using the platinum (Platinum, Pt) properties of electrode temperature impedance linearity and high chemical stability as temperature sensor units. Conductivity utilizes the principle of two-pole electrodes with lengths designed at a fixed distance to measure resistance values in aqueous solutions before conversion into conductivity units to obtain water conductance. The measurement of copper ions utilizes an electrochemical method to develop a heavy metal ion sensing technology based on the development of composite electrodes. The aim is to develop an electrochemical sensor cathode material that is both eco-friendly and possesses high sensitivity. Micro-optical sensor components are used in design and development in combination with a COD multi-component qualitative quantitative algorithm to complete a size reduction of the monitoring system’s optical device, as well as preliminary development of the COD optical sensor component.
The study aims to base development on newer electrochemical and optical analysis supported with microelectromechanical technology to develop miniaturized water quality monitoring systems. The wide deployment water quality sensor technology will simultaneously possess the properties of small-scale water footprint, durability, ease of maintenance, and low cost so that it may be deployed in the construction of water body monitoring systems used in different scenarios of various agencies in the future.
Deployment strategy
A cost-effective siting method is especially important when monitoring the water quality of rivers, so as to address future demands of widespread sensor deployment. Currently, most choose locations through their reliance on subjective experience and judgment. To reduce the cost of monitoring, a key aspect of preliminary deployment is to identify the purpose of the water quality monitoring before screening the environments, and selecting a purpose that can be compared using quantitative assessment indicators to ensure that figures exceeding standard water quality ratios and pollution contribution ratios can be used as indicators. 32 In Korea, they integrated genetic algorithms (GAs) and geographic information systems (GISs) in the design of a water quality monitoring network that is effective in larger river systems. They identified five key indicators when selecting locations: representation of the river system, compliance to water quality standards, supervision of water usage, surveillance of pollution sources, and testing for changes in water quality. 33
The additional key factors when considering the selection of site locations are 34 (1) representation: monitoring points should be placed at run-offs away from pollution sources and must be placed at appropriate depths; (2) staff safety: avoiding harsh environments, dangerous plants, animals, and strangers; (3) site visit: ensuring that vehicles and staff can conveniently access the monitoring point for retrieving samples; and (4) site selection assessment: surveying all potential monitoring points to confirm their characteristics and whether they will allow for retrieving samples. These factors should be conducted after heavy storms whenever possible to confirm discharge flow conditions.
The US Geological Survey (USGS) stated that different installation points reflect different representations of the body of water. Thus, deployment points closer to riverbeds could represent impact from upstream sources, while middle locations may represent upstream water quality. Turbulent flow is beneficial for mixing and can impact dissolved oxygen and turbidity. The following factors are of consideration in the three stages of site installation, surveillance installation, and operation and maintenance of service27,35: (1) consideration to site design: the monitoring point must measure the representation of changes in water quality for the vertical and cross sections. The measured location should be the sole channel with controlled flow speed to increase fouling rate (such as large amounts of fine sedimentary, algae, or invertebrates), the safety of equipment and staff, and prevention of malicious destruction; (2) surveillance installation: installation permits, type of water quality monitoring devices as well as security of construction and installation, difficulty, cost, and ability to install in a representative location; and (3) operation and maintenance of service: permits to access the site, security and sufficient space for maintenance, ability to satisfy the frequency of data quality maintenance intervals, fouling rate, and the accessibility and security of the site in extreme incidents (such as floods or heavy winds).
The Missouri Stream Team set site selection references for voluntary monitors. In their criteria, the location of water monitoring should be directly related to the purpose of monitoring. The team recommended monitoring points be spaced at least 300 feet from shallow areas to ensure that monitored points do not completely dry up to best reflect the monitored target. In the event of a point or non-point pollution source that must be observed, monitoring points can be placed upstream and downstream of the pollution source for comparison. When confirming impact on a single tributary, a point should be deployed before and after the river’s confluence points. 36
In terms of the actual deployment location and construction methods of continuous water quality monitoring equipment, the USGS also proposed several guidelines 37 : (1) on the outer side of bridge, instruments should be clamped tightly to the side of the bridge to prevent drilling. Devices should be raised or lowered with a steel cable connected to instrument cables and sensors to prevent scaling from river sediments, while the sensor should be wrapped in a polyvinyl chloride (PVC) tube to prevent damage from impact. Deployment points are often located next to main transportation routes and may endanger vessels. Waste may damage instruments during periods of high flow volume; (2) on rails, instruments should be installed on sliding carts that can be extended into the water through customized rails; however, river waste may collect in the instrument and customized rails are costly and difficult to install. The measured data are usually on the edges of riverbanks and cannot represent the water quality of the river’s section; and (3) in pipes, instruments should be placed in PVC pipes with a hole opened on one end. The pipe is extended into the water from the riverbed and can be easily scaled.
In reference to these guidelines, the study formulates a site selection standard operating procedure (SOP) for deploying water quality sensors for future water quality monitoring deployment in Taiwan (Figure 3).

Flow chart for water quality sensor site selection operations.
Data analysis model
Recent international advances in online water quality analysis and sampling technology utilize wireless transfer to obtain high-resolution data. This study established a smart analysis model applied in a continuous water quality monitoring network that utilizes the IoT to supplement the final piece of the “smart sensor” panel.
This study utilized wide-coverage IoT water quality sensors that provided 24-h measurement of data properties and background concentration in an area. The water quality data analysis model achieves automation of data interpretation, early and analysis, and is supported with an IoT water quality environment network management structure that achieves systematic management and data transfer, pretreatment, anomaly analysis, and response measures. Environmental data are disclosed to allow for environmental governance when applied to water quality monitoring and management. This can reduce labor requirements, while effectively improving environment quality and establishing application service models of environmentally based IoT technology, as well as the added value of big data.
Automatic continuous monitoring and early warning model
The early warning analysis model of the automatic continuous monitoring system established in this study aims to provide timely early warning and automatic reporting to investigating agencies or maintenance staff when anomalies occur in water quality data. Early warning of water quality refers to the analysis and evaluation of water conditions and the monitoring and analysis of changes in water environments. By analyzing the ecological environment and human behavior, the system predicts future developments. Water quality monitoring and predictions are an important aspect of protecting water environments and a key foundation of water resource management.
Statistical process control (SPC) has seen a large-scale application in the field of environmental protection in recent years. SPC monitoring of control charts can reduce the impact of potential risks and losses on human health. This is an important reference for future early warning and evaluation of industrial wastewater and air quality. 3
This study referenced theories related to SPC and utilized control charts as the core of early warning. Based on historical statistical data, we can set a center line (CL), an upper control limit (UCL), and a lower control limit (LCL) (Figure 4). If data are randomly distributed between UCL and LCL, then the process is stable; in contrast, if any points are found outside the UCL and LCL, or not randomly distributed, then there are attributable factors impacting the process, and it is deemed to be out of control.

Statistical process control diagram.
However, the water quality in natural environments has higher variability with many uncontrollable and complicated factors of impact; therefore, this model is based on the early warning theory of SPC which utilizes actual sensor experience to adjust early warning guidelines to provide early warning for water quality or device status. The water pollution early warning model designed by this study adapted to local conditions primarily in water quality data, such as time and space variance. This is applicable to river water, industrial parks, and farmland, and considers historical data distribution, as well as the sensitivity of data variance of the monitored waters. It will provide early warning before figures exceed the various guidelines set for the monitored waters. The IoT water quality platform can detect data variance resulting from pollution from surrounding environments, and can provide early warning for aging sensors or equipment anomalies. Due to the heavy impact of external environments on water quality, the excess of factors in data anomalies and properties, the system requires regular correction of early warning conditions to reduce the rate of false positives.
Equipment anomaly System malfunction: no pH variance in three consecutive points. Sensor aging: conductivity is 0 or exceeds 5000 μS/cm (detection limit).
Water quality anomaly Time analysis: conductivity surpasses 80 or falls lower than 20 quintiles (outlier condition) in three consecutive points. Space analysis: upstream and downstream stations simultaneously record farmland. Taiwan water quality regulatory restrictions: pH value below 6 or exceeds 9, temperature exceeds 38°C, EC exceeds 750 μS/cm (irrigation channels), COD exceeds 100 mg/L, copper ions exceed 3 mg/L.
Pollution sources analysis model
The purpose of the pollution source analysis model is to allow for swift upstream tracing and screening of suspected pollution sources when the monitoring station determines that there is an anomaly in water quality. Wuxi City in China constructed a new environmental ecosystem monitoring system that records and transfers up to 300 GB of environmental data daily. The system has collected data from water conservation, commercial, and environmental departments to create models with all river flow regions, pollution source data, and water monitoring to achieve the tracing of pollution sources in environmental quality monitoring. It is the first system to achieve smart environment management in modern monitoring and surveillance systems. 38 The pollution source analysis model established in this study interfaces with dynamic data from the automatic continuous water monitoring system and static data of factories in operation, registered data, environmental data, and auditing data so that in the event of pollution incidents, data of suspected pollution sources can be generated quickly.
Two pieces of information are required to determine the upstream area of polluting behavior, the flow region of polluting behavior, and the upstream area of the polluting behavior within the flow region. Based on these two concepts, the analysis procedure of this model is as follows:
Real-time monitoring of water quality
Real-time monitoring data of natural bodies of water use sensors to confirm whether all readings comply with standards.
Utilization of geographical data for analysis of upstream river pathing
When monitored data exceed water quality standards, the pollution source analysis mechanism is activated to screen all upstream river paths using data such as the river system’s water level and sectional diagrams.
Coordination with upstream monitoring data to screen river sections for pollution
All monitored data in the river section will be analyzed based on the aforementioned river pathing to determine the spread of pollution based on the degree of concentration and further close in on the upstream section of the pollution source.
Matching factories of the pollution source within a river section
Use a static database of company data matching companies can be found in operation in the upstream area.
Screening of companies suspected of being the source of pollution
Screen and select companies that are suspected of discharging pollution and utilize the following three guidelines of cross-matching with the static database and limiting the range of investigation to increase the timeliness and effectiveness of the investigation: (1) match the manufacturing processes, waste discharge, chemical pollution used, and waste registration data of all companies; (2) compare water pollution and groundwater with other monitoring data; and (3) compare with water pollution investigations and public complaint data.
This study further established a model for application on the IoT water quality platform, so that whenever water quality sensors detect anomalies and issue early warnings, companies located in upstream areas of pollution are immediately identified to reduce the scope of investigation and increase emergency response capability. The analysis procedure is as follows:
1. Selecting monitoring stations
Monitoring stations that require further analysis are selected based on the analysis models of the automatic continuous monitoring and early warning system. The platform utilizes GIS analysis functionality to screen sections of the river related to the station. From this, users can confirm whether they would like to change the scope of analysis (Figure 5).
2. Screening by industry

Pollution source analysis module: select monitoring station.
The platform defaults to screening factories with high-pollution potentials within a 5-km radius of the monitoring station. Users can further screen by industry based on the type of pollution, such as the PCB manufacturing industry. The platform will present an industry list and factory names, locations, and addresses in the GIS graphical layer that can be selected and added to the analysis list.
3. Materials and audit data analysis
The platform selects factories according to Step 2 to further analyze their basic data, materials registration status, and past results from previous audits. Searches can be conducted on their latest data related to water pollution, waste, and punitive actions, as well as their registration status in the last 3 years.
Pollution hotspot analysis model
The purpose of this model is to measure the degree of impact water pollution has on downstream areas to achieve the critical task of quickly evaluating early warnings. The pollution hotspot analysis model uses model simulations to quickly analyze four problems: (1) the time for pollution to reach sensitive downstream areas; (2) the amount of maximum pollution concentration; (3) the total area of resulting pollution; and (4) the time that pollution concentration will persist or exceed safety limitations.
Traditional environmental transmission-diffusion models require a massive number of local parameters to build a model. This is a highly challenging task in continuous water quality monitoring systems. Therefore, this study uses machine learning applied to a neural network to establish a model with the goal of detecting the impact of pollution on downstream water quality after a period of time. Here, a key step for obtaining accurate prediction results is the selection of monitoring points in pollution hotspots and input of parameters into the prediction model. The following subsections detail the process of establishing the pollution hot spot model, and the training methods of the model and results (Figure 6).
1. The process of establishing the pollution hotspot model (1) Monitoring point analysis

Neural network cluster analysis for the scheduling structure of pollution hot zone.
The sewers near pollution sources have a higher probability of detecting high concentrations of pollutants. Creating statistical models of monitored pollution concentrations during all timeframe resolutions and finding the distribution conditions allows for definition of outlet concentration thresholds, the sustained time in which concentration exceeds standards, and determination of whether the monitoring point is a pollution hotspot.
(2) Cluster analysis of monitoring point properties
Cluster analysis is conducted by taking a cluster of data with similar properties and putting them into one category. The study utilizes the neural network to perform cluster analysis on the monitoring data of each point by taking their described parameters of distribution properties, such as the average and standard deviation of normal distribution models and other parameters. The results allow for categorization of monitoring points to determine those that are pollution hotspots.
(3) Statistical properties of monitoring points
The data distribution of monitoring points is analyzed to obtain statistics for the sustained time and total amount in which concentration exceeded standards. If the number of times standards are exceeded fall into the definition of sustained time that fit the requirements of pollution hotspots, then the monitoring point is defined as a pollution hotspot. Statistical properties will further verify the results of cluster analysis based on neural networks.
(4) Classification model of monitoring points
Based on the results of statistical property analysis, known monitoring points are categorized and established in the classification model of the neural network. Once monitoring points are expanded, short-term records can quickly determine which monitoring points are within pollution hotspots.
(5) Establishing predictive models
Data measured by monitoring points in hotspots are set as the input layer of the neural network model. The monitoring point data of irrigation zones are set as the output layer of the neural network for establishment in the transmission neural network model. The input layer is linked to the hidden layer, which is linked to the weight coefficient of the output layer obtained through the gradient method. Once the weight coefficients of all layers have been determined, a neural network model appropriate for water quality prediction can be obtained.
(6) Valve control policy in irrigation channels
Real-time monitoring data from pollution hotspots are entered into the predictive model of the neural network for water quality to predict subsequent water quality conditions for the next unit of time. The predicted time unit is based on the construction of predictive models in the neural network and used to construct the length of time lag in the output layer. If predictive results within 1 h are at warning levels, the control valve is closed, and is not opened until monitored water quality falls below warning standards and prediction results within 3-h fall below warning levels.
(7) Model training method and results
Due to the difficulty in obtaining environment parameters of the monitored flow site and pollution diffusion model calculation, viability is low when utilizing traditional environmental water quality diffusion models, as it cannot satisfy the IoT network’s requirement of deployment in all applicable areas. This study considered a model with expansion capability that allowed for mass deployment and an accurate grasp of pollution hot zones that ensured the reliability of subsequent analysis and establishing pollution hot spot analysis models based on big data. Pollution hotspot analysis models allow for prediction of water quality concentration in the next moment (10 min later) to 3 h later. The training results are as follows:
A. Method for implementation of model training
Employ an artificial intelligence (AI) analytical methods (Figure 7) with two analytical procedures, namely modeling and forecast. For starters, a recurrent neural network (RNN) was constructed for depicting a water quality response, based on historical observation data, and using long short-term memory (LSTM) as neurons. The green and blue blocks in Figure 7 are historical data for use in the construction of forecast model, with the green-block data set as the input layer and the blue-block data as the output layer of the forecast model. The learning mechanism of the Internet framework is supervised learning. Then, the physical quantity of the target timing was forecast by inputting real-time monitored data (purple block in Figure 7) into the input-layer nodes of the forecast model.
B. Training results

Training methods of AI model.
In the case of pH, we tested model results for the water quality of a certain area, based on 2018 Q4 data. Data of the first 45 days were employed for the construction of forecast model, which was then verified with data of the last 45 days. Figure 8 shows the forecast pH values at 20 min, 1 h, and 2 h. Analytical results show that after inputting training data into the forecast model, monitored data are very similar to the forecast results at 20 min and 1 h, but had some error at 2 h, with the overall trend of change matching.
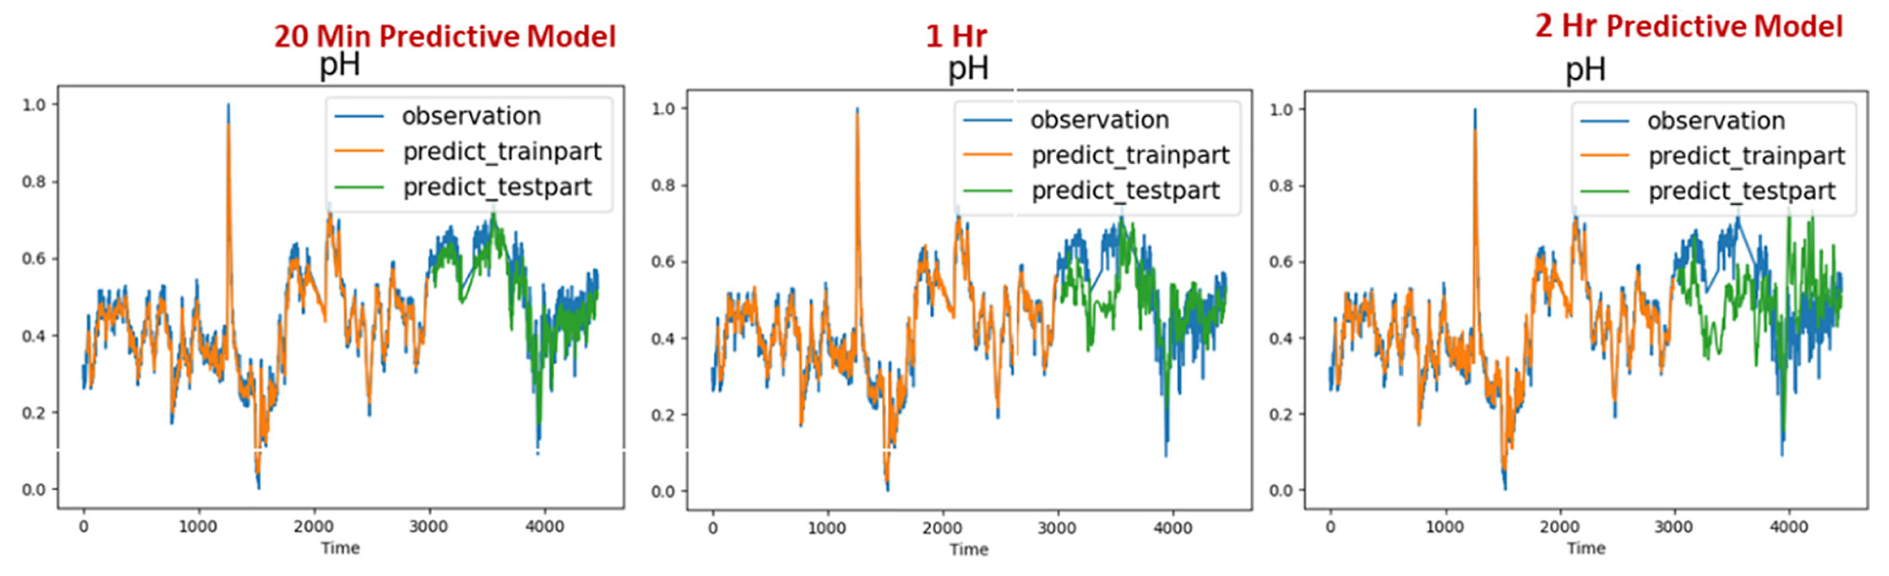
Predicted results of pH at each moment.
Following model construction, we input monitored data into the database of the data management platform, which provides an application programming interface (API) facilitating URL inquiry by users of various parameters in the database and input of analytical results into the corresponding column of the database. Afterward, both monitored data and analytical results of forecasts are both available for browsing online.
After subjection of forecast data to the accumulation and conversion of pollution scores begetting reasonable criteria, different deployment fields can be marked out, with different alert standards for different monitored items and light signals representing three levels: green (normal), yellow (minor), and red (serious) (Figure 9). In the case of pH, 6 < pH < 9 is normal, 3 < pH ≤ 6 or 9 ≤ pH < 11 is minor, and pH ≤ 3 or pH ≥ 11 is serious.

Analysis modules for pollution hot zones.
Results
In order to solve environmental issues and verify the integrated solution of an IoT water quality monitoring service proposed by this study, we used Taiwan as a test site by deploying 100 water quality monitoring devices during October 2018 to monitor pH, conductivity, temperature, copper ions, and soluble COD in Taiwan’s largest industrial and technology city Taoyuan. The study selected sites and strategically deployed suitable devices in appropriate locations in industrial parks, river systems, and irrigation channels. Around the clock, water quality monitoring was conducted to obtain data for base analysis and application to this study’s data analysis model, screening anomalies in water quality, perform the benefits of an IoT water quality monitoring network, and deploy equipment (Figure 10).

Water quality monitoring equipment deployed in case study.
Case study: verifying environment deployment locations
Using our established guidelines outlined in section “Deployment strategy,” we identified our selected sites by screening key potential areas of pollution, and factors such as our nation’s registered farmlands, number of factories, and industries. This study ultimately selected Taoyuan City as the primary site of deployment. The region’s main river, the Nankan River, has been publicly listed as a region with controls on the total amount of copper emissions, yet the existence of many registered industrial companies has resulted in excessive heavy metals in downstream farmland.
The study considered differentiation, representation, comprehensiveness, and purpose as the principles of selecting sites for device installation. A total of 100 deployment points were selected based on fulfillment of one of the requirements above one point was setup every 300 m at industrial park/sewers, one point every 500 m in farmland irrigation channels, and one point every 700 m in river systems. After field surveys and multiple discussions with governing agencies, 100 finalized locations were planned for installation with appropriate monitoring devices. A total of 46 points were installed in farmland irrigation channels, 21 points were installed along rivers and factories, and 33 points were installed in industrial parks as shown in (Figure 11)
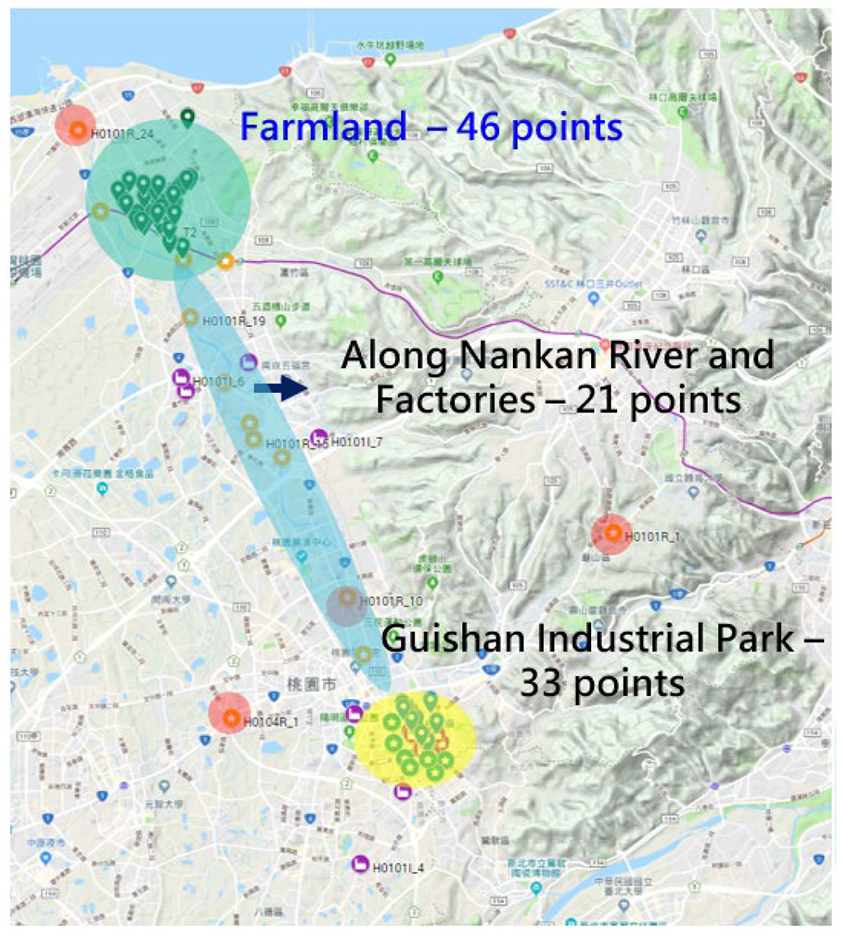
Planned deployment sites along Nankan River in Taoyuan City.
Case study: data analysis results
Based on transmission data from the deployment of 100 water quality sensors, this section presents three cases, in which we applied environmental management structures and data analysis modules that combined early warning of data anomaly, data analysis, source tracing, and data from potential pollution sources.
Data analysis procedure
Statistical analysis of data was performed during the period of 2018/10–2019/8/15, primarily measuring the five values of pH, temperature, conductivity, copper ions, and COD. Statistical analysis of data was divided into four major steps (Figure 12):
Analysis of data completeness: data completeness was measured for each machine daily to confirm the representation of data. Completion rate was more than 80% for all stations.
Data quality analysis: water quality was classified by properties such as farmland, rivers, and industrial parks. We were performed in parallel with the functioning of the proposed water quality monitoring system and classical determinations of the water quality parameters, to make a comparison between values every 3 months. The accuracy result is pH 97.7%, temperature 95.7%, EC 88.3%, COD 71.3%, copper ions 67.4%. Data quality is confirmed to be good, and the devices are stable.
pH value below 6 or exceeds 9, temperature exceeds 38°C, EC exceeds 750 μS/cm (irrigation channels), COD exceeds 100 mg/L.
Time and space anomaly analysis of water quality: as in Step (2), high data quality allows for space and time anomaly analysis of water quality to understand changes in values from upstream to downstream monitoring points.
Recommendations for application of law enforcement: based on the data, suspected factories with anomalies and high pollution risk were reported to relevant agencies for auditing.

Data analysis process.
Case study
This case study describes a method to confirm possible discharge points of pollution sources when complete, high quality data are within reasonable ranges, which can be used in a space and time anomaly analysis to pinpoint monitoring points with abnormal water quality data for confirmation with upstream data in the same timeframe. The time anomaly analysis method allows for observation of whether there are periodic variations in the high/low peaks of water quality data in different timeframes, and the linked relationships between monitored data.
Case 1: time anomaly in a monitoring station
This monitoring station pinpointed the supplemental sewer of a factory working with electronic components along Nankan River. The factory is a high-pollution potential business registered within the controlled emissions zone of the Environmental Protection Agency (EPA). Data analysis module results show (Figure 13) that over a period of 5 days from 2019/5/13 to 2019/5/17 during the timeframes of 9:00–10:00 and 16:00–18:00, conductivity exceeded legal standards and was recorded at 2000 μS/cm. In addition, the early warning system automatically resolved over 80 percentile of outliers and time to observe whether conductivity was linked to any other monitored data. It was discovered that when conductivity signals reached high values, pH would increase from 3–4 to 7–8, allowing the early warning analysis to identify a clearly linked relationship. Also, the pH value exceeded the lower legal limit from 5/13 to 5/15. After the maintenance team inspected the devices to exclude equipment anomalies, preliminary assessments showed that there was suspected pollution and reports were submitted to relevant agencies to audit the target.

Case study: chart of time data anomaly of an electronic component factory.
Case 2: COD anomaly at a monitoring station
This monitoring station pinpointed the supplemental sewer of a factory working with metallic surface treatment along Nankan River. The factory is a high-pollution potential business registered within the controlled emissions zone of the EPA. The electroplating wastewater from acid-stripping metallic surfaces contained high concentrations of COD that can suffocate and kill water organisms when dumped into natural bodies of water. Thus, legal regulations are becoming more stringent with the current limit at 100 mg/L.
Results from the data analysis module show that during the period of 4/22–4/30 (Figure 14), this monitoring station displayed high value signals, sometimes exceeding legal limits. The cause of this anomaly may possibly be due to wastewater discharged from the factory, as it has been audited and penalized many times due to wastewater dumping violations. This case was reported to relevant agencies as an auditing target.

Case study: data anomaly chart from monitoring a metallic surface treatment factory.
Case 3: space anomaly at an industrial park monitoring station
This case analyzed Guishan Industrial Park by monitoring bodies of water including rainwater sewers, external in-flows, factory wastewater discharge outlets, and discharge outlets from wastewater treatment facilities to form a comprehensive upstream/downstream relationship network to facilitate the accuracy of space analysis.
Results from the data analysis module (Figure 15) show that the monitoring station at the topmost upstream section (a) recorded conductivity of approximately 1500 μS/cm; observation of the monitoring station (b) in the downstream rainwater sewer began to show high conductivity at approximately 2500 μS/cm; and the monitoring station (c) further downstream, located at the factory wastewater discharge outlet where there was a decreased conductivity, was recorded at approximately 1800 μS/cm. It can be seen that a high conductivity wastewater pollution source existed between monitoring stations (a) and (b), while conductivity decreased due to dilution from factory wastewater between (b) and (c). Further analysis of suspicious factories between (a) and (b) resulted in identifying a nearby high-pollution electronic component factory as the primary suspect. The relevant agencies were contacted to list the factory as an auditing target.

Case study: diagram of data anomalies at Guishan Industrial Park.
Discussion
Compared to past sampling and testing methods that required human labor, this study constructed a data analysis model based on wide deployment of IoT water quality sensors to achieve the functions of early warning, source tracing, and hotspot analysis to greatly increase the time and space resolution of monitoring data, as well as emergency response time. This study was verified in Taoyuan City through the deployment of 100 miniaturized water quality monitoring devices by collecting data for 1 year. Early warning models based on data characteristics achieved automatic anomaly detection functionality and apprehended several polluting factories. The viability of this solution has been proven successful for the goals of monitoring water quality through mass deployment, automatic early warning, and real-time response.
Conclusion
Different from traditional monitoring, the study employed water quality IoT technology, obtaining massive data via extensive deployment of sensors, which were then used in constructing new water quality application models, including an alert model and forecast model. In this article, we proposed the total solution for an IoT water quality monitoring system that integrates with the water quality sensors, deployment strategy and data analysis model. The purpose is to provide a uniform guide for automatic continuous water quality monitoring systems.
This study recommends utilizing miniaturized water quality monitoring equipment that is compact, low cost, and allows for the optimization and standardization of deployment strategies that increase cost effectiveness. Upstream pollution source tracing and downstream pollution hotspot predictions can be achieved through mass deployment to obtain high-resolution monitoring data of space and time supplemented by a data analysis model that integrates data from multiple areas to provide early warning during data anomalies. Finally, the case study deploying 100 miniaturized water quality monitoring devices in October of 2018 successfully applied the data analysis model to screen cases of data anomalies in water quality for use in law enforcement. The subsequent improvement in environmental quality verifies the viability of this study.
In the future, we will promote the application of the IoT water quality monitoring system for use in industrial/medical fields, and the general public in such areas as the monitoring of wastewater processing. Based on change in historical data, we have set up alert modules for water quality inside monitoring stations, and adjusted processes and processing units via IoT equipment in real time, to optimize the process. The addition of big data analysis models and use of machine learning to provide early warning and smart control functionality in cooperation with government deployment policies will further develop Taiwan’s IoT industry chain.
Footnotes
Handling Editor: Paolo Barsocchi
Declaration of conflicting interests
The author(s) declared no potential conflicts of interest with respect to the research, authorship, and/or publication of this article.
Funding
The author(s) disclosed receipt of the following financial support for the research, authorship, and/or publication of this article: This research was supported by the Taiwan EPA under the project No. EPA-107-LS01-02-A022.