
Abstract
Globally, under-five child mortality is a substantial health problem. In developing countries, reducing child mortality and improving child health are the key priorities in health sectors. Despite the significant reduction in deaths of under-five children globally, developing countries are still struggling to maintain an acceptable mortality rate. Globally, the death rate of under-five children is 41 per 1000 live births. However, the death rate of children in developing nations like Pakistan and Ethiopia per 1000 live births is 74 and 54, respectively. Such nations find it very challenging to decrease the mortality rate. Data analytics on healthcare data plays a pivotal role in identifying the trends and highlighting the key factors behind the children deaths. Similarly, predictive analytics with the help of Internet of Things based frameworks significantly advances the smart healthcare systems to forecast death trends for timely intervention. Moreover, it helps in capturing hidden associations between health-related variables and key death factors among children. In this study, a predictive analytics framework has been developed to predict the death rates with high accuracy and to find the significant determinants that cause high child mortality. Our framework uses an automated method of information gain to rank the information-rich mortality variables for accurate predictions. Ethiopian Demographic Health Survey and Pakistan Demographic Health Survey data sets have been used for the validation of our proposed framework. These real-world data sets have been tested using machine learning classifiers, such as Naïve Bayes, decision tree, rule induction, random forest, and multi-layer perceptron, for the prediction task. It has been revealed through our experimentation that Naïve Bayes classifier predicts the child mortality rate with the highest average accuracy of 96.4% and decision tree helps in identifying key classification rules covering the factors behind children deaths.
Introduction
Child mortality is one of the most widely used measures for the well-being and health of children. Globally, deaths of millions of under-five children occur, and this death rate could be prevented with timely immunization intervention. Although there has been a significant reduction in the global deaths of under-five children, still it remains an alarming public health issue for the developing countries. In 2016, the under-five death rate world-wide was 40 deaths per 1000 live births (lb), 1 which was significantly reduced from the previous death rate of 93 per 1000 lb. However, the desired rate of 25 per 1000 lb by 2030 is still a challenging task for the developing countries. 2
Developing countries, particularly having middle or low income, are more vulnerable to child mortality. Pakistan is one of the developing countries which are struggling to achieve low mortality rate. According to the United Nations Development Program (UNDP, 2018) annual report, Pakistan ranks at 150 out of 189 on the human development index (HDI). Internationally, Pakistan has the third highest burden of children, maternal, and fetal deaths. Although, there is a noticeable reduction from 112 deaths per 1000 lb in 1991 to 74 deaths per 1000 lb in 2018. Yet, the reduction rate is not very encouraging if we compare it to relatively low-income country like Ethiopia, as shown in Figure 1. The gap between Ethiopia and Pakistan is widening with each year which is a serious concern. In 2018, mortality rate in Ethiopia reduced to 54 from 104 but in Pakistan it dropped to only 74 from the starting value of 98 in 2006. It makes Pakistan lower than the underdeveloped country like Ethiopia in the mortality rate of under-five children. In this article, one of the objectives of our study is to analyze and compare the healthcare data of both countries to discover the patterns and determinant factors of child mortality.

Mortality rate of under-five children in Pakistan, Ethiopia, and globally yearly (https://data.worldbank.org/indicator/SH.DYN.MORT?locations=PK).
For data analysis, we have utilized the publicly available demographic survey data sets, namely, Ethiopian Demographic Health Survey (EDHS) and Pakistan Demographic Health of Survey (PDHS), of both countries. 3 Indeed, there is a dire need for comparative data analysis to aid the health professionals in identifying key factors that are putting barriers toward achieving the desired child mortality rate. Moreover, the predictors mentioned in the survey data sets have been ranked using information gain measure to identify the most information-rich variables present in both data sets.
Machine learning approaches have been widely used in the past for predictive modeling in a variety of domains. More recently, these techniques have been used for different purposes, that is, child mortality factors’ identification,4,5 finding correlations among the key factors,6,7 and under-five child death prediction. 8 In the past, different data sets, namely, EDHS, PDHS, and Pakistan Social, Living and Standards Measurement (PSLM) macro-level data set, have been used for data analysis and prediction. Several techniques, such as binary logistic regression (BLR), principal component analysis (PCA), bivariate and multivariate analysis, maximum likelihood method (MLM), decision tree (J48), and rule induction (pruning rule-based classification tree (PART)) algorithm, have been exploited to improve maternal health and to reduce child mortality. However, there is no study which analyzed and compared the two data sets of similar nature to predict child mortality and the possible reasons behind high mortality rates. Moreover, the previously reported literature lacks the availability of a generic prediction framework for accurate estimation of child mortality rates using machine learning techniques.
This study aims to develop such a predictive framework that can be used by health professionals for forecasting the child death rates for timely interventions and possible reduction in factors causing high rates. EDHS and PDHS data sets have been used for the validation of our proposed framework. These real-world data sets have been tested using machine learning classifiers, such as Naïve Bayes (NB), decision tree (J48), rule induction (PART), random forest (RF), and multi-layer perceptron (MLP), for the prediction task. Experimental results show that NB classifier predicts the child mortality rate with the highest average accuracy of 96.4% and decision tree helps in identifying key classification rules covering the factors behind children deaths. The results obtained through our experiments and the developed predictive framework could help in child health interventions in developing countries like Pakistan which does not have a large pool of trained human resources for health. Internet of Things (IoT) enabled smart healthcare systems have predictive power, similar to the one developed in this work, which is the key to reduce child mortality and to improve the health sector of developing countries.
Related work
In this section, we review the closely related work and highlight the strengths and weaknesses of the previously reported approaches. The purpose of this section is to focus on those approaches which used data analytics as a core to reduce child mortality rates. Furthermore, we have included only those studies in which data of the two developing countries, that is, Ethiopia and Pakistan, have been used for analysis. Moreover, only those studies are included in this section which utilized automated analysis of prediction methods instead of those studies which used traditional statistical methods for estimating the mortality rates.
In the work reported in Khan et al., 4 the authors used socioeconomic factors of children death in Pakistan. PDHS 2012-2013 data set was used for analysis. BLR was applied on 7297 records after transforming the correlated variables using PCA. The outcome of this analysis validated that no indication of gender inequality in under-five children deaths and also explained that the health behavior of parents did not affect their male and female children. It has been also with their work that a child’s large size at birth, greater birth interval, more family members, mother’s ownership of assets, education, and decision taken at the household level cause a significant decline in children death. The strength of this work was the utilization of statistical method for finding important variables using PCA; however, only regression model has been adopted for analysis. Both PCA and BLR methods have individual limitations. For instance, PCA works best when the data are normally distributed. For skewed data sets, the method does not provide good results. Similarly, BLR is not very effective for non-linear data sets. Finally, the proposed work lacks the utilization of other classification algorithms which are more suitable for prediction tasks.
Another study 5 determined and grouped indicators and revealed the fact that social, economic, and environmental indicators were associated with child mortality in Pakistan. The authors have also used BLR analysis for the estimation of child mortality. According to this study, mother’s education, preceding birth interval, family size, size of child at birth, birth order, region, and breastfeeding are found to be determinants of child mortality in Pakistan. As compared to other regions, child mortality was investigated and found higher in the province of Baluchistan. This study also highlighted that child mortality was significantly lower where breastfeeding was done timely. However, similar to the previous study, 4 there was no advanced predictive analytical technique used for the accurate estimation of child death. Nevertheless, the major contribution of this work was the identification of priority areas of intervention and the identification of determining factors based on statistical analysis.
In terms of identifying determining factors behind child mortality, similar work was presented in Rabbani and Qayyum. 6 The authors investigated the significant determinants of under-five child mortality in Pakistan and notified that Pakistan is named among the five countries that have the highest under-five child mortality rate. PDHS data were utilized in this study collected through National Institute of Population Studies (NIPS) and achieved that children death aged below 1 year is much higher in Pakistan as compared to the rest of the age group. In wealth, mother’s education and exposure to media were found to be the important factors of child mortality in Pakistan. Binary logistics and MLM were used for estimation of econometric and it was suggested that knowledge of local level areas and their population is fundamental for shaping effective policies to resolve the mortality problem. Furthermore, it was suggested that social aspects like awareness, exposure to media, and mother education are the most influential factors to decrease child mortality. A relatively different type of approach has been reported in Wagnew et al., 9 where the authors have studied the severe acute malnutrition (SAM) in Ethiopia. Although, they have not used any estimation or prediction method, yet, their systematic review included 21 studies and comprising of 8057 children with SAM. This study indicated that the most common reasons for child mortality are diarrhea, dehydration, and anemia.
For the same quest of reducing child mortality, Arif A and Arif GM 7 studied the demographic, economic, environmental, and geographical aspects of children death in Pakistan. The data set of PSLM was used which had 13,540 children of under-five age and classified into two zones of rural and urban areas. It was identified that diarrheal infection was the common cause of child mortality followed by respiratory infections. Once again, the commonly used technique of linear regression and maximum likelihood were used to identify the factor that causes morbidity. Similar to the aforementioned work, this study lacked the utilization of diverse methods for prediction and estimation. Moreover, the methods utilized in this work were heavily relying on the assumption that the suitable data on child mortality will be available for analysis. This is a very strong assumption as it is often seen that the data of child health vary from different regions and there is a lot of data pre-processing required to make it workable for the statistical methods for accurate estimations.
More recently, a data mining–based approach was used in Dileba 10 to discover the causes of under-five children admitted to the pediatric ward. The authors studied the case of Nigist Eleni Mohammed Memorial Zonal Hospital. Well-known data mining approaches, namely, J48 and artificial neural network (ANN), have been used to support the discovery of causes of children admission. A data set of 11,774 instances has been used to develop the model for identification and it was revealed through experimentation that J48 had higher accuracy of 94.77% as compared to ANN method. Furthermore, rules based on the decision tree have been analyzed and it was found that a very high percentage of children (98.32%) have been admitted to the hospital because of not taking food, fluid, or breastfeeding. This study had the obvious advantage of exploiting data mining techniques for finding the cause. However, both methods, that is, J48 and ANN work best for a limited data set. For high dimensional and high volume data sets, these methods do not scale well. Moreover, the results could not be generalized on a larger data set because only the data of one ward and one hospital are not enough to conclude. Finally, as discussed earlier, these methods heavily rely on pre-processed data which are a big hurdle for the healthcare practitioners as they have to depend on data analysts for data pre-processing and it limits the applicability of such mining-based models in real-life scenarios.
A similar data mining–based approach was used in Tesfaye et al. 8 A web-based child mortality prediction model was proposed to identify the determinants. J48 and PART techniques were used for rule induction methods and EDHS data have been utilized for prediction of children death. The authors have used a well-known Waikato Environment for Knowledge Analysis (WEKA) tool for implementing. Logistic regressions and odds ratio (OR) were used in SPSS version 20.0 11 to detect factors of child deaths. Sensitivity, accuracy, specificity, and area under receiver operating characteristics (ROC) curve were used to access the model validation. The constructed prediction model supported under-five child health ongoing programs in Ethiopia. This study used classification algorithms for the prediction task. An added advantage is that the web-based prediction model used Ethiopian language. However, besides the advantage of local language support, there a few limitations of their work. First, the rationale behind using only J48 and PART algorithm is missing. Presumably, author intended to generate rules. However, associative classification or association rule mining is more appropriate when the task is related to the generation of rules. Second, a number of other strong classification methods, such as RF which uses a collection of decision tree, were not tested. The common problem of overfitting which happens in tree-based approaches was not discussed. Finally, no mechanism for dimension reduction was given. In high dimensional data sets, there is a definite requirement of automated dimension reduction techniques to support the optimal performance of prediction models.
It is clear from the related work that multiple data mining practices were used in the past to find factors of child mortality and to predict mortality rates. However, there is a clear lack of a generalized predictive framework that supports highly accurate results and allows the health professionals to experiment with a different set of dimensions. This could only be possible if the users of the healthcare systems are given the choice of selecting the variables having high information. Another advantage of such an approach would be to develop such healthcare systems that scale well with high volume and high dimensional data. Healthcare data are increasing with an enormous pace and the development of prediction models with the scalability issue in mind is a major design requirement. Motivated by this, we develop a predictive framework of under-five child mortality which has the support of dimensional ranking and generalizability for wider application.
Proposed framework of under-five mortality prediction
In this section, we present the framework for under-five child mortality prediction. The framework is depicted in Figure 2. The framework takes input data and in the first step, relevant features are extracted. The extracted features are then pre-processed for data cleansing. On the pre-processed data, we apply information gain measure to rank the information-rich features. Ranked features are then split into training and test sets used for model building and model evaluation, respectively. For model building, we use the predominant machine learning classifiers and for its evaluation advanced measures such as accuracy, precision, recall, true positive (TP) rate, and false positive (FP) rate are used. It is important to highlight here that our proposed framework uses the best machine learning algorithm for the final prediction. The rationale behind this approach is that some classifiers work well with a specific type of data; therefore, it is not the best approach to fix the classifier for prediction purposes. Instead, the relevant set of classifiers is evaluated and the one giving the optimal performance is selected for the final prediction.

Proposed framework for child mortality prediction.
Data set details
For experimentation, we have used two case publicly available data sets, namely, EDHS and PDHS. These data sets have a diverse set of features and have the potential to reveal the determinant factors associated for child mortality. In the following sections, we give a brief overview and the set of risk factors associated with child death in each of these data sets.
EDHS data set
EDHS data set is a nationally representative cross-sectional study 3 and it provides a comprehensive overview of population, maternal, and child health in Ethiopia. The information about the data set gathering methods is given in the 2011 EDHS report which is freely available on the World Wide Web. A sample of 11,654 records was selected from this data set. Moreover, relevant socioeconomic and demographic factors were extracted from the data set. The class variable in this data set is child survival status which has to be classified as “alive” or “dead.”Table 1 shows the risk factors or predictors associated with the children death in Ethiopia.
Predictors of child mortality in Ethiopia.
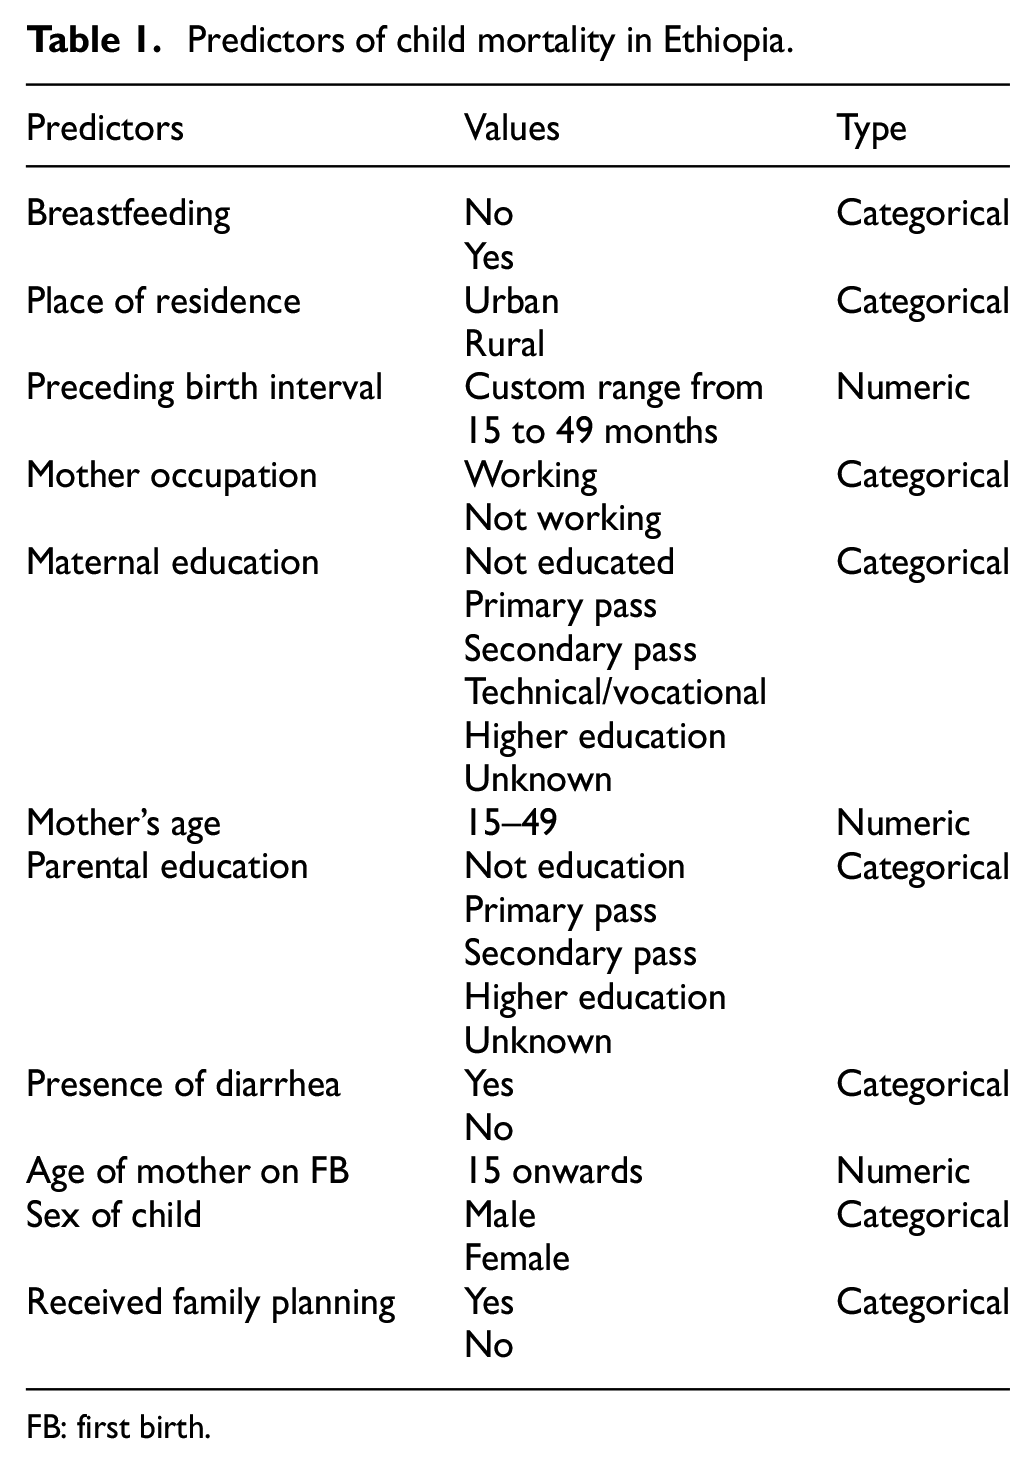
FB: first birth.
PDHS data set
Similar to EDHS data set, PDHS is a cross-sectional study conducted at a national level and provides an inclusive overview of population, maternal, and child health. The metadata about the data set collection methods is given in the PDHS 2017–2018 annual report which is accessible online. The PDHS followed a two-stage model design to choose respondents for the research.
In Pakistan, samples of 12,912 households were selected and 11,869 families were successfully interviewed (excluding Azad Jammu and Kashmir and Gilgit-Baltistan). In Azad Jammu and Kashmir, of the 1,792 selected households, 1,697 were cross-examined and of the 1,064 selected households, 974 were interviewed. Relevant socioeconomic and demographic factors were extracted from the data set. Table 2 shows the predictors associated with child mortality in Pakistan.
Predictors of child mortality in Pakistan.

KPK: Khyber-Pakhtunkhwa; GB: Gilgit-Baltistan; ICT: Islamabad Capital Territory; AJK: Azad Jammu and Kashmir; FATA: federally administered tribal area.
Data pre-processing
Once the data are loaded in our model, the next immediate step is to pre-process the data by utilizing different data cleansing methods. In this process, we remove the duplicate records and handle the missing values using the predictive mean matching (PMM) method available in SPSS software. Furthermore, we have also transformed the categorical values into numeric numbers. Another important task in pre-processing is to balance the class variable. Generally, the ratio of dead children is very low in the data set, therefore, we need to balance it using a class balancing method called synthetic minority oversampling technique (SMOTE) using WEKA 3.8 tool. 12 It balances the class variable to a ratio of 60:40 from the initial ratio of 95:5. SMOTE uses data augmentation of the minority class. It creates new instances synthesized from the existing instances.
Feature ranking using information gain
The next step of the proposed framework is to apply information gain measure to rank the selected features from the data sets. This is done by calculating the information gain values for each of the selected features. Entropy, which is a measure of spread in a given feature, is utilized to calculate the information gain which is the entropy of the distribution before the split minus the entropy after splitting. We rank the features accordingly and features of high information gain values are used for the next step for model building.
Model building
In this step, 70% of the data are used for building or training the classification models. We have used the predominant machine learning classifiers to train the model. These classifiers include J48, PART, MLP, NB, and RF. In the healthcare domain, a decision tree or J48 algorithm is widely used to classify the labels. The decision tree is an effective and commonly used classifier to determine conditional probabilities in research analytics.13,14 Decision tree creates a binary tree and it is useful in classification problems as each terminal node of the tree specifies a particular class label. 15 This classifier also helps in generating decision rules which help in understanding the underlying pattern of data instances. Similarly, a rule-based classifier, PART, is also used in our framework.
RF is also used to classify the labels of class to check which classifier performs better on the data set. The RF creates the subsets from the data set and also creates a new bootstrapped data set of identical size. The bootstrap data set has trees generated by decision trees and each tree takes input individually. The new input is assigned to the class label by a vote of all decision trees. The maximum voted class label through decision trees is attained a new input. The process of this classifier chooses a sample randomly. So, there is a chance that some of the samples are not considered 16

The above equation used to calculate bagging. Bag shows the recurrence of bagging. A classification tree is fb that trains in the training set.
Bayesian network (NB) classifier is also used in the healthcare domain by identifying the determinants and checks the posterior probability using the prior probability and adding likelihood that is a new evidence. It is also performed well in data analytics and generates the best classifier results17,18

Finally, MLP is utilized for model building. It is a feed-forward ANN which consist of multi-layers of nodes. In the network, each layer is fully connected with the next layer. Input nodes represent the numbers of attributes. A linear combination of input with weight “W” and bias “B” then applies the activation function. 19 The formula of the activation function in MLP is shown below

Model evaluation
After the classification, model has been trained by the selected set of machine learning classifiers. The next task is to evaluate each of the models using the 30% data known as test data. This helps in ensuring that which particular model performed the best in terms of predicting child mortality. Confusion matrix, a standard way of measuring the accuracy of classifiers is used to see the dead and alive child classes. Furthermore, we evaluated the performance using precision, recall, TP rate, and FP rate. Precision is the ratio of TP records identified to the total number of TP and true negative records. It is usually expressed in percentage. Similarly, recall is the ratio of the number of TP retrieved to the total number of relevant records in the data set. The formula for calculation of each measure is given in Figure 3.
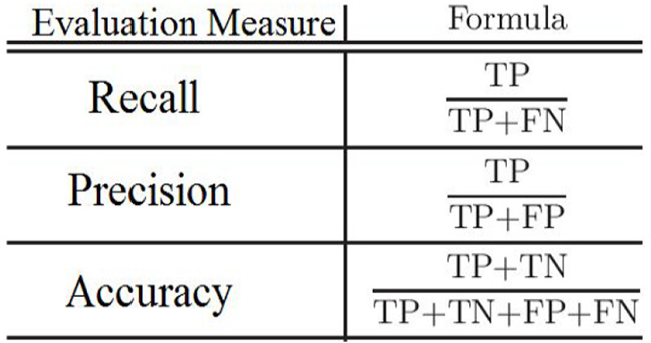
Measures used for model evaluation.
Experimental results and discussion
In this section, we present the experimental results obtained with the help of our developed framework. First, we took 11,654 records and the associated predictors from the EDHS data set. On the extracted predictors, information gain measure was applied and respective values have been calculated. Most influential demographics and socioeconomic health predictors were ranked using information gain. High dimensional data require a large capacity of storage and high computational cost; consequently, it is therefore essential to reduce data dimensions for the learning performance. 20
Figure 4 presents the extracted features using information gain. Higher values of information gain indicate features that are information rich and have a high correlation with the target or class variable. It can be seen from Figure 4 that the features titled “Age of mother at first birth” and “Age of mother” are the highly ranked variables. In other words, it reflects that age of mother at the time of first birth or any subsequent birth, which is the most influential feature with respect to its association with child mortality. Similarly, it is clear from the low-ranked values of “place of residence” and “received family planning” are less likely to have some relation with the target class.

Features ranked according to information gain.
Another interesting aspect that can be seen from Figure 4 is that “breastfeeding” feature is in the top three ranked features. This shows that our method of information gain not only covers the underlying data pattern but also depends on the results of the ranking in line with common healthcare domain knowledge. It is commonly known to healthcare professionals that breastfed babies are less likely to die at an early age. Similarly, the parent education aspect is also a known factor that has strong relationship with child death. As reported in Patel et al., 21 the infant mortality trends in Pakistan indicate that infant mortality declined slightly in the last 28 years and the education of women was a major contribution to this decline. Parents with good educational background tend to vaccinate their children and follow the routine immunization schedule which makes their children healthy as compared to the parents with low education.
After getting the ranked variables, we have built the classification model for prediction using the 70% of training data. For model building, we first picked all the 11 features ranked by the information gain measure. The models were tested on 30% testing data and the results gathered for model evaluation are given in Table 3.
Evaluation of classification models using all features (EDHS data set).

EDHS: Ethiopian Demographic Health Survey; TP: true positive; FP: false positive; MLP: multi-layer perceptron; PART: pruning rule-based classification tree.
Table 3 shows that NB classifier outperformed all other classifiers with the highest accuracy of 94.68%. Later, we have used the top eight ranked features and ran the same experiment once again with the same set of classifiers. The purpose of repeating the experiment with the ranked variables is to highlight how effective is the use of information gain measures by comparing the ranked features results with the results obtained through all the features. The results obtained using the top eight features are given in Table 4. It is seen from Table 4 that with a significantly lower number of features, we managed to achieve almost the same accuracy with all the classifiers. Once again, NB achieved 94.65% accuracy with the less number of ranked features. It shows that the information gain method helps the analysts to get the important features for the classification task. The results of other classifiers support our argument too as it can be seen that RF, PART, J48, and MLP accuracy results did not drop significantly. With our recommended approach, fewer features and dimensions could be used to achieve reasonable accuracy.
Evaluation of classification models using the top eight features (EDHS data set).
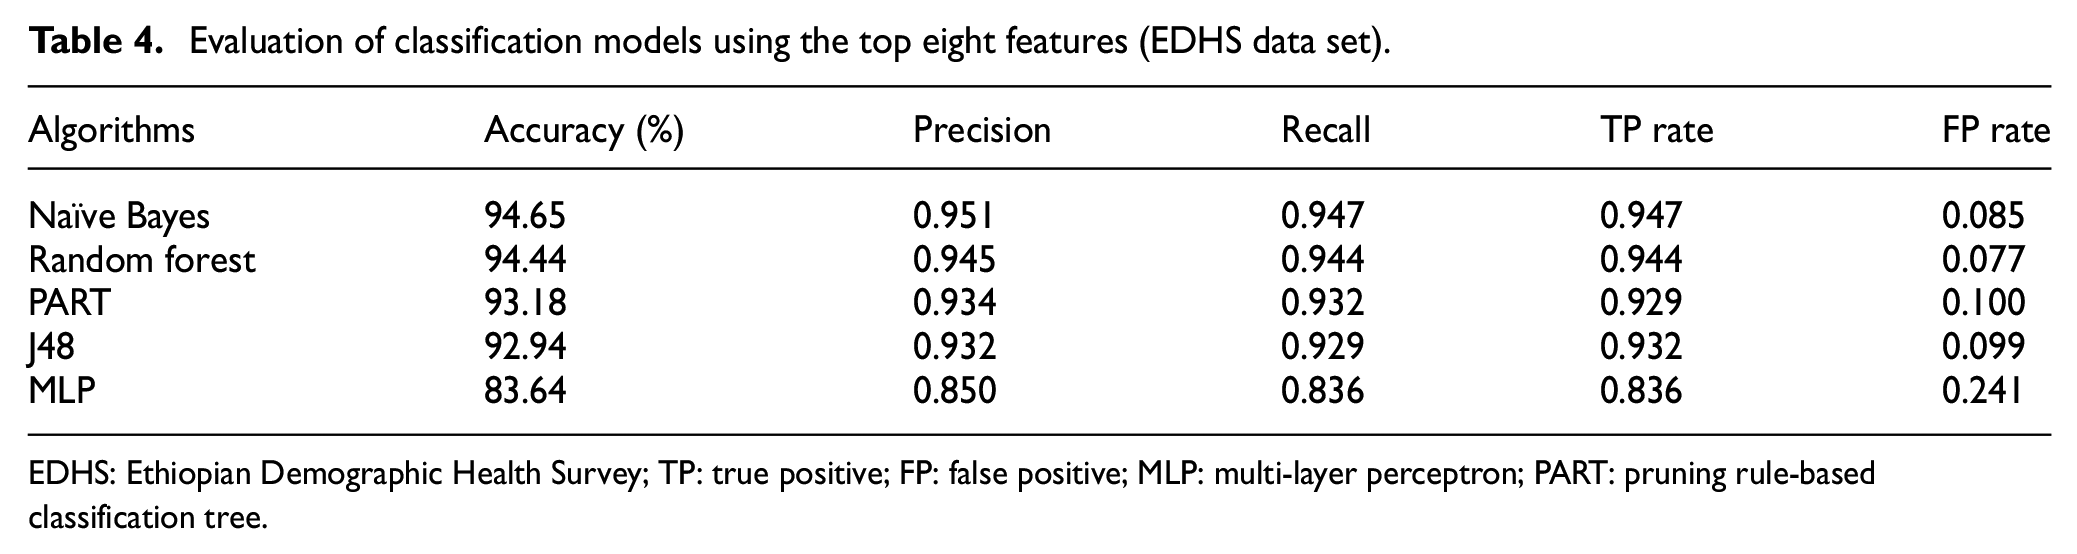
EDHS: Ethiopian Demographic Health Survey; TP: true positive; FP: false positive; MLP: multi-layer perceptron; PART: pruning rule-based classification tree.
Similarly, we applied the same set of classifiers on our second data set of PDHS. We used the same mechanism of utilizing the information gain measure to rank the feature set as done in the previous experiment. The accuracies achieved with the top eight ranked features are given in Table 5. Similar to the results of EDHS, in PDHS, NB happens to be the best algorithm with the highest accuracy of 96.40%. The only difference is that in EDHS the second best classifier was RF but for PDHS it is PART algorithm.
Evaluation of classification models using the top eight features (PDHS data set).

PDHS: Pakistan Demographic Health Survey; TP: true positive; FP: false positive; MLP: multi-layer perceptron; PART: pruning rule-based classification tree.
It can be seen from the results presented in this section that the mortality rate in developing countries such as Ethiopia and Pakistan is high in number per 1000 births as compared to developed countries. Through our analysis, it is clear that in both the countries the common factors affecting the child mortality are breastfeeding status and parental education. However, for performing the prediction task, other factors also play a vital role. Therefore, in our proposed framework, information gain was intelligently utilized for automatic selection of those features only which are information rich. Predictive analytics is now becoming popular in the healthcare domain because there is a dire necessity to predict the previously unknown patterns, associations, and other valuable information in healthcare data set. 22 It leverages and helps the healthcare professionals to make timely interventions, to update existing healthcare policies, and to maintain an individual’s health profile in developing recommendation systems.23,24
A number of predictors were discussed including mother’s age at first birth, age of mother, breastfeeding, parental education, sex of a child, preceding birth interval, mother occupation, maternal education, receiving family planning, place of residence, and presence of diarrhea, as causal factors of child death. The research community also notified that the higher risk of mortality can be reduced by breastfeeding the children timely.25,26 Similar studies also witnessed that low birth weight of children, no family planning, and no gap in birth internal led to increased risk of child mortality.27–29 Our study using the two data sets also indicates that children whose mothers have good educational background are less likely to die at under-five age than those whose mothers do not have good education. Some studies,30–32 however, emphasize the use of family planning information to be more significant than parent education in terms of its association with child mortality. In this study, we also highlighted the mother attributes like the age of mother at first birth and occupation of the mother are also significant in mortality of child especially in low- or middle-income countries like Pakistan. These results are in line with the study reported using Ethiopian data. 33
The work done is this article highlights the predictors of child mortality and ranked the factors that are strongly associated with childhood mortality. Our predictive analytics framework on the survey data of both EDHS and PDHS showed that probability-based classifier, that is, NB is the most accurate in terms of predicting child mortality. Furthermore, our generic framework of prediction gives a good path of performing intelligent data analysis. With this framework, researchers and practitioners are able to detect and predict the children that are at a higher risk of dying using their own data sets. Finally, our work ascertains the role of parental education toward child mortality and health professionals can think of enhancing the facilities to provide education related to maternal and child health to reduce mortality in the developing countries.
Conclusion and future work
In this article, a framework has been proposed for the prediction of child mortality. The proposed framework used information gain measure to select important data features and utilized machine learning algorithms for the prediction task. Experiments have been performed on data sets of developing countries, that is, Ethiopia and Pakistan. We tested with the predominant machine learning algorithms such as NB, J48, PART, RF, and MLP and identified that for both EDHS and PDHS data sets, NB with 96.4% accuracy outperformed the other classifiers. Furthermore, our experimentation with the complete set of features and with the top ranked features highlighted that the reduction in features on the basis of information gain does not affect the prediction accuracy. Almost the same accuracies have been achieved with relatively less number of features which were intelligently selected with the help of information gain measure. Our analysis also revealed that the attributes including age of mother at first birth, age of mother, breastfeeding, parental education, and mother occupation are the most significant risk factors and are directly associated with childhood mortality. Predictive analytics significantly advances the smart healthcare systems to forecast death trends for timely intervention. Moreover, it helped in capturing hidden associations between health-related variables and key death factors among children. Future work is mainly intended toward the use of ensemble-based classifiers for the prediction task. Moreover, we are investigating on developing a framework that can take live health data streams and big healthcare data for efficient processing and advanced predictive analytics. Also, there is a need to augment this work with powerful visualization tools which the health professionals can use for interactive and visual exploration of underlying data trends and patterns.
Footnotes
Acknowledgements
This work has been conducted under the Predictive Analytics Lab which has been established by Pakistan’s National Center for Big Data and Cloud Computing (NCBC) under the supervision of Higher Education Commission (HEC) and Planning Commission of Pakistan.
Handling Editor: Ubaid Abbasi
Declaration of conflicting interests
The author(s) declared no potential conflicts of interest with respect to the research, authorship, and/or publication of this article.
Funding
The author(s) disclosed receipt of the following financial support for the research, authorship, and/or publication of this article: This research was supported by the Ministry of Science and ICT (MSIT), Korea, under the Information Technology Research Center (ITRC) support program (IITP-2020-2016-0-00312) supervised by the Institute for Information and Communications Technology Planning and Evaluation (IITP), the faculty research fund of Sejong University in 2019, and the Ministry of Science, ICT & Future Planning (MSIP), Korea, under the National Program for Excellence in SW (2015-0-00938) supervised by the Institute for Information and Communications Technology Planning and Evaluation (IITP).