
Abstract
Power load forecasting is an important guarantee of safe, stable, and economic operation of power systems. It is appropriate to use interval data to represent fuzzy information in power load forecasting. The dual possibilistic regression models approximate the observed interval data from the outside and inside directions, respectively, which can estimate the inherent uncertainty existing in the given fuzzy phenomenon well. In this article, efficient dual possibilistic regression models of support vector machines based on solving a group of quadratic programming problems are proposed. And each quadratic programming problem containing fewer optimization variables makes the training speed of the proposed approach fast. Compared with other interval regression approaches based on support vector machines, such as quadratic loss support vector machine approach and two smaller quadratic programming problem support vector machine approach, the proposed approach is more efficient on several artificial datasets and power load dataset.
Keywords
Introduction
With the rapid development of wireless sensor networks,1–6 Internet of things,7–17 and machine learning,18–21 ability of human to perceive nature and analyze data is becoming stronger. Power load forecasting is a typical application of the above technology. Power load forecasting is a technology that uses effective methods, historical data, natural and social conditions as the basis to determine the load value in the future.22–24 However, power load often changes with time and shows a fluctuating state which makes it difficult to be represented by an exact value. Interval data are widely used to represent these uncertain and imprecise information. As a very important tool for dealing with interval data, fuzzy regression analysis based on interval regression analysis is widely used to predict the values of interval dependent quantitative variables as the values of functions of independent variables, which were employed to forecast power load. 25
Generally speaking, interval regression model can be roughly classified into two distinct categories. One is called the least square approach, which is established by the principle of distance minimization between the estimated intervals and the observed intervals.26–29 Another is the possibilistic regression approach, which is established by aiming at minimizing the total vagueness of the estimated model under the condition that there are inclusion relationships between the observed intervals and the estimated intervals. 30 There are two kinds of possibilistic regression analysis models approximately according to the number of estimated output intervals. The first class is termed the dual possibilistic regression approach with two estimated interval outputs, one of which is the biggest scale of all possible estimated intervals which are included in the observation interval, and another of which is the smallest scale one which includes observation interval. 31 The second class is the possibilistic regression model that has a single interval output which includes observation interval or crisp value.32–36 The first possibilistic regression model was proposed by Tanaka et al. 37 and developed by his research team,38–40 and coefficients in the interval regression model are assumed intervals. In their early studies, the linear programming (LP) approach was employed to calculate coefficients of the interval regression model. However, some coefficients become crisps because of the characteristic of the LP approach. To overcome this problem, quadratic programming (QP) was incorporated into possibilistic regression model and the noncrisp coefficients obtained by QP are more desirable than by LP. But there are also some limitations using possibilistic regression models based on LP and QP. First, established by minimizing the empirical risk, these models more likely overfit to training dataset and affect prediction performance. Second, they are difficult to deal with nonlinear interval regression because of choosing a nonlinear model from an infinite number of alternatives.
Based on statistical learning theory, the support vector machine (SVM) has been very successful in pattern recognition and function estimation problem by solving a large quadratic programming problem (QPP).
41
So interval regression analysis approaches for fuzzy data based on SVM have been developed by some researchers. In Hong and Hwang,
42
the quadratic loss SVM for crisp input and interval output regression analysis approach was proposed, which was a model-free approach because the algorithm uses kernel functions to handle nonlinear regression problems. However, this approach is very sensitive to outliers. In Hwang et al.,
43
the support vector interval regression machine (SVIRM) was proposed to deal with crisp input and crisp output regression analysis, and ε-insensitive loss function was used to reduce the impact of outliers. In Jeng et al.,
44
to overcome the problem of slow convergence of neural networks, the support vector interval regression networks (SVIRNs) were proposed which employed a classical support vector regression (SVR) to obtain initial structure of networks and high value and low value of estimated interval were identified by two networks. But the above approaches can only deal with crisp input data. So in Chuang,
45
the interval support vector interval regression networks (ISVIRNs) were proposed to deal with interval input and interval output, in which the distance between two interval data was calculated by the Hausdorff distance and train SVR to determine the initial structure of networks. In Hao,
46
the v-support vector interval regression network (v-SVIRN) was proposed to evaluate interval linear and nonlinear regression models for crisp input and crisp output data. The model will automatically adjust a parameter-insensitive region of any shape, which contains all crisp number outputs, thus replacing the appropriate value of the insensitive pipe width in traditional SVR. In Xu et al.,
47
an extended SVM algorithm for the estimation of asymmetrical intervals was proposed. An independent and exact description of one end could be given in this approach, without the influence of the other end. One important property of SVM is that it has large computational time complexity because of dealing with QPP in the training model phase. The time complexity for SVM is
In this article, we consider dual possibilistic regression models with multiple crisp inputs and dual estimated interval outputs. Motivated by Twin-SVM, ITSVR, and two smaller SVM-type QPPs, the strategy of solving a few smaller QPPs, rather than a single larger QPP, significantly reduces the training time of regression model based on SVM approach. The proposed approach in this article employed a group of QPPs to estimate two upper model boundaries and two lower model boundaries which can have fast training speed. Moreover, slack variables are incorporated into the approach to avoid the influence of outliers on regression models.
The remainder of this article is organized as follows. Brief reviews of Hong’s quadratic loss SVM approach and Hao’s two smaller QPP SVM approach are presented in section “Background.” We propose interval regression models of SVM based on solving a group of QPPs in section “Dual possibilistic interval regression of SVMs based on a group of smaller QPPs.” The experimental results are reported in section “Experiments,” and some concluding remarks are made in section “Conclusion.”
Background
In this section, we give a brief introduction of dual interval regression models based on Hong’s quadratic loss SVM approach and Hao’s two smaller QPP SVM approach.
Hong’s quadratic loss SVM approach
Suppose given a fuzzy training dataset

Upper model


This regression model is constructed by solving the following QPP

subject to


where
Hao’s two smaller QPP SVM approach
Hao’s interval regression of the upper model


The reason that Hao refined the formula

Minimizing

where
Dual possibilistic interval regression of SVMs based on a group of smaller QPPs
Interval linear regression
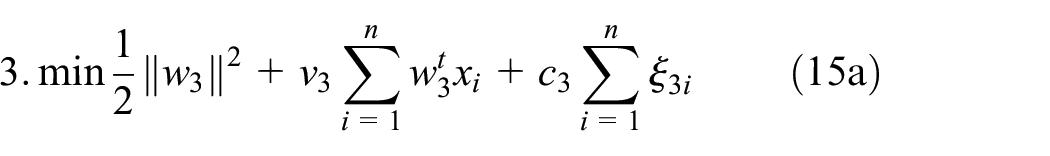
As mentioned earlier, an interval regression approach employs the strategy of solving two smaller QPPs rather than a single larger QPP which can significantly reduce the training time of regression models. Obviously, the smaller the scale of QPPs is, the faster the training speed of the interval regression approach is. Thus, in this section, the efficient dual possibilistic interval regression models of SVMs which employ a group of QPPs are proposed, and each of SVMs has a smaller scale QPP than the above approaches. In the proposed approach, the upper model
Upper model


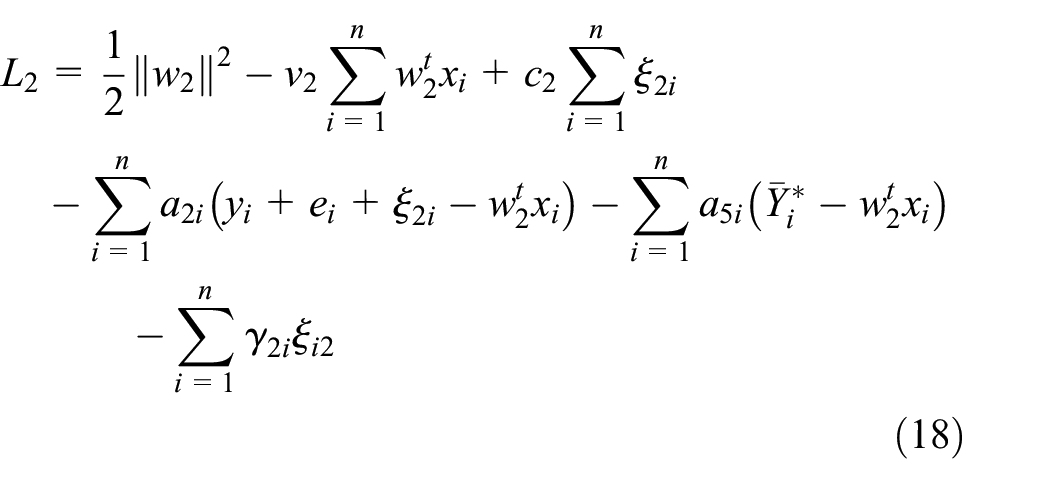
Lower model


where

subject to


subject to


subject to


subject to


where


where


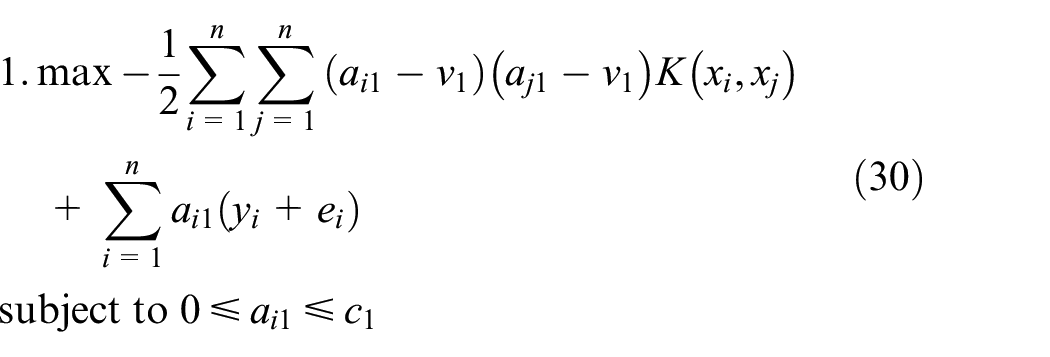
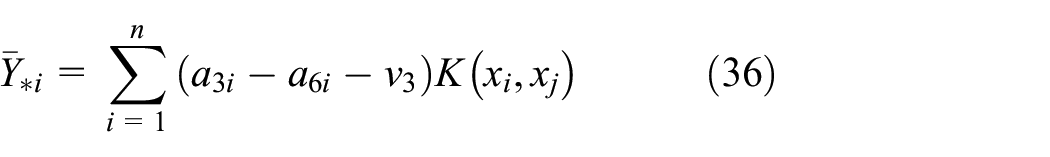
By the dual theorem, substituting equations (21)–(25) into equations (17)–(20), we can obtain the dual problem of equations (13)–(16) as


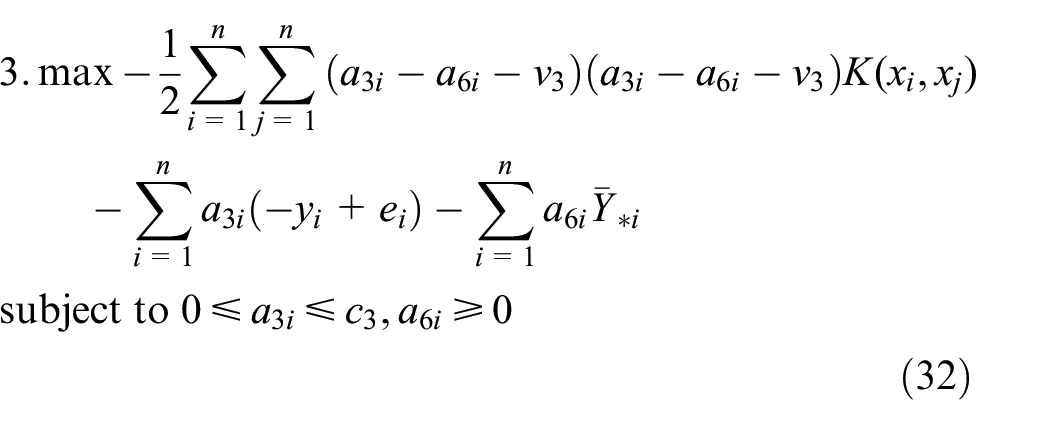
Solving the above four QPPs, we obtain the value of the Lagrange multipliers
Interval nonlinear regression
The proposed algorithm can be extended to a nonlinear interval regression model by employing kernel function, which donates as


It is worthy to note that the kernel function extends the application scope of the proposed model to deal with nonlinear interval regression, but it does not increase the time complexity of the training model. Using different kernel functions, training samples can be mapped into different high-dimensional feature spaces. Thus, the upper model
Nonlinear upper model


Nonlinear lower model

Experiments
In this section, we use three artificial datasets and a power load dataset to verify the regression performance of the proposed approach compared with Hong’s quadratic loss SVM and Hao’s two smaller QPP approach. All regression methods are implemented in MATLAB on Windows 7 running on a personal computer (PC). Gaussian kernel is employed because of its good performance in the interval regression field. Performances of these methods seriously depend on the choices of parameters. Thus, the best parameters for these algorithms are selected by the leave-one-out (LOO) cross-validation and a grid search approach.
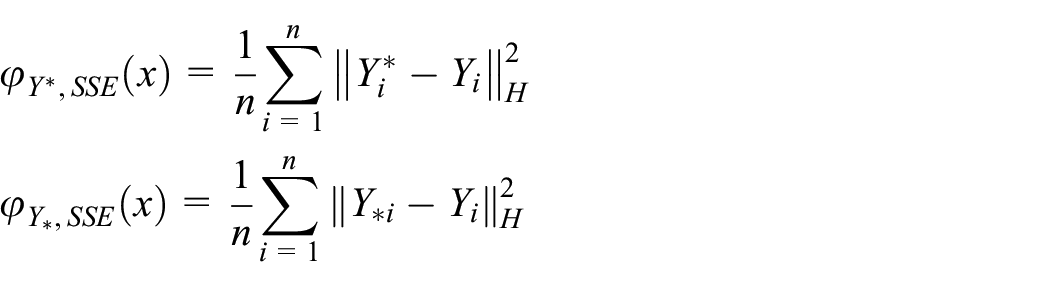
We consider the following criteria for algorithm evaluation. The goodness of fitness

where

where n is the sample size and

The larger is the value of
where

Hao’s dataset with heteroscedastic uncertainty structure
The first dataset is used in the validity of Hao’s two smaller QPP approach, which is a synthetic dataset with heteroscedastic uncertainty structure. Spreads of fuzzy output in this dataset depend strongly on the input values, which are generated by

where the noise
Figure 1 shows the upper model and the lower model that are respectively estimated by Hong’s quadratic loss SVM approach, Hao’s two smaller QPP approach, and the proposed approach. The outer two solid curves represent the estimated values of the upper model, and the inner two dashed curves represent the estimated values of the lower model. As shown in Figure 1, the three approaches can estimate better regression values of interval data, from both outside and inside. But the spread of the upper model of Hong’s is widest and the spread of the lower model is narrowest among three approaches. The regression performance of Hao’s method is better than Hong’s method. It has narrower spread of upper model and wider boundary of the lower model. But

The fuzzy output estimated by (a) Hong’s quadratic loss SVM, (b) Hao’s two smaller QPP approach, and (c) the proposed approach on the Hao’s dataset.
Table 1 reports a comparison of regression performance for Hong’s quadratic loss SVM method, Hao’s two smaller QPP method, and the proposed method. The true risk of the obtained upper model and the lower regression model is evaluated with the true center function without noise. Then,

A comparison of the regression performance of Hong’s approach, Hao’s approach, and the proposed approach on the Hao’s dataset.

Thus, the true sum squared error (TSSE) for the estimated upper regression model and lower regression model is defined as

As shown in Table 1, three methods have good generalization ability when
Hao’s dataset with outliers
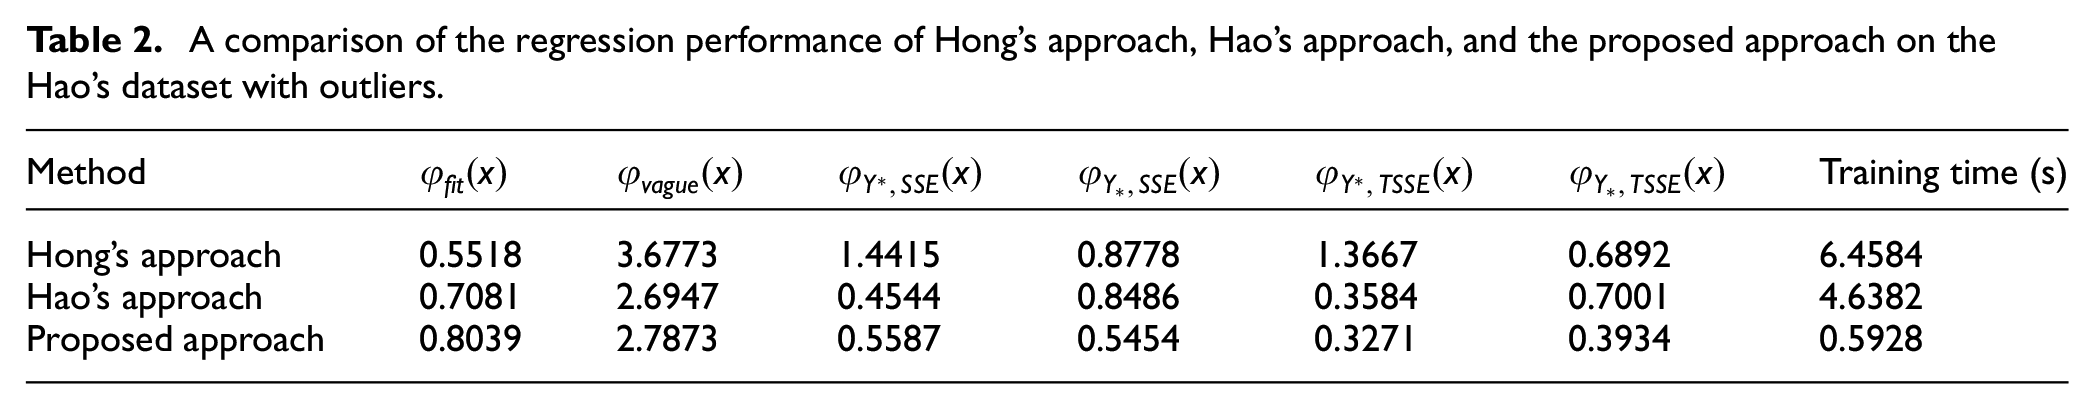
It is known that many regression models for the interval data are strongly influenced by outliers. To verify the regression performance of three approaches on a dataset with outliers, a few data be replaced by outliers in Hao’s dataset to be the second example. As illustrated in Figure 2, Hong’s approach is most affected by outliers among three methods because there is not any slack variable during the modeling process. So each data of training dataset must be located between the upper model and the lower model no matter what it is an outlier or not. Hao’s approach and the proposed approach can reduce the influence of outliers. But the boundary of two approaches tends to outliers, which makes the regression performance decline. As shown in Table 2, each criterion gets worse than those in Table 1.
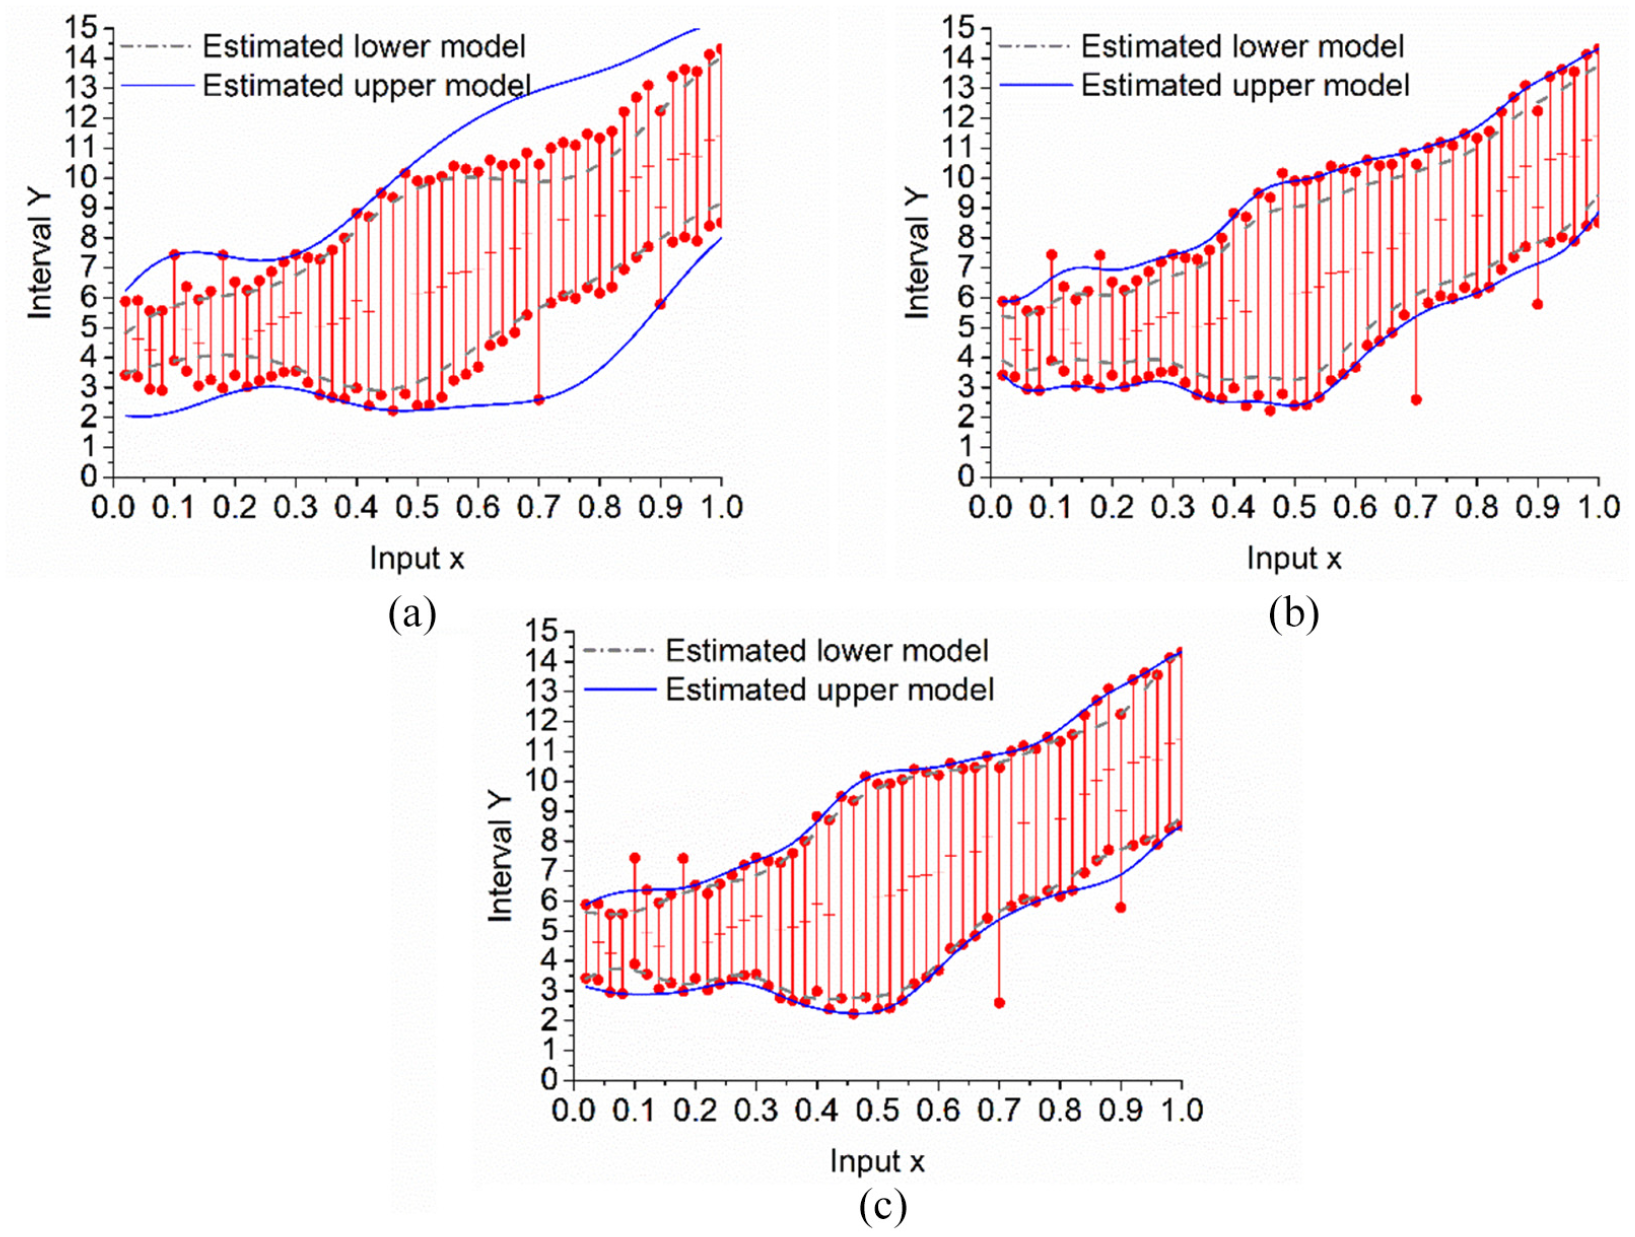
The fuzzy output estimated by (a) Hao’s two smaller QPP approach, (b) Hong's quadratic loss SVM, and (c) the proposed approach on the Hao’s dataset with outliers.
A comparison of the regression performance of Hong’s approach, Hao’s approach, and the proposed approach on the Hao’s dataset with outliers.
Asymmetrical interval dataset
When the center and radius of interval data contain error, the error range of the high value and the low value of interval ends is the same. But the situation is common in practice that the error ranges of the high value and the low value of interval ends are different, which donate as asymmetrical interval dataset. For the third example, the regression performance of three algorithms is verified on the asymmetrical interval dataset which is taken from Xu et al. 47 and is generated by

where
For nonlinear regression problems, all the regression methods based on SVM map input data to high-dimensional feature space, in order to make linear regression in this feature space. Therefore, in essence, all input data will be linear regression in a certain space by the regression approach based on SVM, no matter what they are linear relationship or nonlinear relationship. Thus, to clearly show the regression performance in the asymmetric interval dataset, linear regression was employed by the three approaches. The results of this example are shown in Figure 3.

The fuzzy output estimated by (a) Hong’s quadratic loss SVM, (b) Hao’s two smaller QPP approach, and (c) the proposed approach on the asymmetrical interval dataset.
As shown in Figure 3, Hong’s quadratic loss SVM approach and Hao’s two smaller QPP approach have similar regression outcome. During the regression estimations are calculated, the values of upper model and lower model were obtain by estimated center plus or minus estimated radius in above two regression approaches. That make results of them cannot truly reflect the distribution trend of the asymmetrical training dataset. However, the distance of high value of the proposed approach between the upper model and lower model is smaller than the low value of them. Because the estimated values of the proposed approach are calculated by four independent regression models, which make the scope of application of the proposed approach wider. As shown in Table 3, SSE of the upper model and lower model of the proposed approach is smaller than that of Hong’s approach and Hao’s approach, which makes
A comparison of the regression performance of Hong’s approach, Hao’s approach, and the proposed approach on the asymmetrical interval dataset.

Power load dataset
This article selects the load data of a Chinese power company from 1 January 2014 to 30 December 2016, as the forecast time series and predictions are made in days. The same can be done in units of months. However, the larger the time span, the larger the radius of the interval data obtained by the load forecast, and the greater the volatility brought by it, which will affect the forecast results. The data from the first 2 years are used to build a prediction model, and the data from the last year are used to test the prediction results. As shown in Table 4, the results indicate that the proposed approach obtains better estimated performance than the other approach. As the size of the training data increases, the training time of the model also increases significantly in Hong’s approach and Hao’s approach, and the training time advantage of the proposed algorithm is more obvious.
A comparison of the regression performance of Hong’s approach, Hao’s approach, and the proposed approach on the power load dataset.

Conclusion
This article focuses on dual possibilistic regression models of interval data which is widely used to represent power load. In the spirit of Twin-SVM, ITSVR, and two smaller QPP approach, the regression models are estimated by solving two smaller SVM-type QPPs rather than a single large QPP; therefore, the training speed significantly increases. An efficient interval regression approach by SVM based on solving a group of small QPPs is proposed. This proposed approach employs four small SVM-type QPPs to estimate upper and lower regression models. Each small SVM-type QPP contains fewer optimization variables than Hao’s approach and Hong’s approach, which makes training time of proposed approach less than them. Because slack variables are used in the modeling process of the proposed approach and Hao’s approach, the training data can violate the modeling constraints, so that the two approaches can deal with the dataset including noise and outliers. The proposed approach obtains four nonparallel functions such that one of functions determines one of inside or outside boundaries of of the interval data, and thus the proposed approach can better be regression of the asymmetric interval data. However, the models proposed in this article have more parameters, and the regression effect is seriously affected by the parameter values. So researching intelligent optimization methods to find the optimal parameter value is our next work.
Footnotes
Handling Editor: Xiaojiang Du
Declaration of conflicting interests
The author(s) declared no potential conflicts of interest with respect to the research, authorship, and/or publication of this article.
Funding
The author(s) disclosed receipt of the following financial support for the research, authorship, and/or publication of this article: This research was supported by the Guangdong Province Key Area R&D Program of China under grant no. 2019B010137004; the National Natural Science Foundation of China under grant nos U1636215, 61871140, and 61972 108; and the National Key research and Development Plan under grant no. 2018YFB0803504.