
Abstract
The availability of massive amount of dam safety monitoring data can make it difficult to analyze and characterize dam behavior. This article describes the use of the Cloud model to transform quantitative monitoring data into qualitative information. Each monitoring point returning dam safety data is regarded as a cloud drop, and parameters such as the expectation, entropy, and hyper-entropy of the monitoring data are obtained through a backward cloud generator to represent the operational state of the dam. The monitoring points are then treated as vectors, and the cloud similarity is calculated using the cosine value of the angle between them. The cloud similarity coefficient is then determined to characterize the similarity of dam behavior. Experimental analysis shows that the process of identifying cloud parameters has a good effect on the discovery of abnormal monitoring values regarding dam safety and demonstrates the feasibility of characterizing the dam behavior. Clustering analysis is applied to the similarity coefficients to further achieve the hierarchical management of dam monitoring points.
Introduction
Dam safety monitoring plays an important role in identifying the operating status and ensuring the safe operation of dams. Routine safety monitoring of dams began in the early 20th century when limited monitoring data were obtained because of limitations in the monitoring equipment. The analysis methods and ability for monitoring data to characterize dam behavior were also insufficient, resulting in poor feedback control of dam safety. For example, in 1959, the Malpasset arch dam 1 in France collapsed, despite observation data pointing to abnormal displacement at the bottom of the dam prior to the accident. In 1963, a landslide occurred at the Vajont dam 2 in Italy, where measured values reflected the slope deformation and a piezometric tube showed a cumulative increase and a sharp increase in speed.3,4 If the above monitoring data could have been effectively analyzed and processed, an early warning could have been raised and the disasters may not have happened. Since then, people have recognized the importance of dam safety monitoring and there have been gradual efforts to improve monitoring technology and analysis methods. In recent years, with the rapid development of computer technology and information technology, automatic data collection monitoring and centralized analysis have been applied to dam monitoring.5–7 However, dam break incidents still occur from time to time. In 2018, the auxiliary dam of the Xe pian-Xe namnoy dam 8 in Laos burst. In 2019, a dam break occurred in the State of Minas Gerais, 9 Brazil. The occurrence of these dam break events is caused by the inadequate analysis of the monitoring data.
The automation of dam safety monitoring facilitates the acquisition of rich and comprehensive data pertaining to dam engineering. At the same time, the massive amount of monitoring data places higher requirements on the compilation and processing of this information. For example, the Danjiangkou reservoir dam in the Yangtze river basin in China has more than 2600 types of monitoring equipment and the data sequence has been recorded for 50 years. As a result, there is a significant backlog of processing and analysis of these monitoring data. At present, the analysis of dam safety monitoring data is mainly based on the analysis of a single monitoring point sequence. The data characteristics of single monitoring points exhibit uncertainty and fuzziness. Thus, it is difficult to determine whether abnormal changes in the data at one or several monitoring points reflect the changing trend of the dam’s main behavior. The correlation between the data at each monitoring point, the correlation between the monitoring point and the dam’s overall behavior, and the ability of the monitoring point to represent the dam’s behavior are the main problems currently faced in processing the massive amount of data from dam safety monitoring.
Wu et al. 10 comprehensively analyzed the social and economic benefits, safety, and ecological aspects of dams. This led to the establishment of a fuzzy comprehensive analysis method based on the fusion of interlayer assessments based on evidence theory and fuzzy mathematics, and then the construction of a comprehensive evaluation model of the dam service state. He et al. 11 introduced evidence theory into the multi-effect quantity fusion modeling of high-arch dams and proposed a new fusion coefficient calculation formula suitable for D-S evidence fusion evaluation of high-arch dams. Zhang et al. 12 have established dam safety evaluation methods based on hierarchical analysis and fuzzy mathematics. Lei et al. 13 used a projection pursuit method to construct an early warning index of concrete dam deformation and analyzed the weight of the safety evaluation index. Xu and Bao 14 introduced an interval scoring method, set-valued statistics theory, gray theory, and the Jousselme distance function into dam safety monitoring and established a comprehensive quantitative analysis method for qualitative dam indexes. Ye et al. 15 used a weighted fusion method to optimize evidence theory and applied the resulting approach to dam safety evaluation. Huang et al. 16 applied a back propagation neural network in establishing a nonlinear statistical model between environmental effect and dam deformation. Li et al. 17 used support vector machine and dynamic time-warping to build a dynamic dam monitoring model. Li et al. 18 improved the entropy method by using the Statistical Cloud Model and established a model for calculating the weight of influencing factors of dam break consequences. Zhu et al. 19 based on the Cloud model used the fuzzy comprehensive evaluation method to evaluate the curtain grouting efficiency. The above analysis methods have explored the fusion of different types of monitoring data, but most of them have simply improved the fusion algorithm. This does not solve the problem of differences in the capability of characterizing dam behavior at different monitoring points in large reservoirs and dams and does not aid the analysis and processing of massive amounts of monitoring data.
The Cloud model 20 is a method of dealing with uncertain information based on a fusion of probability theory, mathematical statistics, and fuzzy sets. It offers good performance in dealing with fuzziness and randomness. The Cloud model is gradually gaining recognition in the processing and trend analysis of various monitoring data because of its advantages in representing data relationships. In the field of dam safety monitoring, Wang et al. 21 used cloud model theory to analyze the operational state of a dam for the first time. On this basis, he proposed an improved radial basis function neural network algorithm based on the Cloud model to fit and predict the degree of settlement, thus improving the prediction accuracy. Qin et al. 22 applied the Cloud model to dam safety monitoring. The use of a forward cloud generator and a backward cloud generator enabled the transformation of quantitative data to qualitative information, which could then be used to determine quantitative actions. This transformed certainty allows an assessment of whether the dam monitoring data are within the normal change range. Zhu et al.23,24 used the Cloud model to formulate dam safety monitoring indicators and incorporated wavelet analysis to draw up dam crack safety monitoring indicators. He and colleagues25,26 introduced the Cloud model into dam safety evaluation and improved a cloud merging algorithm to diagnose dam health. Guo et al. 27 developed the Cloud model to assign the basic probability of D-S evidence theory and constructed a comprehensive dam safety evaluation model by combining the Cloud model with evidence theory, which reduces the influence of uncertainty in the evaluation process on the results. Cai et al. 28 used a projection pursuit method to reduce the dimension of dam monitoring data at multiple monitoring points and then used the Cloud model to formulate dam monitoring indicators. In this article, the Cloud model is further used to analyze the dam monitoring data, and a similarity relation between dam monitoring data and the dam’s overall performance is established based on the cloud similarity. Through clustering analysis of the cloud similarity coefficients between monitoring points, it is possible to realize high-efficiency grouping management evaluation of dam monitoring points.
Related work and contributions of this work
Cloud model
The Cloud model 29 is a qualitative concept and quantitative data transformation model based on probability theory and fuzzy mathematics that is mainly used to describe uncertainty. The Cloud model consists of a large number of cloud droplets, and the cloud droplet group reflects the digital characteristics of the cloud.
Definition: Let U be a quantitative universe of discourse represented by numerical values, and C be a qualitative concept on U. If the quantitative value x is a random implementation of the qualitative concept C, the membership degree of x to C is

The distribution of x on U is called the Cloud model, and each x is called a cloud drop. The Cloud model is used to reflect uncertainty and is a two-way cognitive model that can be switched between qualitative concepts and quantitative representations. It has the advantages of simultaneously depicting the randomness and fuzziness of concepts and realizing the qualitative and quantitative conversion of uncertainty.30,31
Backward cloud generator
The backward cloud generator32,33 is used to realize the conversion from quantitative representation to qualitative concept (Figure 1), that is, the numerical characteristics of the Cloud model can be obtained from the quantitative concept of cloud droplets (e.g. quantitative dataset of samples), thus realizing the mapping from quantitative to qualitative. The backward cloud algorithm is based on statistical parameter estimation. In the actual dam monitoring datasets, monitoring data usually do not have uncertainty values, so the backward cloud algorithm without uncertainty is used in this article. This algorithm is used when no cloud droplets are missing, and the calculation achieves a good level of accuracy, even when the number of cloud droplets is small, the error is still very low.

Backward cloud generator.
The drop(x) is the monitoring data, adding one of the monitoring data each time, all values will be recalculated by using the backward cloud generator. The basic algorithm of the backward cloud generator is as follows:
Input: Cloud droplets, that is, dam monitoring data
Algorithm:
Set initial value:
Calculate the sample expectations separately according to
Sample variance:
Entropy:
Hyper-entropy:
Output: The digital characteristics of the cloud model
Ex reflects the distribution of cloud droplets in U which is the central value of the cloud droplets’ spatial distribution in the universe and the point that can best represent the qualitative concept. En measures the uncertainty of qualitative concepts, reflecting the degree of dispersion (randomness) and the similarity (fuzziness) of Cloud models, and describes the acceptability of cloud droplets in U. He is a measure of the uncertainty of entropy, that is, the entropy of entropy, which shows the degree of condensation of cloud droplets and the degree to which the reaction can be accepted. Smaller values of the hyper-entropy indicate a higher degree to which the reaction is accepted.
Cloud similarity
According to the concept of the Cloud model, three cloud parameters can be used to characterize clouds with different properties. The concept of similar clouds 34 is used in research on the similarity between clouds. When there are many clouds with different properties, similar clouds can be used to investigate whether they have any correlation and the degree of correlation. The three cloud parameters (Ex, En, He) can be used to measure the cloud and describe the similarity between different clouds. The following cloud similarity calculation methods are commonly used.
Zhang et al. 34 proposed a cloud similarity calculation method called similar cloud measurement. This method filters the clouds to calculate the similarity of finding cloud droplets within some confidence interval, then sorts the droplets, obtains the average distance between them, and determines the similarity between the two clouds according to some preset threshold. This method can make the reasoning process more adaptable to the needs of uncertain clouds. However, selecting the confidence intervals, and sorting and combining the cloud droplets, is computationally intensive.
A collaborative filtering algorithm 35 based on the Cloud model regards the digital features of different clouds as a parameter vector and uses the cosine of the included angle of the vectors to determine the similarity between two clouds. The similarity calculation formula between the two vectors is

where
This method is mainly applied to recommendation algorithms in e-commerce and has the disadvantage that it is easy to cover up the effect of the entropy and hyper-entropy on the cloud when these attributes are lower than the expectation.
Li et al. 36 proposed the expectation-based Cloud model (ECM) and obtained the similarity between two clouds by calculating the area of the overlap between their expectation curves. ECM calculates the similarity between clouds according to the geometric characteristics of the clouds and ignores the hyper-entropy digital characteristics of the clouds. Therefore, Li further expanded the cloud expectation curve to give the maximum boundary-based Cloud model (MCM) and calculated the area of overlap of the boundary curves from the maximum boundary perspective to obtain the similarity between two clouds. For clouds with large data values, both methods are computationally intensive. Moreover, the calculation results given by MCM will increase as the hyper-entropy increases, thus enhancing the instability of the results. In addition, the hyper-entropy has too much influence on the results.
For a dam in the normal operation state, the monitoring data of the dam fluctuate within some numerical range. As the parameter Ex of the Cloud model reflects the overall behavior of dam deformation or seepage, the value of Ex is not much greater than those of En and He. According to the description of the above methods, the Cloud model parameters of dam monitoring data can be regarded as a vector, and the cosine of the included angle of the vector is used to calculate the similarity of multiple dam monitoring points to characterize the dam behavior.
Cloud similarity calculation for multiple dam monitoring points
The Cloud model is a cognitive approach in which qualitative concepts and quantitative data can be converted into each other. According to the concept of the Cloud model, each monitoring datum can be regarded as a cloud drop, and each cloud drop is a reflection of the qualitative concept on the mathematical model. As the number of cloud drops increases, the cloud parameters gradually stabilize, which is in line with the characteristics of clouds. In addition, dam operation tends to stabilize with time.
Therefore, the Cloud model can be used to characterize the dam monitoring data, and the characteristics of dam monitoring data and dam operation behavior can be analyzed using the parameters of the Cloud model. The main idea is to establish a Cloud model based on dam monitoring data, obtain the changes in the cloud parameters with respect to the dam monitoring value sequence through an iterative calculation, and analyze the relationship between the monitoring data and the change in dam state. At the same time, the correlation between monitoring points can be calculated according to the similarity of the Cloud model parameters from different monitoring points in the same monitoring area of the dam.
The Cloud model parameters are numerical representations of qualitative concepts. From the concept of a cloud, it can be seen that when the dam is in a stable state, the cloud parameters of the dam monitoring data should also be in a relatively stable state. When the dam behavior is abnormal, the cloud parameters will change, indicating the occurrence of abnormal values. We first calculate the cloud parameters with respect to the dam monitoring data and observe the deformation characteristics of the dam through the dam entropy.
For the n dam monitoring points (e.g. displacement, seepage) of the same monitoring type, each monitoring point has m monitoring data to be processed. These can be arranged in order of time and expressed as the following matrix
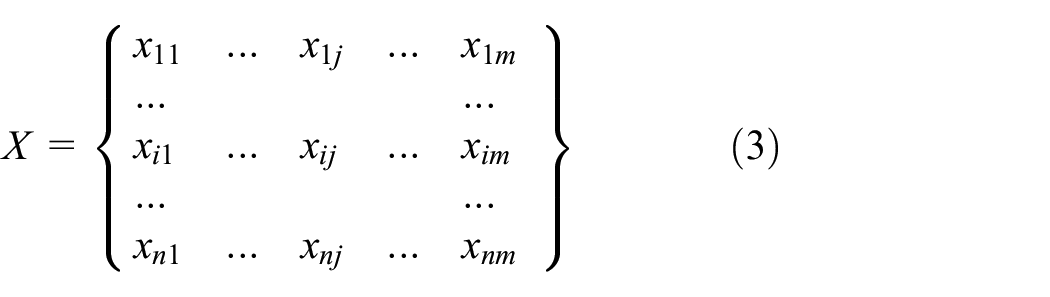
where
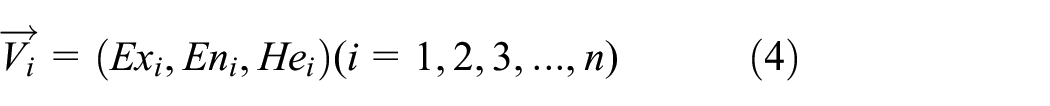
Each monitoring point is regarded as a cloud drop, and a Cloud model of the dam monitoring data is constructed. The Cloud model parameters are set to
According to the Cloud model parameters obtained at different monitoring points, the cloud similarity between monitoring points is calculated by the cosine method of the included angle of vectors. Consider the Cloud model parameters of the dam as a vector
The similarity between the two vectors is
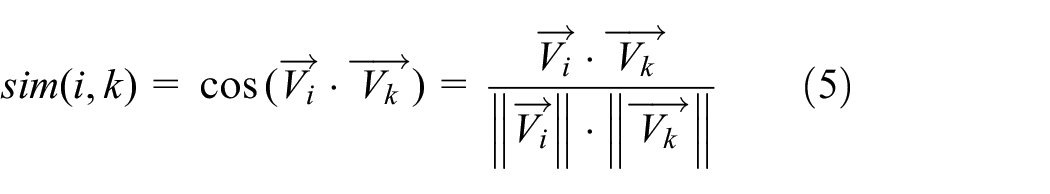
where
To calculate the correlation between monitoring points, the cloud similarity matrix for all monitoring points is constructed as

For each row of the matrix, the numerical values are aggregated to obtain the total similarity of each monitoring point relative to all other monitoring points

In equation (7),
The similarity between different monitoring parts of the dam can be obtained by normalizing the total similarity between the monitoring points. It is assumed that the importance of each monitoring point to characterizing the dam’s behavior is the same. (In this case, the importance of different parts of the dam is characterized by the number of monitoring points. The more important a certain part is, the more similar monitoring points are set in this part, that is, the more data with similar change laws are measured, and the higher the similarity value obtained by the cloud similarity calculation. This article does not consider the case where the weight of the monitoring points needs to be considered.)
The similarity of each monitoring point

The similarity coefficient
Particularly, there are a small number of monitoring points with problems in a dam, and the number of normal monitoring points is larger than that of abnormal monitoring points. Therefore, when there are enough monitoring points to calculate the similarity coefficient, the similarity coefficient of normal monitoring points will be larger, while the similarity coefficient of abnormal monitoring points will be smaller. People need to pay attention to those monitoring points with smaller similarity coefficient, which are likely to be abnormal points.
Instance analysis
Danjiangkou Reservoir dam is located on the Han River and has a total storage capacity of 33.91 billion m3. It is a large-scale water conservancy project. The main water-retaining structure consists of a riverbed concrete gravity dam and earth-rock dams on both banks, with a total length of 3442 m. The concrete dam measures 1141 m in length and is divided into 58 dam sections with a crest elevation of 176.60 m (Yellow Sea elevation system) and a maximum dam height of 117.00 m (Figure 2).

Danjiangkou reservoir.
To monitor the sedimentation of the concrete dam, leveling points are located upstream and downstream of section 6 and 43, and a total of 100 precise monitoring sensors are located along the dam crest. Six monitoring points are placed upstream and downstream of dam crest sections 21, 22, and 23, and the relationship between the vertical displacement monitoring data and the dam operation patterns is analyzed using the method described in this article. The measured values are shown in Figure 3. The monitoring time sequence runs from July 2013 to December 2017.

Vertical displacement of typical dam section top monitoring points.
Single point analysis
According to the concept of the backward Cloud model, the vertical displacement monitoring data from LD58HC221 on the dam crest (monitoring point downstream of dam section 22) are taken as cloud droplets, and the cloud attribute value of the monitoring point is calculated according to the backward cloud generator described in section ‘Backward cloud generator’. The variations in the Cloud model parameters at this monitoring point are shown in Figure 4(a).

Cloud parameter variation from monitoring point LD58HC221.
Due to the annual periodic change of reservoir water level, the dynamic evolution laws of cloud parameters at the analyzed initial stage, maybe before December 2014, are seriously influenced by the total number of used monitoring data. Thus, Figure 4(b) is added to analyze the later stable stage. By comparison, it was found that the previous data did not have a great impact on the subsequent analysis. From Figure 4(a) and (b), it can be seen that the cloud parameter values at this monitoring point show a stable trend over time, indicating that the vertical displacement of this part of the dam is gradually tending toward a stable state. From September 2017 onwards, the vertical displacement measured at this monitoring point fluctuates. The cloud parameter values exhibit the following changes: the measured value expectation Ex first decreases and then increases; the value of En, which is the dispersion degree of the reaction value near the mean value, and the hyper-entropy He exhibit a decreasing trend, and He changes obviously. By analyzing environmental data, it is found that the upstream water level of the reservoir is affected by autumn floods and has been rising since September 2017. The changes in vertical displacement monitoring data are consistent with these changes in water level, which verifies the effectiveness of the Cloud model in characterizing variations in dam behavior.
Analysis of multiple monitoring points
Table 1 shows the Cloud model parameters calculated by the backward cloud model algorithm.
Parameters of Cloud model at each monitoring point.

The changes in the cloud parameter He for the six monitoring points in Table 1 are shown in Figure 5.

Variation of hyper-entropy He of the monitoring points.
As can be seen from Figure 5, the value of He at monitoring point LD58HC221 has obvious abrupt changes compared with the situation in Figure 3. These changes are completely consistent with the actual situation. Therefore, it is believed that, for the analysis of data from each monitoring point, abnormal monitoring values can be quickly identified by analyzing variations in the cloud parameters. In particular, the hyper-entropy is particularly sensitive to abnormal values.
According to equations (4) and (5), the cloud parameters of each monitoring point are regarded as vectors, and the similarity matrix reflecting the similarity between each monitoring point is obtained using equation (9).
From the similarity matrix, it can be seen that the similarity between monitoring points LD55HC211, LD57HC221, and LD59HC231 is relatively close to 1. The similarity between monitoring points of LD56HC211, LD58HC221, and LD60HC231 is relatively close to 0.98. Compared with the vertical displacement process line of the monitoring point in Figure 3, it can be seen that LD55HC211, LD57HC221, and LD59HC231 have similar variation rules, and LD56HC211, LD58HC221, and LD60HC231 have similar variation rules, which are consistent with the relationships among these monitoring points reflected by the similarity matrix. LD55HC211, LD57HC221, and LD59HC231 are the upstream vertical displacement monitoring points of dam sections 21, 22, and 23, respectively. LD56HC211, LD58HC221, and LD60HC231 are the downstream vertical displacement monitoring points of these three dam sections. The variation laws of upstream and downstream monitoring points in adjacent dam sections are consistent with the actual situation. The measured value at monitoring point LD58HC221 fluctuates significantly after September 2017, but this behavior is not observed in other monitoring points. Thus, the similarity between LD58HC221 and other monitoring points is relatively small. The similarity can be used to effectively characterize the similarity relationship between various monitoring points

The total similarity between a particular monitoring point and the other monitoring points is given by equation (7). Assuming that all monitoring points have the same ability to characterize the dam, the similarity coefficient of each monitoring point is obtained by equation (8), and the specific values are presented in Table 2.
Similarity degree and similarity coefficient of each monitoring point.

From the calculation results, it can be seen that the similarity coefficients of dam behavior have the following relationship:
This shows that LD55HC221 gives the strongest representation of dam behavior changes, with the other monitoring points ordered accordingly. Further clustering division 37 is carried out based on the cloud similarity coefficient, and two initial values of 1 and 0.98 (maximum and minimum similarity coefficients) are set by the K-means algorithm. The two classes with the closest similarity coefficient distance are then obtained: LD55HC211, LD57HC221, LD59HC231 in one class and LD56HC211, LD58HC221, LD60HC231 in another class. Monitoring points that reflect similar changes are analyzed together which greatly simplifies the analysis process and workload. In practical applications, the value of K will be situation-specific, and the monitoring points will be classified and divided according to the engineering practice. The division used in this article provides a simple description of classification and division.
Conclusion
As the Cloud model can express uncertain concepts and explain the correlation between randomness and fuzziness through classical probability theory and fuzzy mathematics, it achieves a good effect when processing big data. To overcome the uncertainties of analyzing monitoring data from numerous monitoring points running over long periods of time, this article has introduced the Cloud model for dam monitoring data analysis. The proposed model takes each monitoring point as a cloud droplet and the monitoring values of each point as a cloud.
As the Cloud model has the two-way cognitive characteristics of qualitative and quantitative transformation, the cloud parameters can be calculated using the backward cloud generator. This converts a given data sample into the cloudy qualitative concepts, thus realizing the transformation from quantitative data to qualitative parameters.
Specifically, each dam monitoring point is regarded as a cloud, and the measured values are regarded as cloud droplets. The Cloud model parameters of the data series are calculated through the backward cloud algorithm. The variations in cloud parameters reflect the changes of the monitoring points and the operation conditions of the dam allowing abnormal values to be quickly identified from the measured values. After calculating the cloud parameters of multiple monitoring points, the cosine similarity method can be used to calculate the cloud similarity between different monitoring points of the dam. The feasibility of the cloud similarity coefficient to represent the similarity between different monitoring points has been verified.
The cloud similarity is aggregated and normalized to obtain cloud similarity coefficients for the different monitoring points. The monitoring points can then be grouped according to the clustering characteristics of the similarity coefficients, thus achieving hierarchical management analysis of the monitoring points. Only the points with smaller similarity coefficient need to be paid attention to, which is a good innovation and significantly reduces the workload of dam monitoring data analysis.
Footnotes
Acknowledgements
The research described in this paper was performed partly in Wuhan University and partly in Nanjing Hydraulic Research Institute. The authors would like to acknowledge Jinbao Sheng, Jinping He, and Fuheng Ma for detailed technical discussions that helped to significantly improve the quality of this paper. The paper could not have been completed without their help. The most important of all the authors would like to thank the Editor and the anonymous reviewers for their significant suggestion and help in improving the quality of this paper.
Handling Editor: Zheng Chang
Author note
Hanman Li is now affiliated to Department of Dam Safety and Management, Nanjing Hydraulic Research Institute, Nanjing, P.R. China.
Declaration of conflicting interests
The author(s) declared no potential conflicts of interest with respect to the research, authorship, and/or publication of this article.
Funding
The author(s) disclosed receipt of the following financial support for the research, authorship, and/or publication of this article: This research was financially supported by National Key Research & Development Program of China (2018YFC0407105), the National Natural Science Foundation of China (Grant Nos 51779155, 51779154, and 51779151), the Fundamental Research Funds of Nanjing Hydraulic Research Institute (Grant Nos Y718002 and Y720002), and the Water conservancy science and technology research projects of Hennan province (GG201657).