
Abstract
With the wide application of Internet of things technology and era of large data in agriculture, smart agricultural design based on Internet of things technology can efficiently realize the function of real-time data communication and information processing and improve the development of smart agriculture. In the process of analyzing and processing a large amount of planting and environmental data, how to extract effective information from these massive agricultural data, that is, how to analyze and mine the needs of these large amounts of data, is a pressing problem to be solved. According to the needs of agricultural owners, this article studies and optimizes the data storage, data processing, and data mining of large data generated in the agricultural production process, and it uses the k-means algorithm based on the maximum distance to study the data mining. The crop growth curve is simulated and compared with improved K-means algorithm and the original k-means algorithm in the experimental analysis. The experimental results show that the improved K-means clustering method has an average reduction of 0.23 s in total time and an average increase of 7.67% in the F metric value. The algorithm in this article can realize the functions of real-time data communication and information processing more efficiently, and has a significant role in promoting agricultural informatization and improving the level of agricultural modernization.
Introduction
As a result of the information revolution in recent years, the “big data” field has become a brand new frontier of innovation and opportunities from all walks of life. More and more organizations regard large data as the core component of information management and analysis infrastructure with the development of large data technology. By increasing the amount of data created through a variety of data, industry and scholars have become more concerned about the use and analysis of large data. 1
Agricultural informatization is an important part of modern agricultural construction. The combination of big data analysis and climate change science can greatly accelerate the innovation of climate-smart agriculture and agricultural research. Intelligent agriculture is a development that emphasizes the use of information and communication technologies in the management cycle of network physical farms. New technologies such as the Internet of things (IOT) and cloud computing are expected to take advantage of this development and introduce more robots and artificial intelligence into agriculture. 2 M Chunqiao et al. 3 analyzed the research status of agricultural large data cleaning technology, scale conversion technology, fusion technology, correlation analysis and prediction technology, visualization technology, and specific application. It is of large significance to promote the cross-growth of big data technology and agricultural information science and the establishment of agricultural large database analysis technology system. H Zhang et al. 4 briefly expounded the related concepts of agricultural big data, and emphatically introduced the challenges and countermeasures facing the current agricultural big data. A Kamilaris et al. 5 believes that the physical environment can be continuously monitored through modern digital technology, and the analysis of big data will enable farmers and companies to obtain value from it and improve their productivity. But it has not been widely used in agriculture. P Guo et al. 6 elaborates the demand for large data self-organizing area push, and elaborates several key technologies, including user modeling, recommendation modeling, and recommendation algorithm. The key points, difficulties, and hot issues of future recommendation system are discussed. A review of the current application of large data in the field of agricultural food reveals the availability and limitations of some collection and analysis tools for mapping large data applicable to food and agriculture, and should be a broad research objective for large data scholarships. D Waga and K Rabah 7 uses large data solutions to make real-time business decisions, and uses cloud computing to resiliently process such large-scale data and extract environmental data such as value, rainfall, wind, temperature, and so on from it, and uses specific cloud computing analysis tools to obtain meaningful information for farmers to use for strategy and successful agriculture. M Carolan 8 found that they use big data when making farm management decisions through 18 interviews with Iowa farmers. These entrepreneurs want to create and encourage the adoption of technology platforms to enhance the capacity of regional food systems.
The rise of IOT for the agricultural field has led to an alarming growth in the types and quantities of agricultural data. Big data technologies and cloud computing can be applied to solve storage and analysis troubles of agriculture. The use of the IOT for the agricultural field makes the application of agriculture in the field of large data more and more in-depth, large data analysis also provides technical support for agricultural informatization. 9 Current farming methods, through the integration of sensors and the IOT, enable farmers to understand crop growth and harvest regularly, thereby increasing crop yields and ensuring the correct delivery of products to end-users in the right place, thereby continuing to perceive and monitor the right time for crops. 10 The IOT technology, combined with agricultural applications, is an important driving force for upgrading traditional agriculture to modern agriculture. 11 Sensors are involved in almost every area of life, including agriculture, and sensors and their networks have been successfully used to obtain many benefits. 12 Big data is considered as an important technological change in the field of modern information technology in the IOT and cloud computing, and has become the leading-edge technology of smart applications and data mining. ZF Sun et al. 13 introduced the background of large data and the relationship between the IOT, the basic connotation and key technologies, and analyzed the needs of large data in the main application areas, and put forward some suggestions and ideas for the future development of big data and smart agriculture in China. The potential of big data in agriculture is attracting increasing interest from food and agricultural business participants, researchers, and decision makers. Big data–based solutions may increase agricultural productivity and supply chain efficiency and help solve the challenge of doubling food supplies by 2050. 14 Taking the realization of a sustainable world as the starting point, CS Nandyala and HK Kim 15 explores various technologies and issues of green cloud computing and green IOT, further improving the combination of two technologies (cloud computing and IoT) in agricultural and medical systems to reduce energy consumption. J Lee et al. 16 believes that the IOT provides a platform for automatic control of temperature, humidity, and sunshine systems to adapt to the best growing conditions in greenhouses and plant factories. It can even control and monitor crop growth and disease through smart phone applications or PC. It can improve the quality of agriculture and agricultural products. It is suggested to build an IOT platform through open API in agricultural industry. PP Ray 17 comprehensively analyzed the equipment and wireless communication technology related to the IOT in agricultural and agricultural applications. The sensor IOT system that provides intelligent services for smart agriculture is investigated. They proposed many cases to explore existing IOT-based solutions implemented by individuals, organizations, and categories based on their deployment parameters.
N Gondchawar and RS Kawitkar 18 believes that the only way to solve the problem of agriculture is to modernize existing traditional agricultural methods and use automation and IOT technology to make agriculture intelligent. The technology based on cloud computing, visualization, and service-oriented architecture (SOA) are used to build large amounts of data related to agricultural production, which helped establish factories and achieve automatic control of agricultural production. Rather than traditional agricultural methods, TK Fan 19 proposed a new IOT technology with cloud computing and Li-Fi to solve India’s agricultural problems by adding new IOT technologies. Most of the prior art used to evaluate the comfort of dew point humidity data provides a wrong decision for time and energy consumption. MS Mekala and P Viswanathan 20 proposed a cloud and mist measurement (CMM) index based on temperature and relative humidity to evaluate crop comfort. The CMM index experiment shows that the decision is accurate and detailed reports are sent to farmers by using real-time data. The perfect combination of IOT, big data, and cloud computing can promote the rapid growth of agricultural modernization and intelligent agriculture, and solve the troubles of agriculture and farmers effectively. 21 JE Bagley et al. 22 used a combination of agroeco system models and observational data to assess a series of climate-smart agricultural scenarios to determine the biophysical impact of these technologies in the Midwest of the United States. S Ravi et al. 23 believes that the use of wireless sensor technology enhances technology to improve sustainable agriculture, and establishes a connection between the sensor’s sensed value and the Internet through the IOT. The temperature, humidity, and pH sensors are used to obtain the characteristic data of the land, and forecast the climate based on temperature and humidity using fuzzy rules.
This article makes full use of multiple sensors to achieve real-time collection and monitoring of data in the production of agricultural greenhouses based on the research of the agricultural IOT architecture, and designs data analysis and data mining in the production and management of modern agricultural greenhouses based on big data, which are used to achieve the control of agricultural data effectively.
Proposed method
Agricultural IOT system
The IOT technology based on the Internet and mobile communication network can meet the needs of many different fields with the development of science and technology. But because agriculture is influenced by many objective factors, the development of IOT technology in agriculture is slow.
Agricultural field is one of the most urgent and important development areas of the IOT technology. A large amount of sensor nodes will form a variety of monitoring networks in the agricultural field through the IOT technology, and with the help of various sensors to collect information, it helps farmers to find the troubles in time and determine the location of the troubles accurately. IOT for agriculture is an application system of IOT which runs through the production, processing, and circulation of agriculture. Agriculture has gradually shifted from a human-centered model through the IOT technology, isolated machinery-dependent production model to an information- and software-centered production model, thus using a large number of automated, smart, remote-controlled production equipment. Operators, growers, or managers can adjust their planting plans according to various data of the agricultural IOT system to maximize the profits of agricultural production. IOT technology for agriculture is implemented in a hierarchical structure at the business level. It consists of five layers from low to high.
Sensor layer: It can be used to collect basic information of growth environment, logistics, and storage, such as monitoring information, trading information, storage information, and weather information. It mainly includes all kinds of sensors, relay control unit, RFID (radio frequency identification) equipment, rapid testing equipment, video cameras, and so on.
Transport layer: It includes the two parts of wireless communication and wired communication. The backbone network is mainly wired communication, that is, through the Ethernet ring network to ensure the reliability of network transmission, data reliability, convenient and fast transmission and exchange. This layer communication technology includes Zig Bee, RF433, and RS232.
Business layer: It is used to monitor environmental factors or growth factors and various types of information in quality traceability systems. It includes environmental data basic information, business management information, geographic information, and so on. Extend and upgrade the application of IOT based on growth factor and quality traceability system database, and provide basic services such as business intelligence (BI), data warehouse, middleware, collaborative technology, workflow, and so on.
Application layer: It is divided into several application portals according to the roles, including supervisors, producers, suppliers, channel providers, consumers, and so on.
User layer: It includes all kinds of information security methods, data storage, access, and transmission security system, mainly through the security system and technology to ensure the safe access to information and malicious attack environment data security and data integrity. There are many terminal modes in this layer, and the main key technologies are information security technology in the environment of network convergence and system heterogeneity, and system security technology. The main structure is shown in Figure 1.
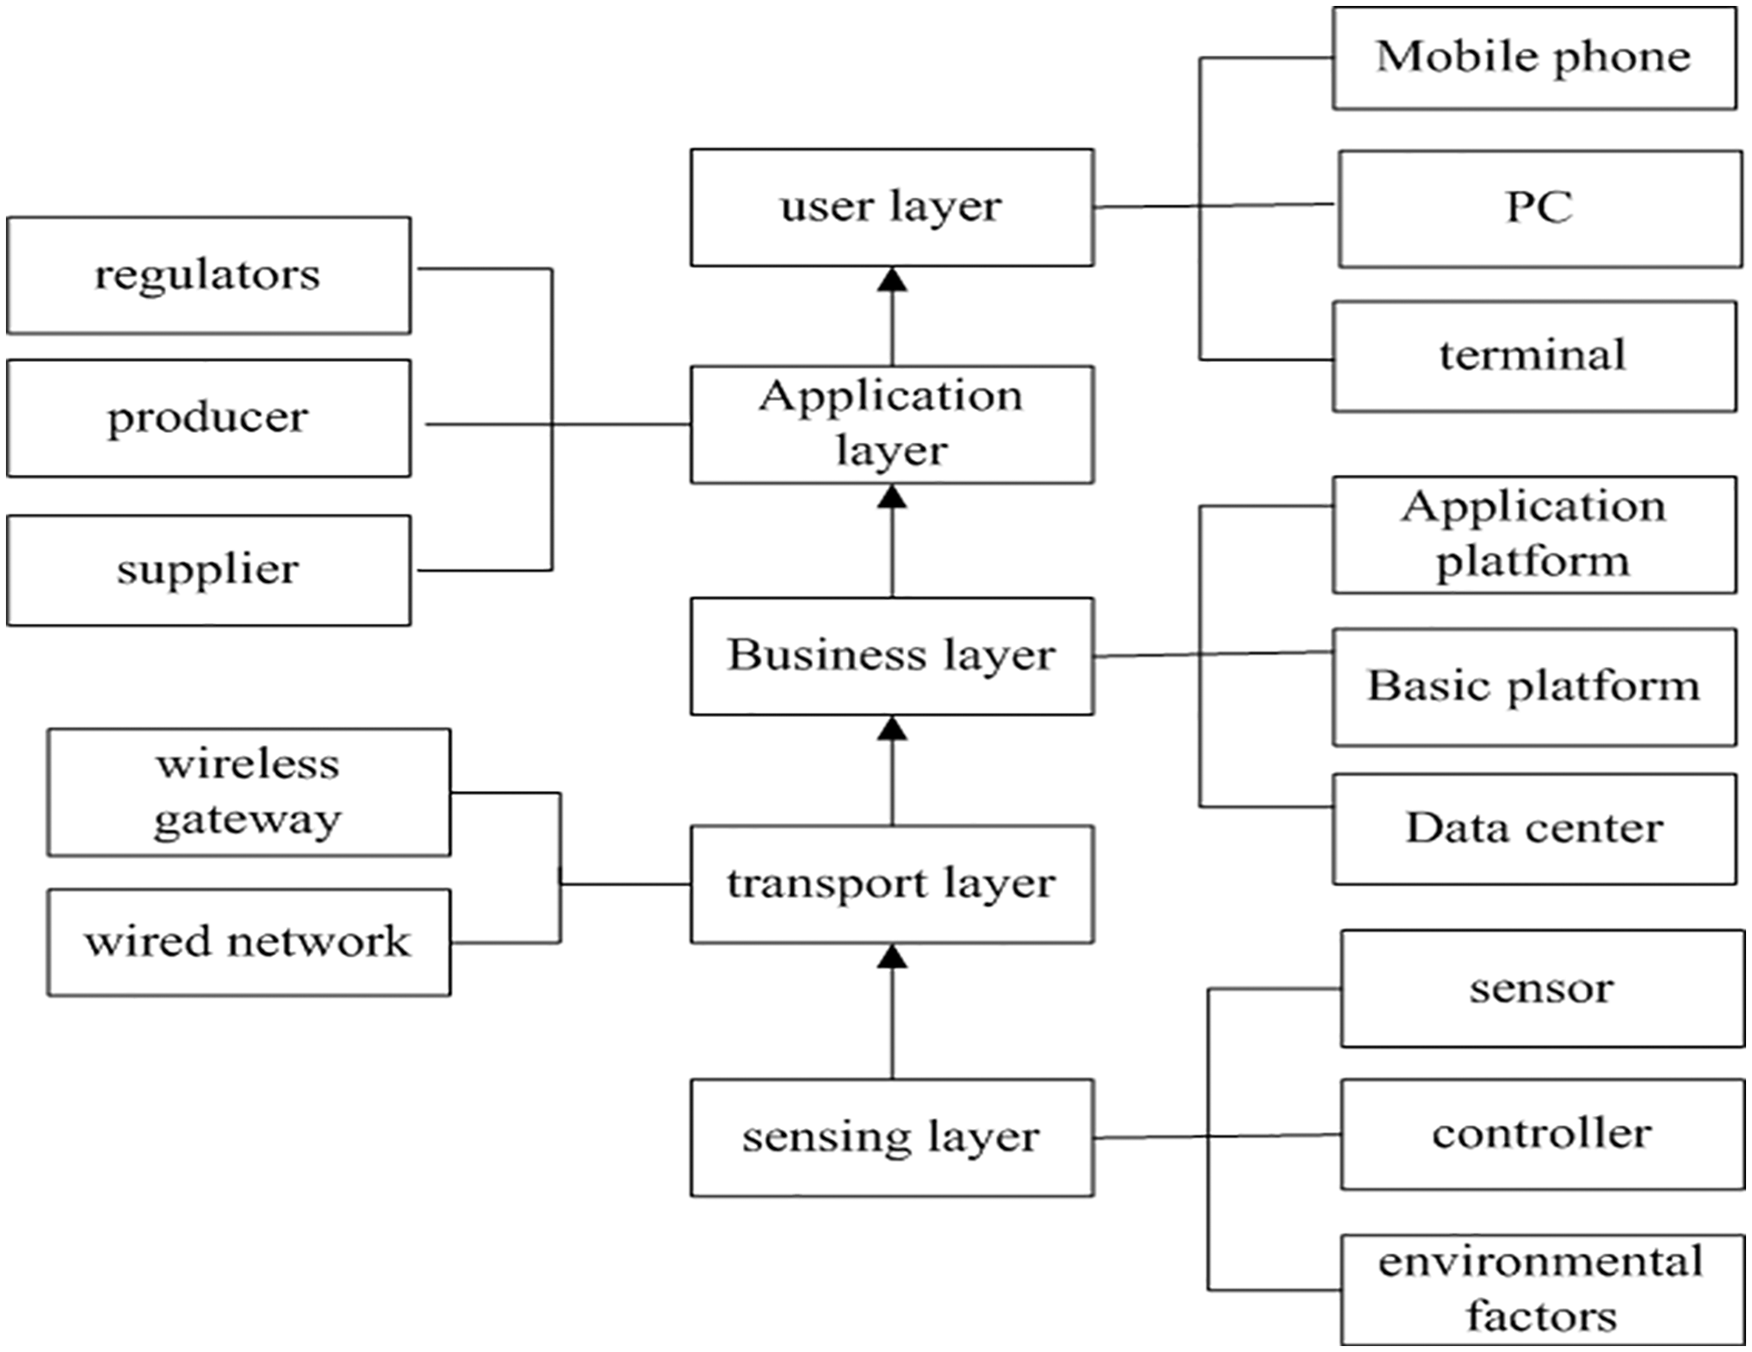
Agricultural-based IoT structure.
Big data concepts and big data systems
The concept of big data, especially with the IOT, cloud computing, and other new technologies continue to emerge with the explosion of information in recent years, which make people have a deeper knowledge of big data. First, big data refers to a large scale of data sets, big data is not only large but other indicators followed. Some basic elements of large data are (a) having a certain level of data volume; (b) having a certain degree of complexity in data composition; (c) hiding in the data set has certain value, which is worth further analysis and mining; (d) need to be able to mine the value of the data set within a certain time range, and cannot be unlimited increase.
Data mining
With the advent of the big data era, the operation of data is not limited to collection and storage. Data mining, as a digger of data value, application value, and technical value, is widely used in industry, manufacturing, enterprises, and research and development. It is the core technology of the big data era. Data mining is a phased data processing process. The purpose of data mining is to recover the implicit knowledge and value information from a large number of fuzzy and noisy data, which is the discovering knowledge process from big data. It is influenced by machine learning, artificial intelligence, statistics and database technology, and other disciplines. It is used for classification, prediction, correlation analysis, time series prediction, and so on. The general data mining step is to determine the goal of data mining, collecting data, extracting target data, data preprocessing, constructing mining model, model evaluation, knowledge representation, and other processes as shown in Figure 2.
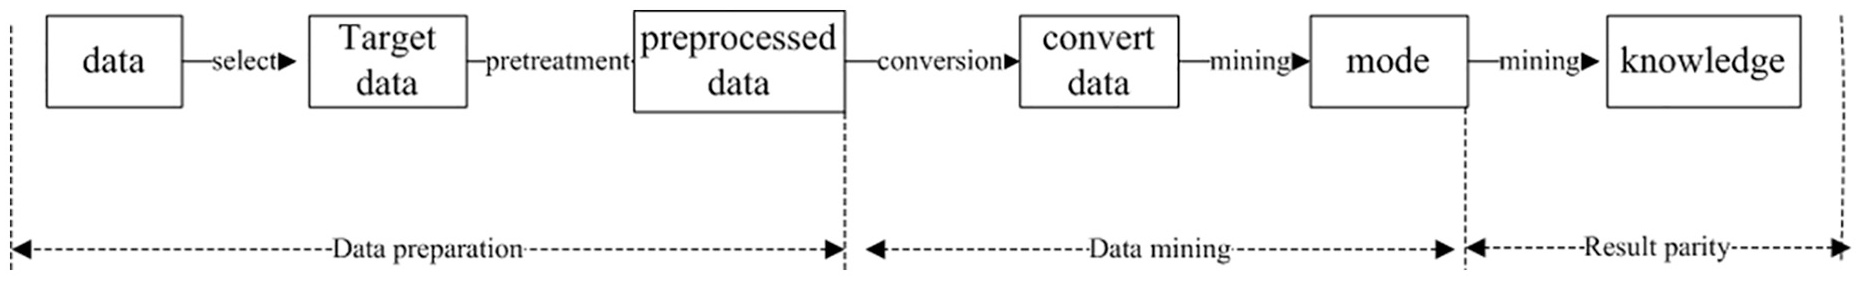
Data mining process diagram.
1. Establish project objectives.
First of all, the goal of mining project must be determined in the data mining process. In order to formulate the strategic goal more pertinently, the goal setting must include the value of the completed project.
2. Data collection.
The premise of data mining is that there must be a large amount of data. Data collection is to collect and measure the pertinent variable information in a given systematic way. Data collection can be collected through network crawling, business survey, or data in existing data systems. The type of data can be structured, semi-structured, or unstructured data. The goal of all data collection is to provide high-quality sample data sets.
3. Data preprocessing in advance.
This process is to “format” the collected data for subsequent model training and statistics. The collected data do not go through the steps of data preprocessing and so on, and may produce erroneous results in the process of mining. If there is a large amount of irrelevant, redundant information or noise and unreliable data, the training process will become more complex, increasing the time of data mining. In the entire data mining process, data preprocessing should account for more than 80% of the total workload. There are many methods of data pre-processing, mainly according to the data format and data content for pre-processing, pre-processing steps are generally data cleaning, multi-source integration and integration, data transformation, data specification, and so on (Figure 3).

Preprocessing flow.
4. Data mining.
Data mining is a process of transforming raw data into useful information. Through some algorithm model or analysis method, find patterns in a large amount of data, this process is generally known as knowledge discovery. We should select a variety of algorithm models for training and learning in the data mining process, and choose the most appropriate mining algorithm finally through the analysis and comparison of results. In order to get a better mining effect, first of all, we need to fully understand the data structure, data types, data attributes, and other data; second, we need to understand the commonly used data mining methods, classification, prediction, or clustering; finally, we need to understand the mining model algorithm process, parameter adjustment rules, model variation curve lines, and so on.
5. Model evaluation.
Model evaluation is a process of comprehensive evaluation of data mining results. The main content of this work is to judge the mining results of data mining model, algorithm execution time, algorithm stability, and a series of results. If the result of data mining is very different from the user’s goal, it is necessary to analyze the cause of the error. If it is the reason for the data, it will return to the data processing step, increase the data set or re-pre-process the data; if it is the problem of the algorithm model, it is necessary to re-adjust the model parameters, select the best fitting curve, until the model meets the needs of users.
6. Knowledge representation.
The final result of user data mining is presented in an easy-to-understand form, that is, the learning rule form is transformed into human-understandable knowledge. Users can construct expert knowledge base according to model rules. When they encounter similar data cases, they can directly call knowledge to predict the results, thus improving the mining efficiency.
At present, data mining is the most widely used and effective technology in the agricultural information data process. It is of great significance to increase crop yield and improve crop quality by using data mining technology to mine agricultural information data so as to provide timely agricultural planting data for users.
Data mining algorithm
Data mining algorithms are mainly as follows: association rules analysis algorithm; clustering analysis (represented by K-means algorithm and nearest neighbor algorithm); prediction and regression algorithm; and citation sorting algorithm. As an important component of data mining, the main function of clustering analysis is to make several similar objects into groups or clusters according to the attribute values of describing objects, so that highly similar objects can be placed in the same clusters and objects of different clusters can be distinguished as far as possible. As a statistical analysis method, cluster analysis is a typical data reduction method.
K-means algorithm
As an efficient and simple clustering algorithm, K-means algorithm has been widely applied. The basic idea is to select the initial clustering center randomly, then calculate the Euclidean distance from each point of sample to it, and assign them to the classes represented by the clustering center with the largest similarity according to the nearest criterion. The clustering center is updated until the objective criterion function converges while the mean value of all sample points in each category is calculated. The specific process is as follows:
Input data: the number K of clusters and the database including objects N.
Output data: K clusters making the MSE stack the smallest.
The user inputs the value k of the number of clusters and selects k points randomly from n sample points as the primary clustering center.
Traversing all the sample points and calculating the space from each clustering center to other data objects according to the principle of nearest distance. Assign them to each corresponding class.
Re-determine the clustering center and compute the average value of all objects for each class as a new clustering center.
Repeat step (2) and (3), until the target criterion function is convergent, and the clustering center will change no longer. Variables in the typical K-means algorithm, are defined as follows:
The following constraints must be met

K-means’s evaluation function for customers’ clustering quality is shown in equation (2)

where nj denotes the total number of behavior data contained in the customer type cj, zj denotes the clustering center of the customer type cj, and is the mean value of the customer behavior value contained in the customer type, as shown in equation (3)

K-means algorithm based on maximum distance
Selecting the initial clustering center randomly is easy to obtain the local optimum in typical K-means algorithm, but difficult to get the global optimum solution; different initial clustering centers are easy to get different clustering results at the same time, which makes the clustering algorithm very unstable. Selecting the initial cluster center randomly can raise the total amount of iterations easily, thus increasing the cost of clustering in all.
Sample points with small similarity (large distance) are less to be divided into the similar cluster, while those with large similarity are more likely to be divided into the same cluster. Therefore, this article computes the space between N points in the sample set by the improved algorithm, which is as follows:
The two sample points with the farthest distance are taken as the initial cluster centers.
The sample point in the remaining (N – 2) sample points which maximizes the space product of each of the first two initial clustering centers is selected as the third initial clustering center.
Select the sample point in the remaining (N – 3) sample points, the product of the distance is the maximum value to the three initial cluster centers ahead as the fourth initial cluster center.
The center which maximizes the space product of each of the first three initial cluster centers is selected as the fourth initial cluster center.
K initial cluster centers can be found by analogy.
The design principles of smart agriculture system based on the IOT
IOT technology is the inheritance and development of modern Internet technology, and it is also a significant component of the latest generation of information technique. The smart agriculture system based on the Internet of thing is the combination of IOT and agricultural technology, which should also include different stages of agricultural data acquisition, pretreatment, processing, and analysis. The relevant configuration of different stages is as follows:
Data acquisition: mainly the application of various instruments and equipment, such as sensors, portable terminals, unmanned aerial vehicles, scanners, and so on; more and more data sensing equipment for the agricultural field, the use of a variety of sensors and other sensing equipment, acquisition of crop fields, horticultural parks, aquaculture, poultry breeding, and other agroforestry fields related ring information in all areas of animal husbandry.
In the data preprocessing advance stage, most of the problems can be solved by setting standards or designing algorithms for data standardization and data denoising, and the agricultural data preprocessing process is also composed of the following stages. Data cleaning, data normalization and consistency processing, data transformation, and data evaluation.
In the data processing stage, the agricultural IOT data online, real-time processing for the agricultural field. Through humidity sensors, temperature sensors, and other sensors, the detailed data of crop humidity, temperature, light, carbon dioxide are collected, and these large data are stored and transmitted through gateway and transmission equipment. Smart agriculture based on the IOT can monitor the growth of crops efficiently and conveniently, and reasonable intervention in the growth of crops.
Data analysis stage: the server receives massive information and carries on the computation analysis conformity, finally displays the data in the visual form.
Related to applications or needs closely, different analytical results can be obtained by designing different models. Some emerging data analysis technologies will also emerge, and will occupy an important position in the field of agricultural large data. In the design of smart agriculture IOT system, we need to consider the following factors:
1. Low cost. Smart agricultural system based on IOT needs a huge amount of sensors to collect data, and often need to cover a large area. It is necessary to reduce the cost of sensor fabrication; the cost of sensor networking must be considered to bring its role to full play under the premise of low cost.
2. Cross platform and standardization. Smart agricultural system based on IOT is a relatively large system, the whole system will involve cross-platform issues, and must be able to run across platforms. Because the system is an entirety, all the information exchange within the system must be standardized, which is the premise of realizing the function of the IOT.
3. Self-organization and expansibility. The user group of smart agricultural IOT is unlikely to be a professional group, so it is necessary for the system to work together under the condition of self-organization. The system also needs to be extensible in addition. The system can add reasonable functions by software upgrading without major changes.
In addition, the system also needs to be scalable, the system can be upgraded through software to add reasonable functions without major changes.
4. Entertainment entry applications. With embedded technology, we can reduce the dependence of the system on computers. The overall architecture of the system will be designed based on the IOT architecture model.
This article mainly deals with data processing, data analysis, and data mining through a large number of various data collected by sensors in smart agricultural systems.
Experiment simulation
The selected data are generated according to the data demand of the growers in this article. The main requirements are as follows: determine the relative optimal growth environment curve of seedlings in each fixed cycle by collecting a large number of environmental data, including soil temperature, air temperature, air humidity, soil moisture. It provides data reference for the automatic control system of plantations planned in the future. The soil, air, temperature, and other related data are measured by the sensors in very few minutes, which will generate a large amount of data within 1 h. A relatively optimal data needs to be selected as the reference data in the next cycle. This article mainly clusters the data of temperature and soil sensors in the data mining module every X hours to obtain a relatively optimal environment curve. Therefore, the k-means algorithm based on the maximum distance for data mining is chosen in this article. The maximum distance k-means algorithm is an improvement of K-means algorithm. The number of iterations is reduced and the clustering efficiency is improved by optimizing the initial cluster center selection. The specific process is as follows:
Select a point as the first clustering center randomly.
Update the minimum distance from all points which are not the cluster centers to clustering centers.
Skip to the next step if the number of clustering center points is less than k, otherwise the selection ends here.
Find the maximum value in the minimum distance array out to mark the data points corresponding to the value as the cluster center, update the minimum distance from all non-cluster center points to the cluster center set, and skip to the previous step.
The efficiency of K-means algorithm and the maximum distance k-means algorithm are compared by using MATLAB in this article, Generate 10 data as 1 to 9 randomly, as shown in Table 1.
The 10 data generated randomly.

Clustering the data by K-means algorithm, and two numbers (the fourth and the eighth) are selected to generate clustering centers for iteration, as shown in Table 2.
The process of K-means iteration.

The K-means algorithm based on the maximum distance is used for clustering second. The clustering center selects the fourth and the first numbers of two numbers, and then iterates, as shown in Table 3.
The iterative process of K-means algorithm based on maximum distance.
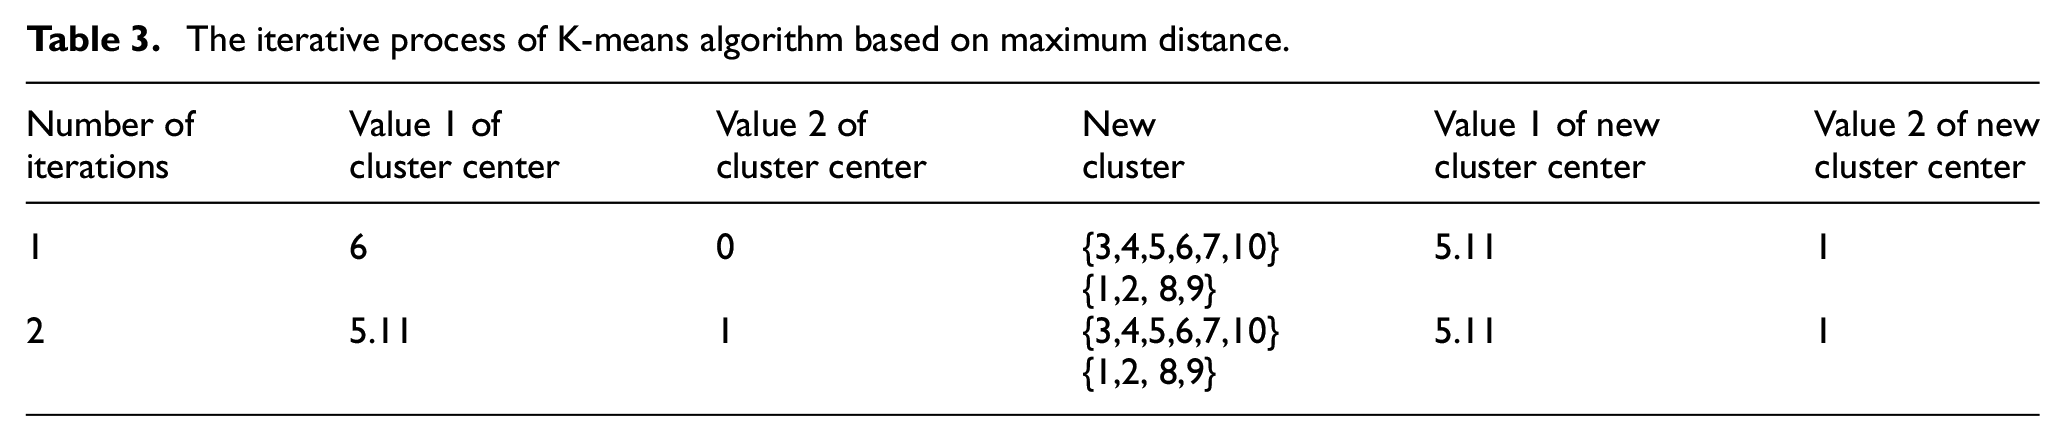
The improved algorithm is equivalent to selecting the cluster center selectively, which is more purposeful than the K-means algorithm, so the number of iterations is less.
The experimental results and discussion
Seedling growth environment curve based on K-means algorithm
The relative optimum environmental value is calculated at the time interval of X hours (x can be taken as an integer value of 1, 2, 3, etc.). Three clustering centers are set up to obtain the relative optimum soil temperature (the temperature clustering center of the intermediate cluster is considered to be the relative optimum temperature) and the relative optimum soil humidity (the humidity clustering of the intermediate cluster). Class centers are considered to be relative optimal humidity, relative optimal air temperature (intermediate cluster temperature cluster center is considered to be relative optimal temperature), and relative optimal air humidity (intermediate cluster humidity cluster center is considered to be relative optimal humidity). In the data mining module, the K-means algorithm clustering every x hours of sensor data is clustered.
The K-means algorithm based on the maximum distance are analyzed and compared with the original K-means algorithm and the optimal partition K-means algorithm in this article. Because F-measure combines the accuracy and recall, F-measure is used to evaluate the clustering effect. Five different feature extraction rates are set in the experimental process.
Discussion
The comparison of F measures of the three clustering algorithms is shown in Figures 4 and 5. Compared with the original K-means clustering technology, the improved K-means clustering method reduces the total time consumption by 0.23 s on average and increases the F measure by 7.67%. The above experimental results show that the clustering effect and time performance of the improved algorithm is the best.
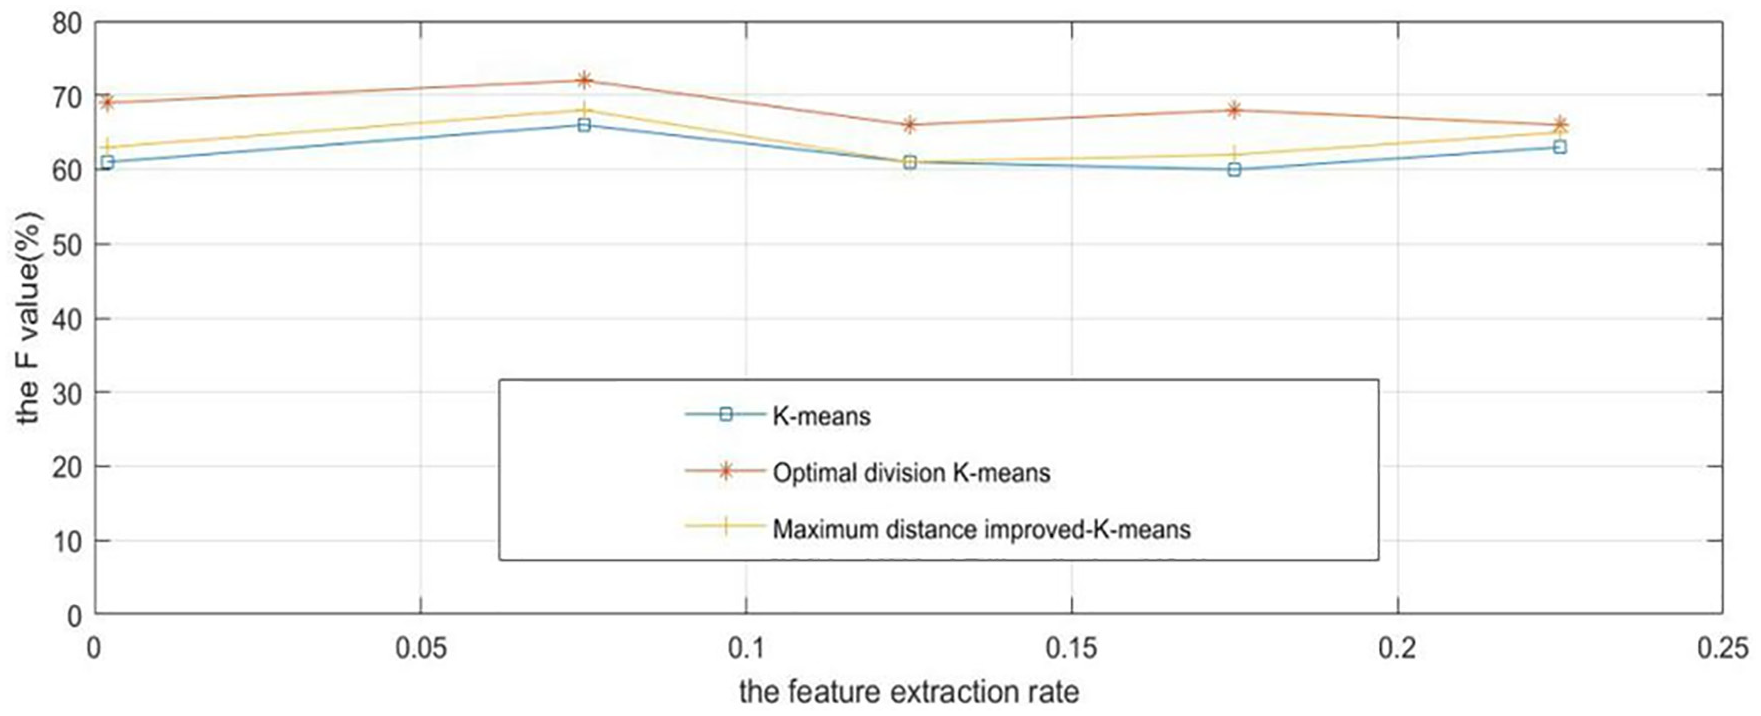
The F-value comparison of the clustering algorithms.

The time-consuming comparison of the clustering algorithms.
The simulation experiments in this experiment were performed on the theories and algorithms of the data processing module and data mining module of agricultural data. It was found that the K-means algorithm has a fast initialization speed because it selects the initial cluster center randomly. However, due to the randomness of the cluster center selection in the K-means clustering algorithm, it is easy to cause two data that should belong to the same cluster to be regarded as two cluster centers mistakenly, which result an increase in the total number of iterations in the clustering process. This makes the total clustering time increasing, and it is easy to fall into a local optimum. The initial cluster center selected by the improved algorithm is highly distinguishable. It reduces the number of iterations and avoids falling into a local optimum; it improves the F-value of the cluster and has strong stability on the other hand. The improved k-means algorithm in this article can be used to propose optimization schemes for data stream processing that affect the performance of agricultural databases, and to optimize further data mining.
Conclusion and prospection
Focusing on the strategic needs of modern agricultural development, this article applies the IOT technology and the data mining technology in big data to agricultural production, and builds a smart agricultural system to simulate the precise management and control of agricultural greenhouses. Based on the in-depth analysis and thinking of smart agriculture based on the IOT and big data technology, the K-means clustering algorithm based on the maximum distance method to select the initial cluster center is proposed. And the data storage, processing, and mining in the agricultural big data obtained with the IOT technology are studied and optimized through the experimental simulation. This article uses the IOT to collect a large amount of environmental data for crop greenhouses, and uses the improved algorithm to select a relatively optimal data as a clustering method for environmental reference data in the greenhouse in the next cycle. The algorithm has good clustering effect and time performance.
Due to the actual needs and the limitation of the data provided, only the clustering method is used in the data mining research of agricultural big data in this article. There is no sufficient information to control the mining, and the value of a large amount of data has not been fully realized. Neural network and other classification technologies can be used to analyze and predict the output of specific agricultural products by using the sensor data stored in the management system in the future.
Footnotes
Handling Editor: Andino Maseleno
Declaration of conflicting interests
The author(s) declared no potential conflicts of interest with respect to the research, authorship, and/or publication of this article.
Funding
The author(s) disclosed receipt of the following financial support for the research, authorship, and/or publication of this article: This work was supported by youth project of science and technology research program of Chongqing Education Commission of China (No. KJQN201803107), and supported by Special general projects for technological innovation and application development of Chongqing Science and Technology Commission of China (No. cstc2019jscx-msxm1279).